
Desertification status mapping in Muttuma Watershed by using Random Forest Model
2022-03-22 10:49DharumarajanThomasBishop
S.Dharumarajan,Thomas F.A.Bishop
1.ICAR-National Bureau of Soil Survey and Land Use Planning,Regional Centre,Hebbal,Bangalor 560024,India
2.Faculty of Agriculture and Environment,The University of Sydney,Sydney,NSW2006,Australia
ABSTRACT Potential of the Random Forest Model on mapping of different desertification processes was studied in Muttuma watershed of mid-Murrumbidgee river region of New South Wales,Australia.Desertification vulnerability index was developed using climate, terrain, vegetation, soil and land quality indices to identify environmentally sensitive areas for desertification.Random Forest Model(RFM)was used to predict the different desertification processes such as soil erosion,salinization and waterlogging in the watershed and the information needed to train classification algorithms was obtained from satellite imagery interpretation and ground truth data.Climatic factors (evaporation, rainfall, temperature), terrain factors(aspect,slope,slope length,steepness,and wetness index),soil properties(pH,organic carbon,clay and sand content)and vulnerability indices were used as an explanatory variable.Classification accuracy and kappa index were calculated for training and testing datasets.We recorded an overall accuracy rate of 87.7% and 72.1% for training and testing sites, respectively.We found larger discrepancies between overall accuracy rate and kappa index for testing datasets (72.2% and 27.5%,respectively)suggesting that all the classes are not predicted well.The prediction of soil erosion and no desertification process was good and poor for salinization and water-logging process.Overall, the results observed give a new idea of using the knowledge of desertification process in training areas that can be used to predict the desertification processes at unvisited areas.
Keywords:desertification processes;vulnerability indices;Random Forest Model;extrapolation
1 Introduction
Desertification is the gradual degradation of dryland ecosystems due to changes in climate and improper human activities by which biologically productive lands are transformed into wastelands.The cumulative effects of deforestation, overgrazing, improper cultivation and increasingly extreme weather events are the major causes of desertification.Global estimates show that about 25% of the Earth's lands (app 3.6 billion hectares) are desertified and about 12 million hectares are lost every year due to desertification processes (UNCCD, 2014).The most frequent direct drivers of land degradation and desertification are slope,land abandonment,floods,drought,erosion and urbanization(Dharumarajanet al.,2017;Kapović Solomunet al., 2018).Australia, the driest continent in the world where more than three-quarters of lands are arid or semi-arid, faces severe natural resource degradation problems due to unsustainable land use (Pickup, 1998).About 42% of arid and semi-arid lands of Australia are affected by severe (26%) to very severe(16%) desertification mostly due to soil erosion, loss of biodiversity and decreasing soil fertility (Ludwig and Tongway,1995).
There is a necessity for natural resource management researchers to identify efficient tools for the early detection of environmentally sensitive areas and classifying these into different levels of desertification vulnerability (Rajbanshi and Das, 2021).This would help policymakers to take appropriate action for combating desertification processes.Desertification involves a complex set of processes, which interact with space and time leading to a gradual decrease in land productivity.The combined action of climate,terrain,soil quality and human pressure results in land degradation and even irretrievable loss of lands suitable for agriculture or grazing.Integrated solutions based on socio-economical-ecological systems analysis helps in achieving the UNCCD target of Land Degradation Neutrality in 2030 (Keesstraet al., 2018;Dharumarajanet al.,2020)
Numerous mathematical models have been developed in different parts of the world to identify environmentally vulnerable areas for land degradation and desertification (Kosmaset al., 1999; Bassoet al.,2000; Salvati and Zitti, 2008; Bakret al., 2012; Dasguptaet al., 2013; Imbrendaet al., 2014;Trottaet al.,2015;Dharumarajanet al.,2018;Dharumarajanet al.,2020;Rajbanshi and Das,2021).Kosmaset al.(1999)mapped the desertification sensitivity index based on Soil Quality, Climate Quality, Vegetation Quality, and Management Quality indices by assigning a low score for less vulnerability and a high score for severe vulnerability towards desertification.Fuzzy membership and fuzzy interference rules system was developed by Dasguptaet al.(2013) to identify desertification vulnerable areas.Kosmoset al.(2013)identified rain seasonality, slope, land use cover and rate of land abandonment as important indicators responsible for land degradation and desertification.Since climate, soil,vegetation and land use play significant roles in the desertification of any area, systematic integration of these indices helps to identify environmentally vulnerable areas for desertification (Trottaet al., 2015).Dharumarajanet al.(2020) developed the desertification vulnerability index utilized in Andhra Pradesh State,India based on climate,land use,soil,and socioeconomic parameters, and identified 13% of lands as very highly vulnerable.
In addition to identifying desertification vulnerable areas,mapping the present status of desertification processes and its severity is essential for drawing a suitable combating plan since such information is not always available at the required temporal and spatial scale.Since desertification is a dynamic process,there is a need to update the map every 5 or 10 years for the preparation of comprehensive planning.Mapping a larger scale with high accuracy is always challenging and time-consuming (Vågenet al., 2016).In the recent past, machine learning algorithms have emerged as more efficient classifiers and efficient alternatives to conventional parametric algorithms in large-scale mapping (Roganet al., 2003).A variety of machine learning algorithms such as classification and regression tree, k-nearest neighbor, artificial neural network, multinomial logistic regression, logistic model trees, support vector machine and random forest model were tested by different authors in natural resources mapping.Recently, machine learning models were used by researchers for mapping landslide zonation(Douet al., 2015; Honget al., 2016), water erosion susceptibility(Mosaviet al.,2020a),earth fission hazard(Choubinet al.,2019),flood and erosion susceptibility (Mosaviet al., 2020b), salinity (Mosaviet al.,2021;Wanget al.,2021)and land degradation(Torabiet al.,2021;Yousefiet al.,2021).
In soil science, such machine learning algorithms have commonly been used in digital soil mapping due to advances in geographical information systems(Mc-Bratneyet al.,2003)and high-end computer technology together with freely available digital spatial data.Random Forest Model (RFM) is one of the widely used tree-based machine learning algorithms in natural resource mapping.The application of RFM in digital soil mapping was proved by several authors (Mc-Bratneyet al.,2003;Vågenet al.,2016).Random forest models have the potential to predict the soil property for an unknown location using its interrelationships with environmental variables such as digital elevation models (DEMs) (Dharumarajanet al., 2019),high-resolution satellite data (Odeh and McBratney,2000), legacy soil maps (Vaysse and Lagacherie,2017) or analysis of physical and chemical attributes of soil samples (Akpaet al., 2014).In digital soil mapping, soil point or polygon data are correlated with environmental variables (McBratneyet al.,2003) and the relationship between environmental covariates and soil information is fitted with a suitable model to derive soil information for unknown locations.These techniques can be applied for the prediction of both quantitative outputs such as soil organic matter content, clay, sand, silt, pH, and electrical conductivity using regression algorithms (Wiesmeieret al., 2010; Akpaet al., 2014; Dharumarajanet al.,2019) and qualitative outputs such as soil taxonomic units and soil texture using classification algorithms(McBratneyet al., 2003; Kiddet al., 2014; Dharumarajan and Hegde,2020).Although a number of studies have used the random forest model in digital soil mapping and land use classification, little attention was paid towards land degradation or desertification process mapping.The objective of the present study is to identify environmentally sensitive areas for desertification process and evaluate the potential of RFM for the prediction and extrapolation of different desertification processes in Muttuma watershed, New South Wales,Australia.
2 Materials and methods
2.1 Description of the study area
The Muttuma watershed is situated between 148°4.96′E,34°30.5′S latitudes and 147°10.4′E,34°58.6′S longitudes in the mid-Murrumbidgee river region of New South Wales, Australia, with a total area of 1,025 km2(Figure 1).The geology of Muttuma watershed consists of igneous Paleozoic deep and shallow marine sedimentary rocks, chers and mafic volcanic rocks.The physiography of Muttuma watershed is characterized by broad alluvial plains in central north,plains and undulating rises in west, rolling to steep hills in east, and steeper terrain in south and southeast region.The elevation ranges from 240-340 m in plains to 500-600 m in steep hills.Rudosols with Red Kandosols are the major soils in hill crests and ridgelines.Red and Brown Chromosols dominated in mid and upper slopes whereas Brown Dermosols and Brown Chromosols occupy the lower slopes and plains.Brown Sodosols were found in lower slopes and drainage depressions while Rudosols dominated over creeks and floodplains.The average annual rainfall is 625 mm and temperature ranges between 15.7-31.5°C in January and 1.9-12.7°C in July(Bureau of Meteorology, 2011).The major land uses are grazing and cropping which together occupy 83% of the land area.Wheat is the main dry land crop along with oats, barley, fiba beans, mustard seed and lupins.The dominant desertification processes in Muttuma watershed are water erosion, salinization, and waterlogging.Severity of water erosion varies with land covers.Sheet and rill erosion are categorized as slight erosion whereas gullies and ravines are classified as severe erosion.Salinization occurs mostly in cultivated lands, especially in irrigated areas.The undrained land parcels tend to accumulate standing water for longer durations of time on the surface, of which this condition is called waterlogging.The severity of waterlogging is determined based on the period of time the water remains stagnant.
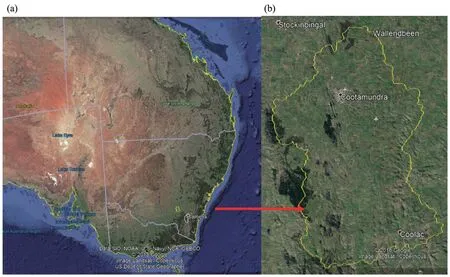
Figure 1 Location of(a)the study area in Australia(b)Muttuma Watershed
2.2 Derivation of desertification vulnerability index
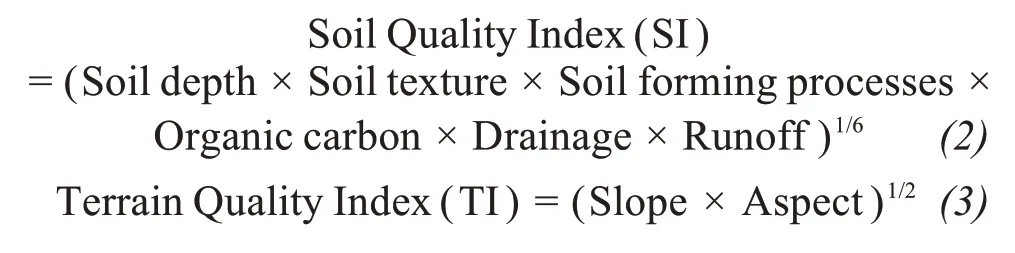
Soil, climate and land use directly or indirectly affect desertification processes (Bassoet al., 2012).Desertification Vulnerability Index (DVI) is computed by a geometric mean model based on the framework of MEDALUS (Mediterranean Desertification And Land Use) project, to delineate environmentally vulnerable areas for desertification (Kosmoset al.,1999).The components of DVI are climatic quality(CI), terrain quality (TI), soil quality (SI), vegetation quality(VI),and land utilization indices(LUI).

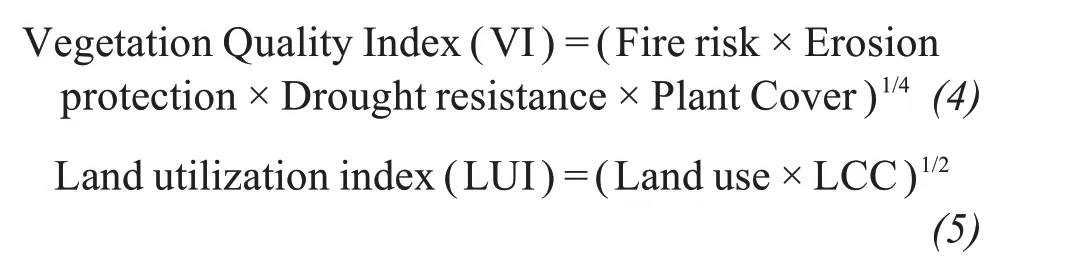
Soil, climate and vegetation quality parameters are quantified in relation to their influence on different desertification processes operating in the watershed.According to MEDALUS methodology, scores are assigned to each sub parameter between 1 (high quality) and 2 (low quality) (Kosmoset al., 1999).Climatic quality index is calculated based on aridity and the scores were assigned based on equal intervals.Soil parameters such as soil-forming process, drainage, run-off, soil depth, texture and organic carbon were derived from TERN soil data (Grundyet al.,2015).Terrain quality parameters slope and aspect were derived from AsterGDEM data (30 m resolution).Different classes and the assigned scores for soil and terrain parameters are provided in Tables 1 and 2.
The information on vegetation quality was derived from the NSW land use land cover map (scale 1:100,000) and was reclassified to derive the parameters responsible for desertification(Table 3).Like vegetation quality, land utilization index information was derived based on land use and land capability classification(LCC)(Table 4).
The geometrical average of each parameter has been classified according to regular intervals as suggested by Kosmaset al.(1999)i.e., Good Quality: 1.00 to 1.33; Moderate: 1.33 to 1.66; Poor: 1.66 to 2.00.Final desertification vulnerability index was calculated based on geometric average of all five indices and classified into different vulnerability classes as given Table 5.

Table 1 Assigned scores of soil quality indices for calculation of DVI
Table 2 Assigned scores of terrain parameters for calculation of DVI
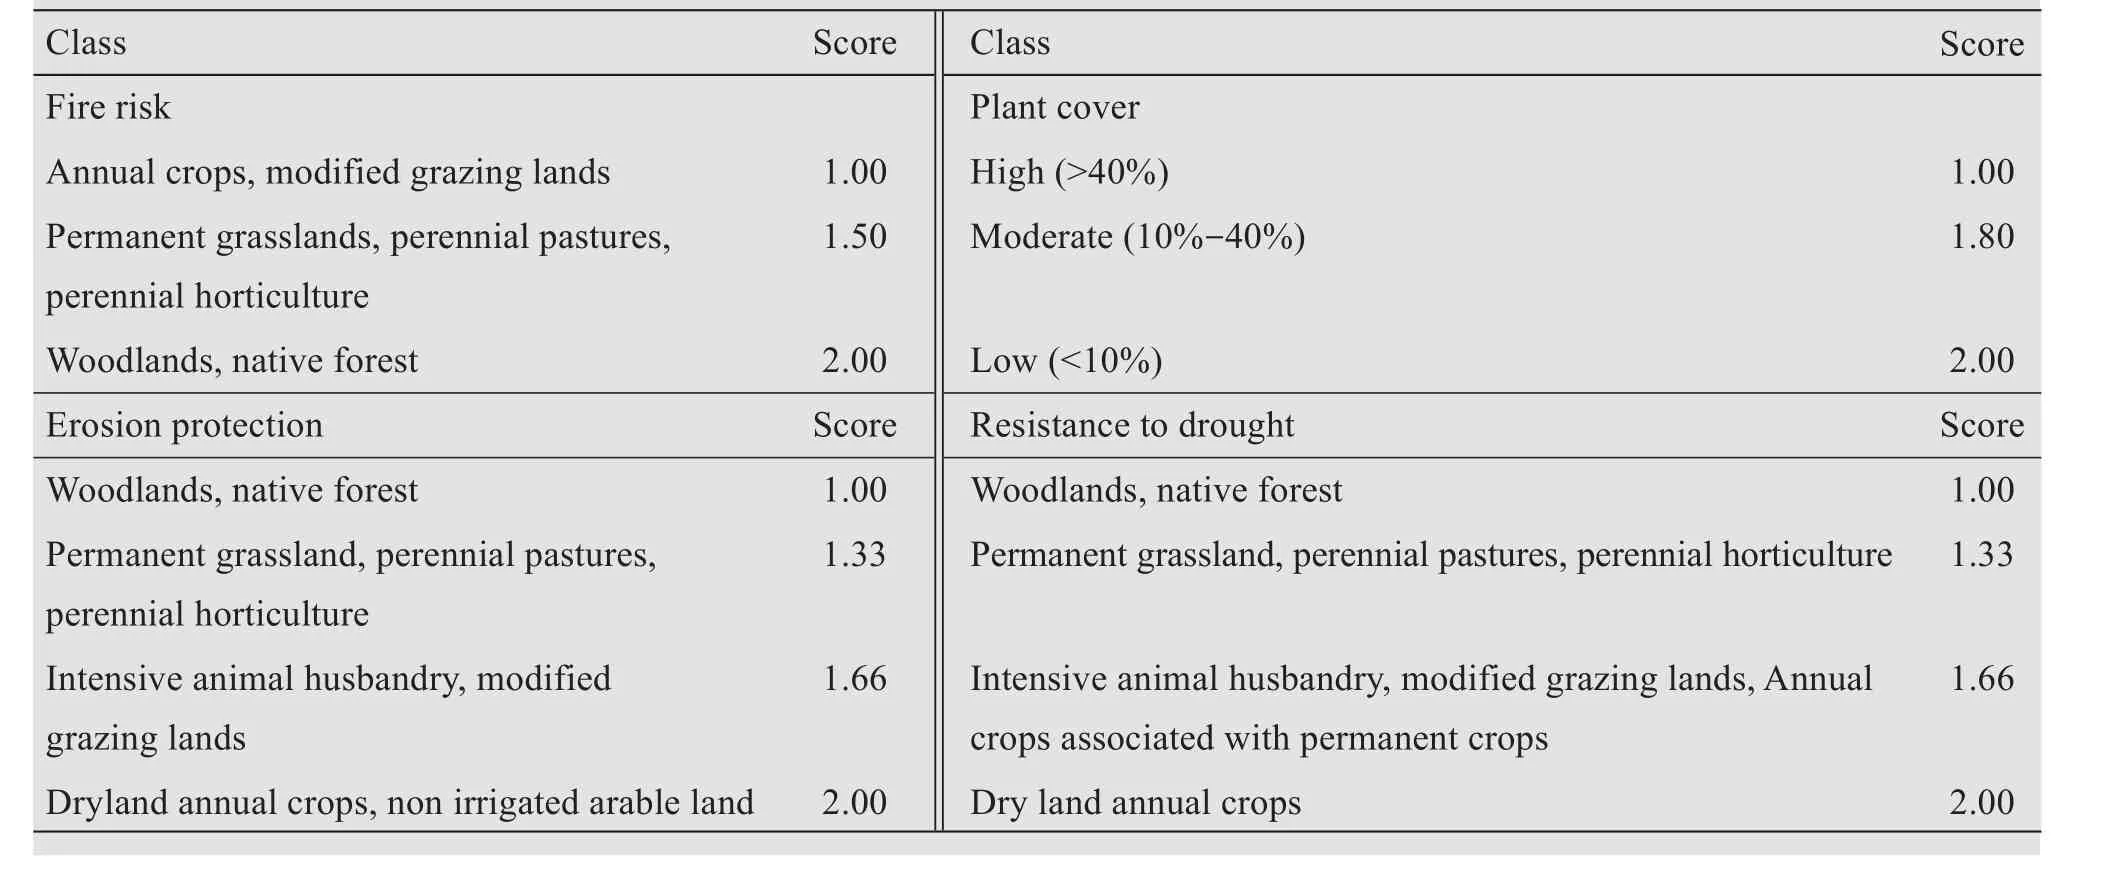
Table 3 Assigned scores of vegetation quality parameters
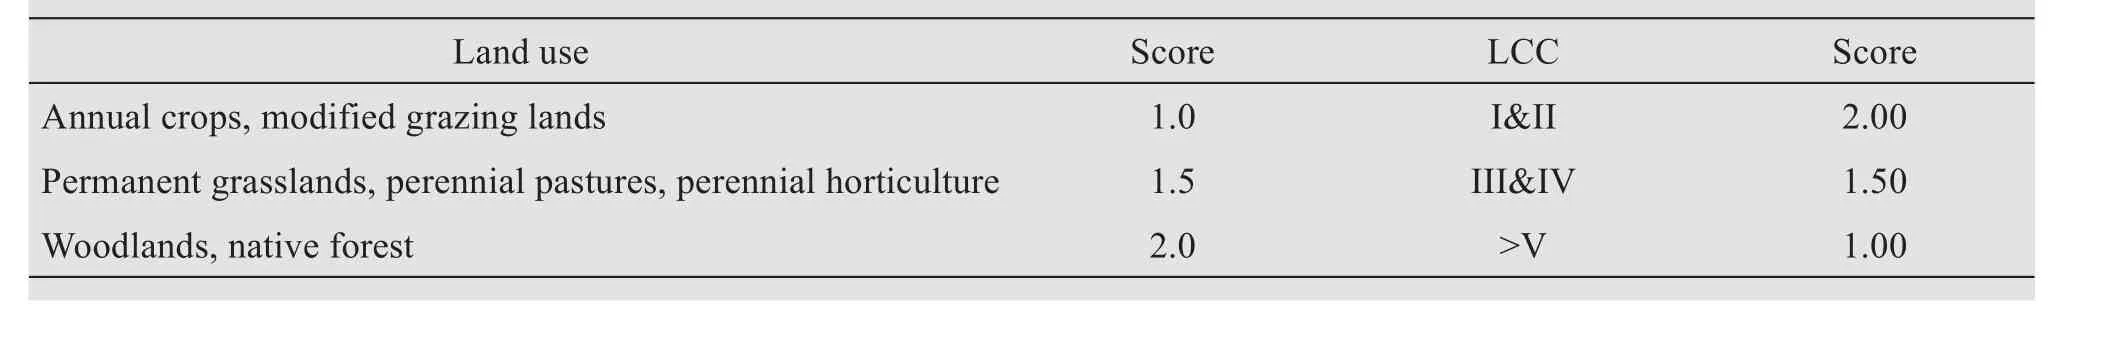
Table 4 Assigned scores of land utilization index

Table 5 Description of desertification vulnerability indices classes
2.3 Environmental covariates used for modelling
Relief parameters such as slope, aspect, wetness index and LS factor were derived from ASTERGDEM at a resolution of 30 m using ArcGIS10 Geomorphometry toolbox.Climatic parameters such as maximum temperature, average annual rainfall and average evaporation were collected for 15 years of data (2001-2015).Climate data were obtained from the SILO repository of the Bureau of Meteorology for 24 locations of watershed and interpolated for model building (https://www.longpaddock.qld.gov.au/silo/).Soil chemical data such as pH, organic carbon, clay and sand in surface (0 - 30 cm) and sub-surface(60-100 cm) were extracted at a resolution of 90 m from the soil grid of Australia (Grundyet al., 2015).Normalized Difference Vegetation Index (NDVI) and Enhanced Vegetation Index (EVI) of 16 days with 250 m resolution was extracted from MODIS data(MOD13Q1) for 15 years (2001-2015) and average NDVI and EVI data was used for modeling.In addition to environmental covariates, desertification vulnerability indices were used as additional variables for prediction.All the data layers were brought to the same projection.A total of 23 predictor variables were used in this study(Table 6).
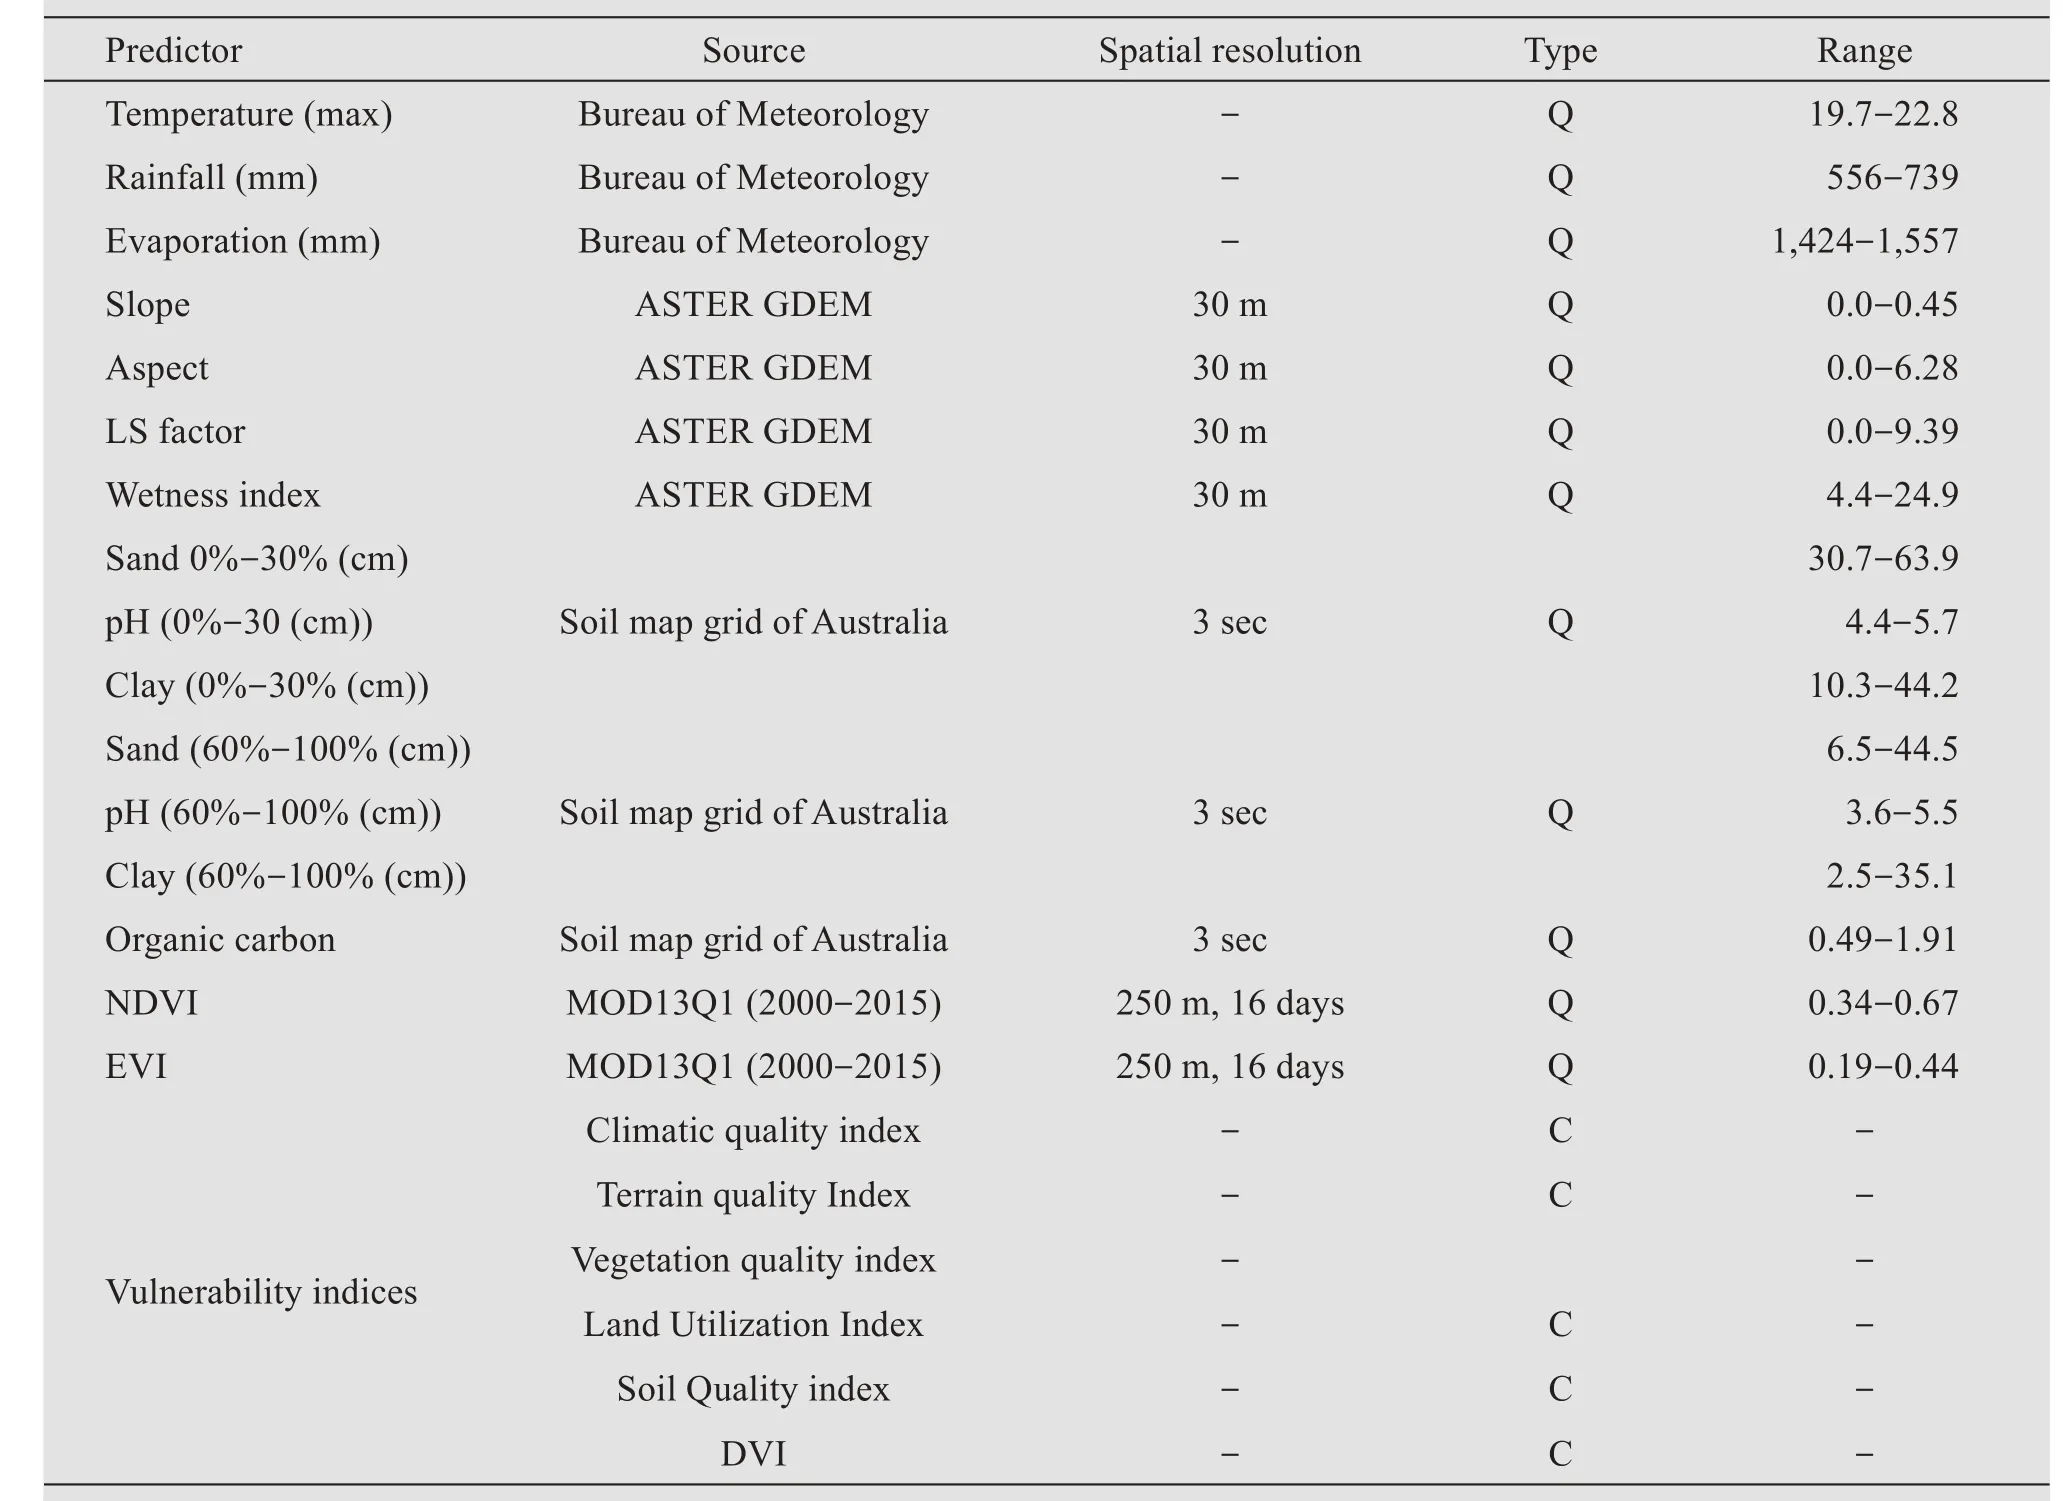
Table 6 Datasets used for model building
2.4 Spatial extrapolation of desertification processes using Random Forest Model
Random Forest Model (RFM) is a machine learning algorithm which works based on the assemblage of several classification and regression trees by using two levels of randomization for every tree in the forest(Breiman,2001).RFM improves the prediction accuracy (Breiman,2001)and reduces model overfitting compared to many other prediction models and it is insensitive to noise or weak prediction variables because RFM selects the most important variable at each node split.Further, RFM is insensitive to missing values and outliers.Random forest fit separate decision trees to a predefined number of bootstrapped data sets.We used random forest 4.6 package in R environment to predict different desertification processes.The random forest algorithm ranks the relative importance of each predictor based on the regression prediction error of the out-of-bag (OOB) (Breiman,2001).Out-of-bag is a portion of data (approximately one-third of dataset) and is not used in building the tree but used to test the tree.The prediction error is calculated as the classification error rate and reported as mean percent decrease in classification rate for classification models.
2.5 Model accuracy assessment
The prediction performance of the model was evaluated separately for training and testing datasets.Training datasets are a subset of the study area and the information needed to train classification algorithms obtained through interpreting satellite imageries combined with ground truth (Figure 2).The remaining study area is used as a testing dataset.Two classification accuracy indices were used for the assessment of accuracy.1.Overall accuracy rate and 2.Kappa index.Overall accuracy rate is the ratio between the correctly predicted and the total number of classified pixels.The Kappa index is calculated based on expected accuracy and observed accuracy.Generally, a good model will have overall accuracy rate and Kappa index close to 1.
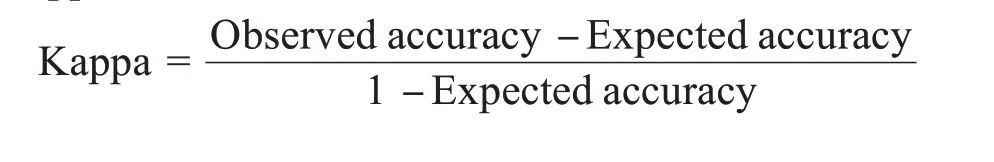
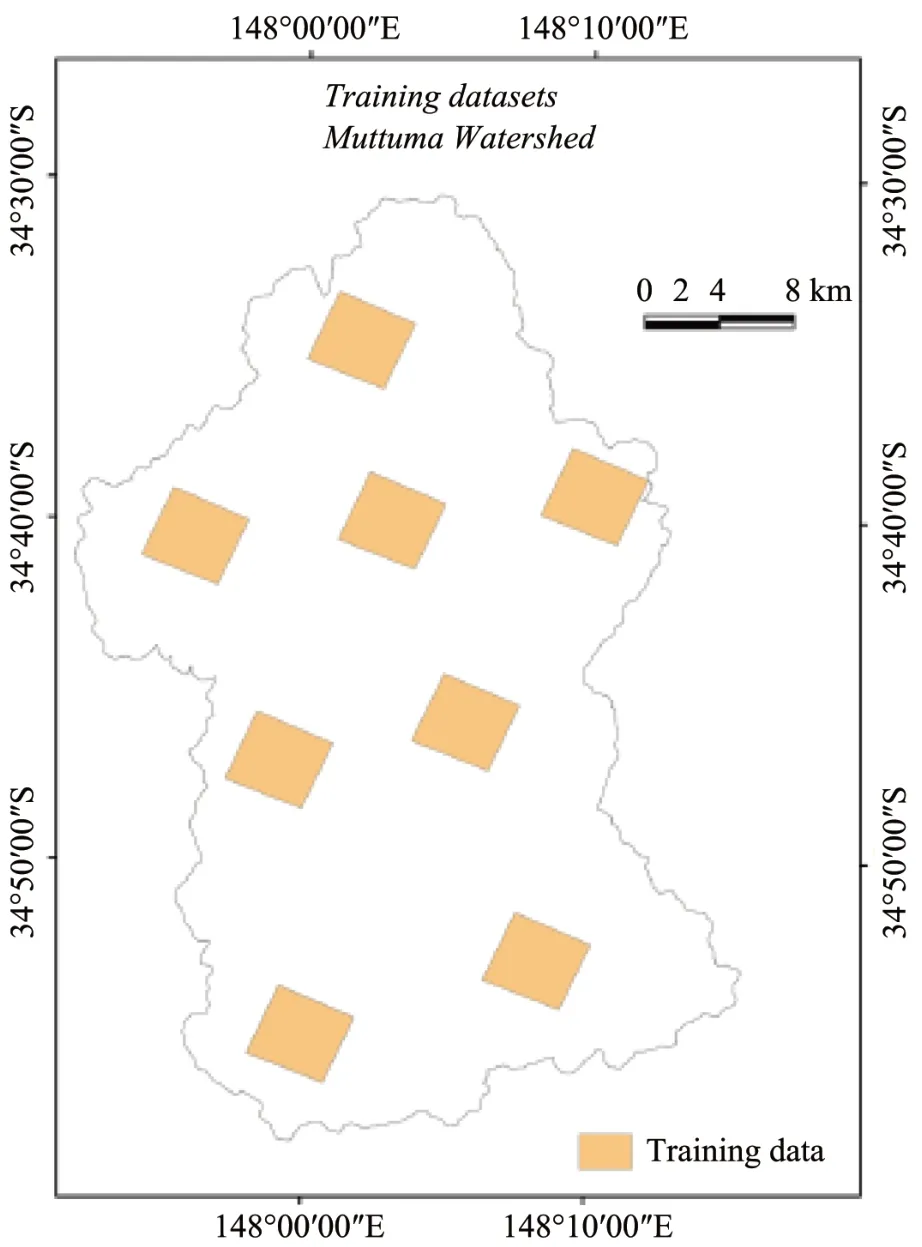
Figure 2 Training areas for desertification prediction
3 Results and discussions
3.1 Desertification Vulnerability Index
The Desertification Vulnerability Index (DVI)was evaluated as per MEDALUS methodology and this model allows flexibility for the calculation of different indices based on data availability (Trottaet al.,2015).Aridity index was developed based on annual rainfall and potential evapotranspiration which ranged from 0.28 to 0.36 and the entire watershed is classified as semi-arid.Slope and aspect are considered for the derivation of terrain index.Gently sloping lands(3%-8%) occupies 55.7% and moderately sloping lands (8%-15%) occupies 27.2% of the watershed.Nearly level to very gently sloping lands(1%-3%)occupies 10.0% and steeply sloping lands (15%-25%)occupy 7.01% of the watershed.Aspect analysis of DEM reveals that 28.06% of the lands facing east and southeast direction and 26.43% of lands facing west and northwest direction.The integration of slope and aspect showed that 49.5% of lands are under moderate category followed by poor category(35.8%).
Soil quality index was developed based on soil depth, soil texture, soil forming processes, soil organic carbon, runoff and drainage classes.The results show that 61.5% of lands are under moderate quality followed by 20.5% of lands under good category and 18% of lands are classified as poor category.The areas with the most sensitive soils are found in the western part of Muttuma watershed where soils are shallow in depth and coarse texture and are subjected to severe runoff.
Vegetation quality index assessment reveals that 92.5% of the area under moderate quality lands since most of the watershed under grazing lands is moderately resistant to drought and fire risk.Land capability class was analyzed to derive the land utilization index.LCC IV class lands (lands that have very severe limitations that reduce the choice of the crops or that require very careful management) occupy 27.5% of watershed followed by LCC III (mapping units have severe limitations that reduce the choice of crops or that require special conservation practice) lands(27.2%).Good cultivable land with slight limitation(LCC II class) occupies 16.3% of the watershed area.LUI results revealed that 27.8% of lands are over-utilized whereas 28.4% of lands are underutilized in the study area.
The DVI results (Figure 3) revealed that 17.8% of lands are identified as critical condition and these lands are highly degraded and subjected to very high erosion rates due to intensive cultivation, overgrazing and frequent fires.These lands are major priority lands and there is a need for immediate action to combat desertification.Lands in west and eastern part of the watershed come under critical areas for desertification which have low soil quality and steep slopes.About 50.49% of lands are classified as fragile conditions and these areas are subjected to moderate to high erosion rates due to intensive cultivation, overgrazing or frequent fires and 27.67%of lands are classified as potential lands for desertification vulnerability.Rajbanshi and Das (2021) used a similar approach to monitor land sensitivity to desertification in India and found that 33.76% of the land is under a very high critical zone.The present assessment of environmentally vulnerable areas for desertification and land degradation was based on MEDALUS methodology.Though the model is simple and based on easily available data, the main limitation is that equal weightage was assigned to all the indicators for the derivation of DVI (Salvati and Zitti, 2008; Symeonakiset al.,2016).However, the results provide a baseline for the appraisal of desertification and land degradation and also to monitor the improvement as well as degradation trends.
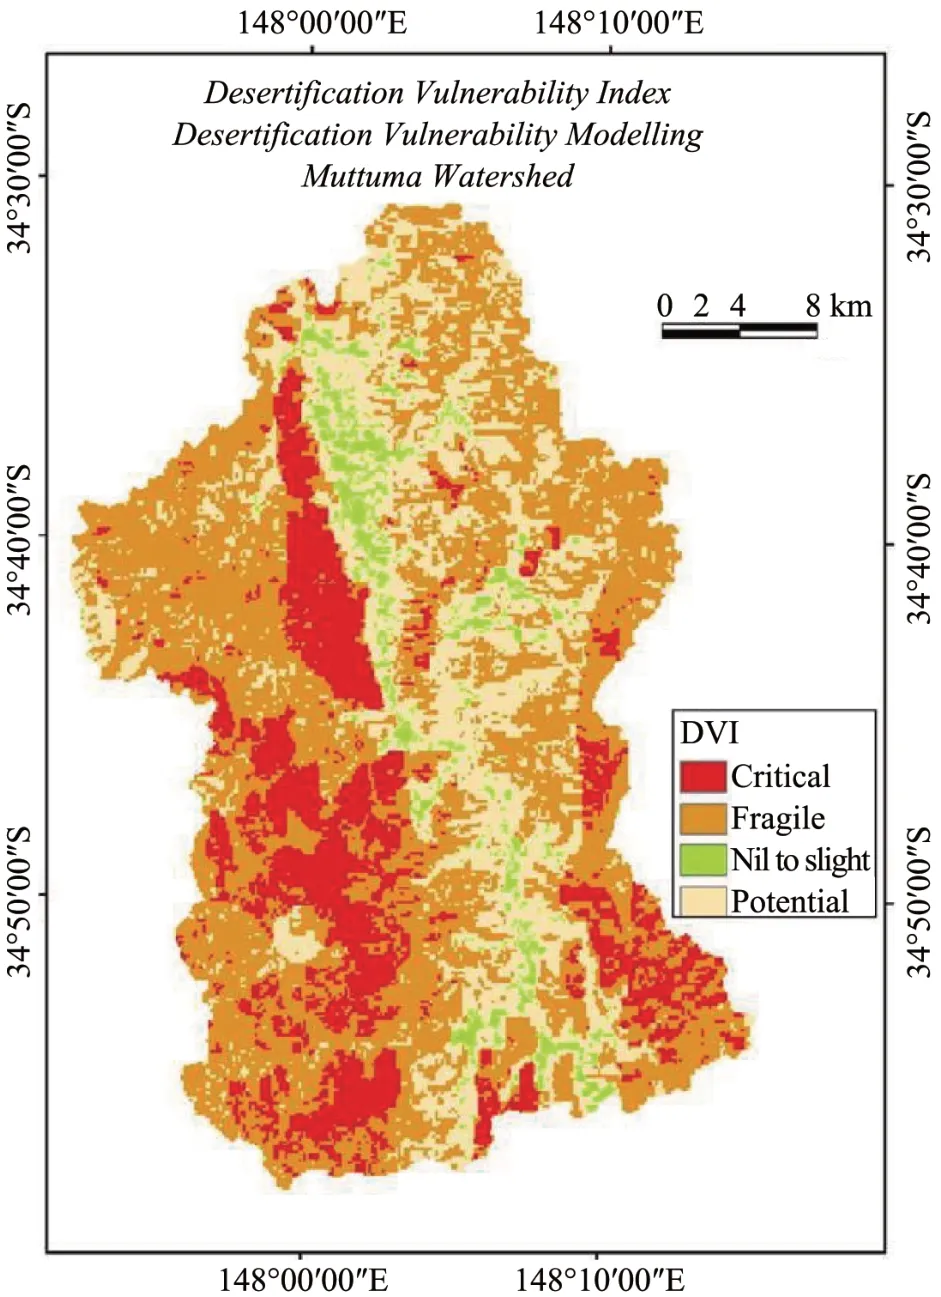
Figure 3 Desertification vulnerability index map
3.2 Performance of random forest model in mapping of desertification process
Random forest models were quite successful in determining different desertification processes operating in the watershed.A total of 6,974 pixels were used as a training dataset.Number of trees(ntree)for the final model was selected based on error estimates from the OOB sample.Initial decision tree was produced with 1,000 trees and the OOB overall error stabilized at 500 trees; therefore, 500 was used for the parameter ntree in the final model.Number of variables tried at each split is 4.OOB correct classification rate is 87.7%.The confusion matrix (Table 7) shows that out of 1,814 pixels of soil erosion class, 1,337 pixels are correctly predicted (user accuracy 73.7%) and out of 4,690 pixels of no desertification class, 4,508 pixels were correctly predicted (user accuracy 96.1%).Waterlogging and salinization processes are under classified with user accuracy of 59.7% and 48.7%, respectively.The kappa index for training dataset is 72.2%.
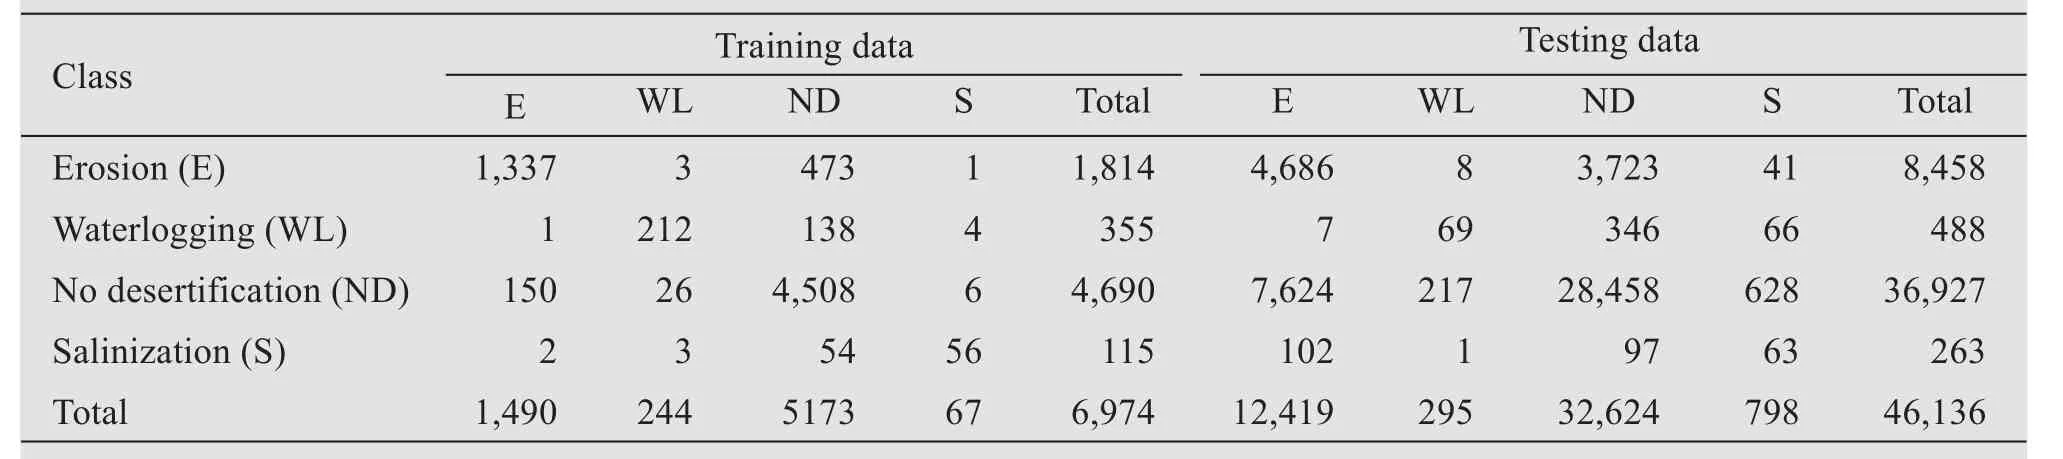
Table 7 Confusion matrix for training(pixels)and testing(pixels)
Overall classification accuracy index and kappa index were also calculated for testing datasets.The results show that overall accuracy rate is found to be good (72.1%) whereas the kappa index was very low(27.5%).Larger discrepancies between overall accuracy rate and kappa index suggests that all the classes are not predicted well.The prediction was good for soil erosion and no desertification process classes(55% and 77%, respectively).Prediction for waterlogging and salinization process was very low (14%and 24%,respectively).The overall accuracy of classification and kappa index depend largely on the frequency distribution of observations between classes.Since water-logging and salinization are found in limited areas, these categories are not predicted well.Taghizadeh-Mehrjardet al.(2012) reported classes with fewer samples were predicted less accurately because of the difficulty of separating soil classes in feature space with limited observations.This'class imbalancing' problem was reported by numerous researchers (Taghizadeh-Mehrjardet al., 2012; Dharumarajan and Hegde, 2020).Our results provide a new idea of using the knowledge of desertification process in training areas that can be used to predict desertification processes at unvisited areas (Grinandet al.,2008).The analysis of the predicted map (Figure 4)shows that 15.6%, 0.75% and 0.35% of watershed is affected by soil erosion, water-logging and salinization processes.This model performed well for soil erosion class which may be due to the nature of environmental variables used in the model (Adhikariet al., 2013).The prediction performance of the model for water-logging and salinization process could also be improved by additional covariates such as electrical conductivity (EC), parent material and drainage.The validation method revealed the importance of the location of test pixels and validation site on evaluation of predictive ability of the model (Grinandet al.,2008).Overall accuracy rate is more prone to over estimation in training datasets since training and testing samples are located close together compared to testing dataset (Friedlet al., 2000; Muchoney and Strahler, 2002).We observed a gap of 15.1% of overall accuracy rate between training and testing sites.

Figure 4 Predicted desertification map
Publications on predictive soil models (Moran and Bui, 2002) outlined the shift from research to operational phase in digital soil mapping.The same trend is likely to emerge in land degradation/desertification process mapping.Vågenet al.(2016) predicted land degradation risks such as acidity and alkalinity from predicted maps using the RF model.If expert knowledge of the desertification process at a particular location is effectively captured, we can extrapolate to surrounding areas based on spatial correlation of available predictors.The training site relies on survey or experience and local landscape knowledge (Kiddet al., 2014).Another advantage of the RF model is that this model can be applied to any legacy data having desertification/land degradation processes to derive either new mapping or improve existing mapping.(Kiddet al.,2014).
3.3 Importance of predictor variables
The advantage of RFM over the classical multiple regression model is that RFM spreads the importance of predictors across all the predictor variables (Cutleret al., 2007).The RF model estimates the importance of predictor variables based on how best or worst the prediction would be if one or more variables were removed (Prasadet al., 2006) and also guards against the elimination of good predictor variables which are important for the model.Variable importance function of RFM was used to assess the importance of predictor variables used to predict desertification processes.Large influence of climatic parameters (evaporation,rainfall, temperature), vegetative indices (EVI, NDVI) and terrain attributes (aspect, slope, wetness index) on desertification processes was observed (Figure 5).The importance of predictor is assessed based on mean decrease Gini (MDG) measure which is calculated for each predictor variable as the cumulative increase in data purity associated with each decision tree node split.Evaporation is the most important variable in predicting desertification processes followed by rainfall and temperature.Increase in evaporation rates accelerates the process of desertification.Vegetation indices (EVI, NDVI) are the next most important predictors in predicting desertification processes.Soil organic carbon emerged as the most important soil property in predicting desertification.Soil organic matter is identified as the most important reliable indicator for assessing degree of land degradation and desertification (Kosmoset al., 2013).Though vulnerability indices(DVI,LUI,CI,TI,SI)are less important in prediction, they improve the accuracy rate.Land utilization index has emerged as more important index based on mean decrease accuracy data.
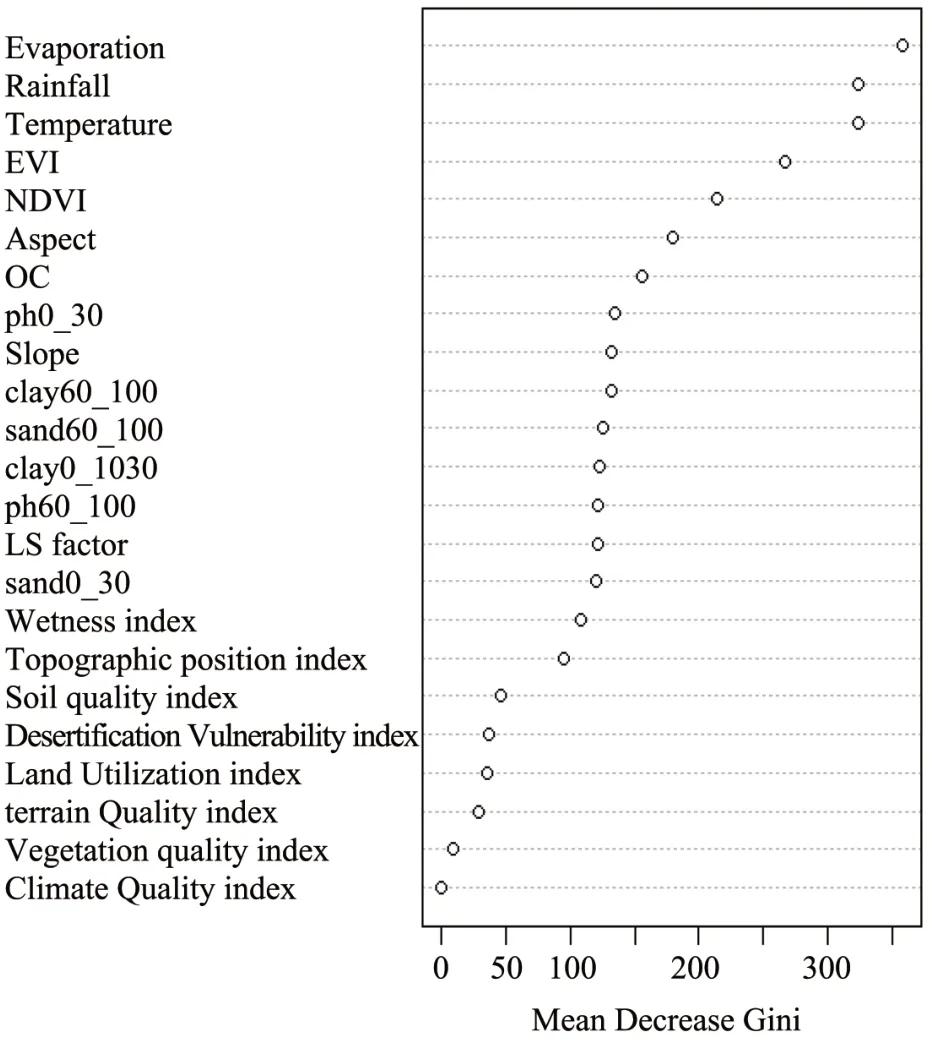
Figure 5 Random forest importance of covariates on desertification processes
4 Conclusions
This study provides a new idea of expert knowledge of desertification processes that could be used to perform extrapolation for unvisited locations.Geometric mean model based desertification vulnerability index revealed that 17.83% of lands are identified as critical lands and immediate action is needed to arrest desertification processes.Random forest model classification algorithm was used to extrapolate desertification process for the entire watershed.We observed overall accuracy rate of 87.6% and 72.1% for training and testing sites, respectively.The prediction was accurate for soil erosion and no desertification process(50%and 77%,respectively)and inaccurate for salinization and water-logging process (24% and 14%, respectively).Evaporation has emerged as the top most predictor followed by EVI and rainfall.This study offers not only extrapolation of desertification processes from training site to entire study area but also quick updating desertification maps in different time intervals.
Acknowledgments:
The authors would like to thank the Department of Education and Training, Government of Australia for the Endeavour Research Fellowship and Sydney Institute of Agriculture,The University of Sydney for providing their support to conduct this study.The authors also would like to thank anonymous reviewers for their valuable comments and suggestions to improve the quality of the paper.
 Sciences in Cold and Arid Regions2022年1期
- Sciences in Cold and Arid Regions的其它文章
- Research progress on behaviors and environmental effects of mercury in the cryosphere of the Tibetan Plateau:a critical review
- Numerical simulation of vibrational response characteristics of railway subgrades with insulation boards
- Simulating the effect of wind erosion on aeolian desertification process of Horqin sandy land and its significance on material cycle:a wind tunnel study
- Geographic range size patterns across plants and animals of Xinjiang,China
- Spatial and temporal patterns of solar radiation in China from 1957 to 2016
- Guidelines to Authors