
Connective tissue growth factor expression hints at aggressive nature of colorectal cancer
2022-03-16 06:25IshratParveizBhatTahseenBilalRatherIrfanMaqboolGowharRashidKulsumAkhtarGulzarBhatFazlQParrayBesinaSyedIshratYounasKhanMohsinKaziMuhammadHussainMudassarSyed
Ishrat Parveiz Bhat, Tahseen Bilal Rather,Irfan Maqbool, Gowhar Rashid, Kulsum Akhtar, Gulzar A Bhat, FazlQParray, Besina Syed, Ishrat Younas Khan,Mohsin Kazi,Muhammad D Hussain, Mudassar Syed
Abstract
Key Words: Connective tissue growth factor; Quantitative real time polymerase chain reaction; Immunohistochemistry; Western blotting; Colorectal cancer
INTRODUCTION
Colorectal cancer (CRC) ranks 3rdworldwide in terms of prevalence and is the second most common type of cancer in terms of mortality, with bowel cancer being the fourth most common cancer and rectal cancer being the eighth most common cancer in world. In 2020 , more than 1 .9 million new CRC cases including the anus and 935000 deaths were expected, accounting for about one in every ten cases and deaths[1 ].Transitioned countries have a four-fold higher incidence rate than transitional countries, but there is less difference in death rates due to the higher fatality rate in transitioning countries[2 ]. However, most of the cases and deaths are attributed to modifiable risk factors, such as smoking, certain types of diets, high alcohol consumption, sedentary lifestyle, and being over-weight or obese, and thus potentially evadable. Other clinicopathological characteristics like age, family history of CRC or personal history of inflammatory bowel disease or colon polyps and many other inherent risk factors that cannot be modified have progressively been recognized as contributing to a more individual prognosis prediction in CRC[3 ,4 ]. CRC is a disease of modernity and heterogeneity: It has the highest rates of incidence and almost 60 % of cases are encountered in developed countries. In India, the age-standardized average for CRC is poor, at 7 .2 per 100000 for men and 5 .1 per 100000 for women[3 ].
Connective tissue growth factor (CTGF) or CCN-family protein 2 (CCN2 ), is a member of the CCN family. The acronym CCN was assigned to this family after the initials of the first three proteins which include cysteine rich-61 (Cyr61 /CCN1 ),connective tissue growth factor (CTGF/CCN2 ) and nephroblastoma overexpressed(Nov/CCN3 )[5 ]. WNT1 inducible signaling pathway proteins WISP1 /CCN4 ,WISP2 /CCN5 and WISP3 /CCN6 are other members of this family[6 ]. These proteins manifest roles in cellular mechanisms like cell proliferation, apoptosis, cell-cell adhesion, ion-transport, extracellular matrix production, growth arrest, migration in numerous cell types, chemotaxis and motility[7 ]. CTGF is also related to growth of bone, cartilage, angiogenesis and is associated with a number of biological response modifiers[8 ,9 ]. CTGF expression has been linked to a variety of disorders, including diabetic nephropathy, arthritis, cardiovascular disease, and retinopathy as well as many types of malignancies[10 -14 ]. CTGF shows an aberrant expression in variety of cancers like pancreatic cancer cells[12 ], breast[15 ], esophageal cancers[11 ], in gliomas[10 ] and invasive melanomas[16 ]. Expression studies of CTGF in CRC have been reported by some groups[17 ,18 ], but no such study has been conducted in our population to date. The Kashmir valley, located in India's extreme north, is very unique in its climate, diet and geology. CRC is the fourth most prevalent kind of cancer in the Kashmir valley, after stomach, esophageal, and lung with a significant increase in a number of cases[19 ]. To further explore the potential role of CTGF in CRC, we looked at its expression and localization and compared the findings to critical clinicopathological parameters like tumor grade, tumor-node-metastasis (TNM) stage,Duke stage, lymph node metastasis, lymphovascular invasion (LVI), perineural invasion (PNI) and so on. We also performed a survival study analysis on the CRC patients to see whether CTGF has a prognostic role in the disease. In patients with CRC, TNM staging remains the most important prognostic predictor. The systemic spread of tumor cellsviametastasis is the major factor that leads to cancer recurrence and prognosis. As a result, including LVI and PNI into the present TNM staging method may provide a more accurate indication of patient prognosis in any stage of CRC, allowing for more effective adjuvant therapy planning and patient follow-up.
MATERIALS AND METHODS
Patient specimens
Seventy-one (n= 71 ) histopathological confirmed human CRC tissues along with adjacent normal tissues (study controls) were taken for the study, which included 38 males and 33 females. The specimens were taken from the subjects who underwent primary surgical resection for CRC at the Department of General and Minimal invasive Surgery, Sher-i-Kashmir Institute of Medical Science (SKIMS) Srinagar.Patients who received neoadjuvant or chemoradiotherapy were excluded from our study. Specimens were preserved in RNA Later (Sigma-Aldrich Burlington, MA) for RNA extraction and held in -80 ℃ till further processing. For immunohistochemistry(IHC), formalin fixed and paraffin embedded blocks of the same specimens and their adjacent normal blocks were collected from the Department of Pathology, SKIMS. Both the samples and blocks were taken in accordance with SKIMS Research Ethics Committee’s approved protocol and with the patient’s written consent.
RNA isolation and cDNA synthesis and real-time polymerase chain reaction
Total RNA was extracted by the Trizol method (Invitrogen Waltham, MA, United States)[20 ]. The absorbance at A260 /280 of 1 .8 -2 was considered “pure” for RNA. After DNase-I (Qiagen) treatment, asperthe manufacturer’s instructions, complementary DNA (cDNA) was synthesized using RevertAid First Strand cDNA Synthesis Kit(#K1622 ; Thermo Scientific Ltd, Waltham, MA, United States). In a final volume of 20 μL, 1 g RNA was reverse transcribed using AMV Reverse Transcriptase and random hexamers. The cyclic conditions were 5 min at 25 ℃, then 60 min at 42 ℃ and finally 5 min at 70 ℃. Quantitative real time polymerase chain reaction (qRT-PCR) was done using SYBR Green Master Mix (Thermo Fisher Scientific Ltd) in Piko-Real PCR machine (Thermo). Experiments were carried out in triplicates with effects of each being standardized against the housekeeping gene GAPDH. The following primers were used; CTGF-fp: 5 ’CTCCTGCAGGCTAGAGAAGC3 ’; rp: 5 ’GATGCACTTTTTGCCCTTCTT3 ’. GAPDH-fp: 5 ’CACCACCAACTGCTTAG3 ’; rp: 5 ’CTTCACCACCTTCTTGATG’. The Cycle Threshold (Ct) was used to describe the expression of CTGF messenger RNA (mRNA). The relative expression levels were determined using Livak and Schmittgen’s 2 -ΔΔct method[21 ].
The mean Ct values for the gene of interest (CTGF) and the control gene (GAPDH)were estimated. ΔCt was calculated by subtracting the average of triplicate CTGF Ct values from the average of triplicate GAPDH Ct values. The ΔΔCt stood for the difference between the paired tissues samples, which was determined using the formula ΔΔCt=ΔCt of tumor-ΔCt of normal. The fold-change in tumor levels relative to surrounding normals was estimated as 2 -ΔΔCt. Denaturation at 95 ℃ for 7 min, 40 cycles of denaturation; 95 ℃ for 5 min, annealing; 59 ℃ for 50 s and extension; 60 ℃ for 30 s were used in the qRT-PCR reaction. There was no non-specific product formation according to the melt curve review.
Protein extraction and Western blot assay
About 50 -100 mg tissue specimens were washed thrice with icy-cold phosphate-saline buffer in a centrifuge at 3567 g for 5 -min. The Tissue sections were then homogenized in RIPA Lysis buffer (Cat#20 -188 ; Lot#3283787 ), to which 1 mmol/L sodium fluoride,1 mmol/L PMSF and protease inhibitor cocktail 10 μL per 1 mL of lysis buffer were added immediately prior to use. After lysis samples were vortexed for 15 s and then incubated on ice for 40 min. Centrifugation at 73 g for 20 min was done and the supernatant containing extracted protein was collected, the protein concentration was measured spectrophotometrically at 595 nm by using Bradford’s assay. Protein extract was run on a 12 % sodium dodecyl sulphate (SDS) polyacrylamide gel after being preheated at 95 oC for 5 min in reducing SDS sample buffer containing 50 mmol/L TrisHCl (pH6 .8 ), 2 % SDS, 10 % glycerol, 0 .1 % bromophenol blue and 100 mmol/L mercaptoethanol. The proteins isolated were transferred to a polyvinylidene difluoride(PVDF) membrane (Millipore, United States) by semidry transfer method following the manufacturer’s instructions (Hoefer) after gel electrophoresis. The PVDF membrane was processed according to a standardized protocol for immune detection.Rabbit polyclonal antibody anti-CTGF was used at 1 :1000 dilution (ab5097 ; Abcam,Cambridge, United Kingdom). Rabbit monoclonal antibody against beta-actin was employed at 1 :1000 dilution (Cell Signaling Technology; Danvers, MA, United States).The HRP-tagged secondary antibody (#70749 ; Cell Signaling Technology) was used for the detection of protein bands. Beta-actin served as a loading control. The blot was detected by chemiluminescence with Super Signal West Femto Maximum Sensitivity Substrate. (Cat No. 34095 ). Image J software version 15 .3 a was used to assess the densiometry of the blots to measure the quantity of proteins present.
Immunohistochemical analysis
For immunohistochemical analysis of CRC tissues, the formalin-fixed and paraffin embedded representative blocks were used. A manual microtome (Leica Biosystems,Mumbai, Maharashtra, India) was used to slice 5 -μm thick tissue sections from paraffin blocks and mount on charged poly-L-lysin coated glass slides (LOT #180310 Bio-Optica Milano S.p.aviaSan Faustino, 5820134 Milan-Italy). The sections were deparaffinized using xylene and ethanol, and then they were rehydrated in a graded series of ethanol (100 %, 95 %, 90 %, 80 % and 70 %), followed by microwave/pressure cooker antigen retrieval. Rehydration of sections was done using distilled water.Hydrogen peroxide blocking solution (Biocare Medical, Condord, CA, United States)was added after rehydration to cover the whole section which acts as an inhibitor of endogenous peroxidase activity. After that was done the slides were incubated for 15 min while keeping the slides hydrated and letting them dry. Slides were washed two to three times with a phosphate buffer saline (PBS) (pH = 7 .4 ). Tumor sections were then treated with 10 mmol/L citrate buffer (pH 6 .0 ) at 95oC to retrieve antigens. After which the slides were washed three times with PBS. To block non-specific background staining, the sections were covered with protein blocking solution (#BS966 G Biocare Medical) which was followed by a 15 minute incubation. Washings were done with PBST (1 × PBS with Tween-20 ). Slide edges were dried and sections were outlined with boundary by PAP pen (Abcam). Primary antibody anti-CTGF (1 :200 ; Abcam) was put on the whole sections and kept in overnight incubation. Next day the slides were washed thrice using PBS. Secondary antibody coated to goat anti-rabbit HRPconjugated secondary antibody (#M2 U522 G; MACH 2 Universal HRP-Polymer Detection Kit) was put on the sections which were then kept in incubation for 15 min.PBST washings were done four times and later stained with HRP/DAB detection IHC kit (#BDB2004 H; Biocare Medical). To prepare DAB solution, 30 μL of DAB chromogen (#BDB900 C; Biocare Medical) was mixed with 1 .5 mL of DAB substrate(#DS900 H; Biocare Medical), which was then applied to the sections. The slides were again washed four times with PBST. The slides were immersed in distilled water,counterstained with hematoxylin and thereafter, dehydrated in xylene, mounted with DPX and covered by cover slips. Visualization was done by a light microscope (1 × 81 ;Olympus, 1 × 81 ; Tokyo, Japan). Sections from liver carcinoma were used as positive controls. For negative controls, PBS was used instead of primary antibody to tissue sections.
Statistical analysis
For statistical analysis, independent t test and logistic regression was used to calculate the odds ratio (OR) and 95 % confidence interval (95 %CI). P value < 0 .05 was considered as statistically significant. Analysis of the survival data was done by the Kaplan-Meier method. Kaplan-Meier curves were compared by a log-rank test.Regression analysis was utilized using an extended Cox regression model. All the statistical analysis was done using STATA software, version 16 (STATA 16 Corp.,College Station, TX, United States).
Ethical clearance
A written consent was taken from all the patients prior to surgery and they were also apprised about the ongoing study which was approved by Ethical Clearance Committee of SKIMS (SIMS 1131 /IEC-SKIMS/2018 -330 ).
Follow-up
Patients were contacted by phone for follow-up. The deadline for contacting the patients was May 2021 . The survival intervals were calculated from both the date of diagnosis as well as from the date of surgery to the last follow-up.
RESULTS
Patient characteristics
Seventy-one human histopathological confirmed CRC tissues and paired normal adjacent tissue specimens from patients who went through primary surgical resection for CRC with no chemo/radiotherapy received were used to assess the CTGF expression. Demographic and clinicopathological variables for this study are outlined in Table 1 . The cases included 38 (53 .52 %) males and 33 (46 .47 %) females. In all, 50 of 71 (70 .42 %) subjects were greater or equal to 50 years and 21 of 71 (29 .71 %) were less than 50 years having a mean age of 56 .04 ± 13 .48 .
CTGF mRNA expression in CRC
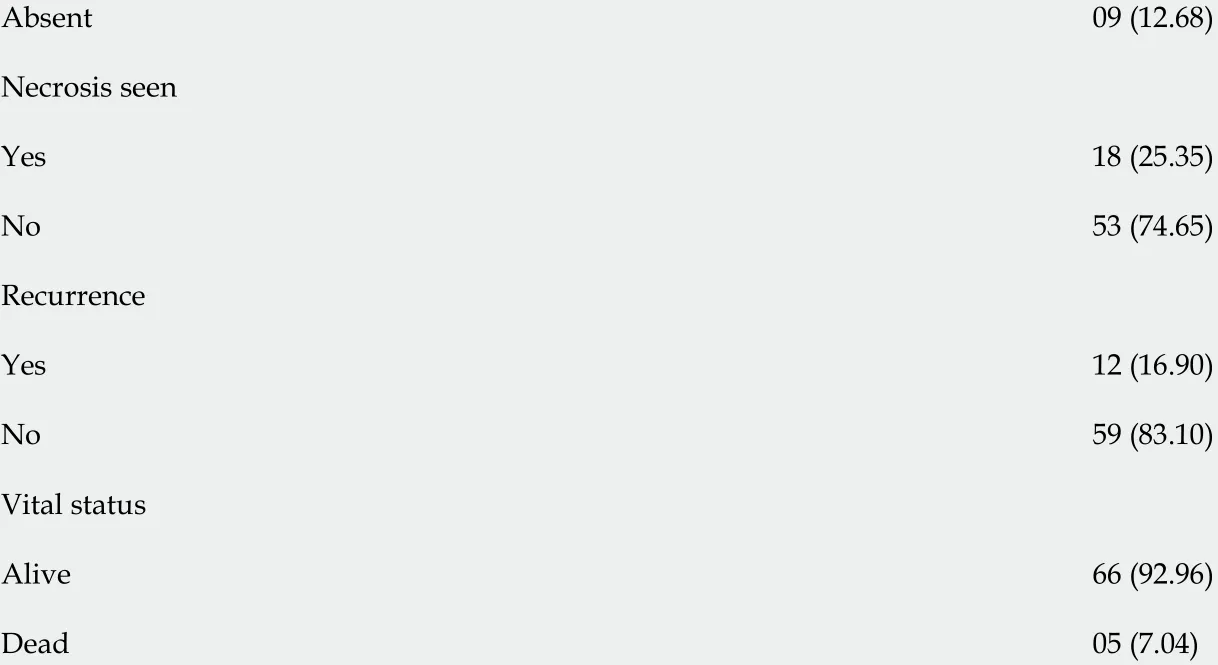
We used qRT-PCR to analyze the expression of CTGF at mRNA level in CRC tissues and the adjacent normal tissues (n= 71 ). Overexpression of CTGF was detected in 80 .28 % (57 /71 ) tumor tissues as compared to adjacent normal tissues. The average fold change of CTGF expression in CRC tissues in comparison to normal adjacent tissues was 2 .49 ± 1 .59 . Figure 1 depicts the dot blots of CTGF mRNA indicating ΔCt values.To ensure accuracy, melt curve analysis was performed on every experiment that yielded zero nonspecific results.
CTGF protein expression and localization in CRC
CTGF protein localization and expression pattern was analyzed by IHC in 71 histopathological confirmed CRC specimens and their adjacent normal tissues. In CRC tissues, CTGF immunoreactivity showed a varying intensity of staining with most remarkable staining in cytoplasm of the tumor cells (Figure 2 ). A scoring system was set for evaluation of CTGF immunoreactivity as 0 (negative staining); +1 (less than 5 %of the tumor cells stained/Weak staining); +2 (less than 50 % tumor cells stained/Moderate staining); and +3 (more than 50 % tumor cells stained/Strong staining).Overexpression was said to be intense when cytoplasm stained more than three times in tumor compared to normal adjacent tissues. IHC Profiler plugin ImageJ software(ImageJ version 15 .3 a) was used for quantification of staining intensity. Out of 71 CRC cases, a total of 44 /71 (61 .97 %) cases showed high expression compared to their normal adjacent tissues. Among all, 26 of 71 (36 .61 %) displayed a strong (+3 )cytoplasmic staining intensity, 18 of 71 (25 .35 %) showed moderate (+2 ), 25 of 71 (35 .21 %) showed weak (+1 ) intensity and 2 of 71 (2 .82 %) CRC cases showed negative scoring intensity. The prevalence of high CTGF expression among the 4 TNM stages was 28 %, 72 %, 88 .89 % and 100 % for Stage I, II, III, and IV respectively among all 71 CRC cases. Among the 44 cases which showed overexpression of CTGF, the stage wise contribution was 15 .91 % (7 /44 ) in stage I, 40 .91 % (18 /44 ) in stage II, 36 .36 % (16 ) in stage III and 6 .82 % (3 /44 ) in stage IV disease (P < 0 .001 ; Chi2 = 20 .7 ).
In order to confirm the results of immunohistochemical staining, western blot analysis was performed to evaluate the CTGF protein levels in the same patient specimens and their adjacent normal tissues. Densitometric image analysis was done by ImageJ version 1 .53 a software to assess the amount of protein present in the sample. CTGF protein expression was considered high in CRC tumor samples when the level was more than one-fold than that in adjacent normal tissues. Among the 71CRC cases, 60 .56 % (43 /71 ) exhibited increased CTGF protein expression in tumor tissues as compared to adjacent normals. Figure 3 A shows the representative blot of CTGF protein expression upregulated in CRC tumor tissues and Figure 3 B depicts the corresponding bar chart of densiometric values of CTGF protein expression. The CRC samples which showed protein overexpression had also increased mRNA expression.Figure 4 depicts the average fold change in CTGF overexpression in all 71 CRC tumors relative to adjacent normal.
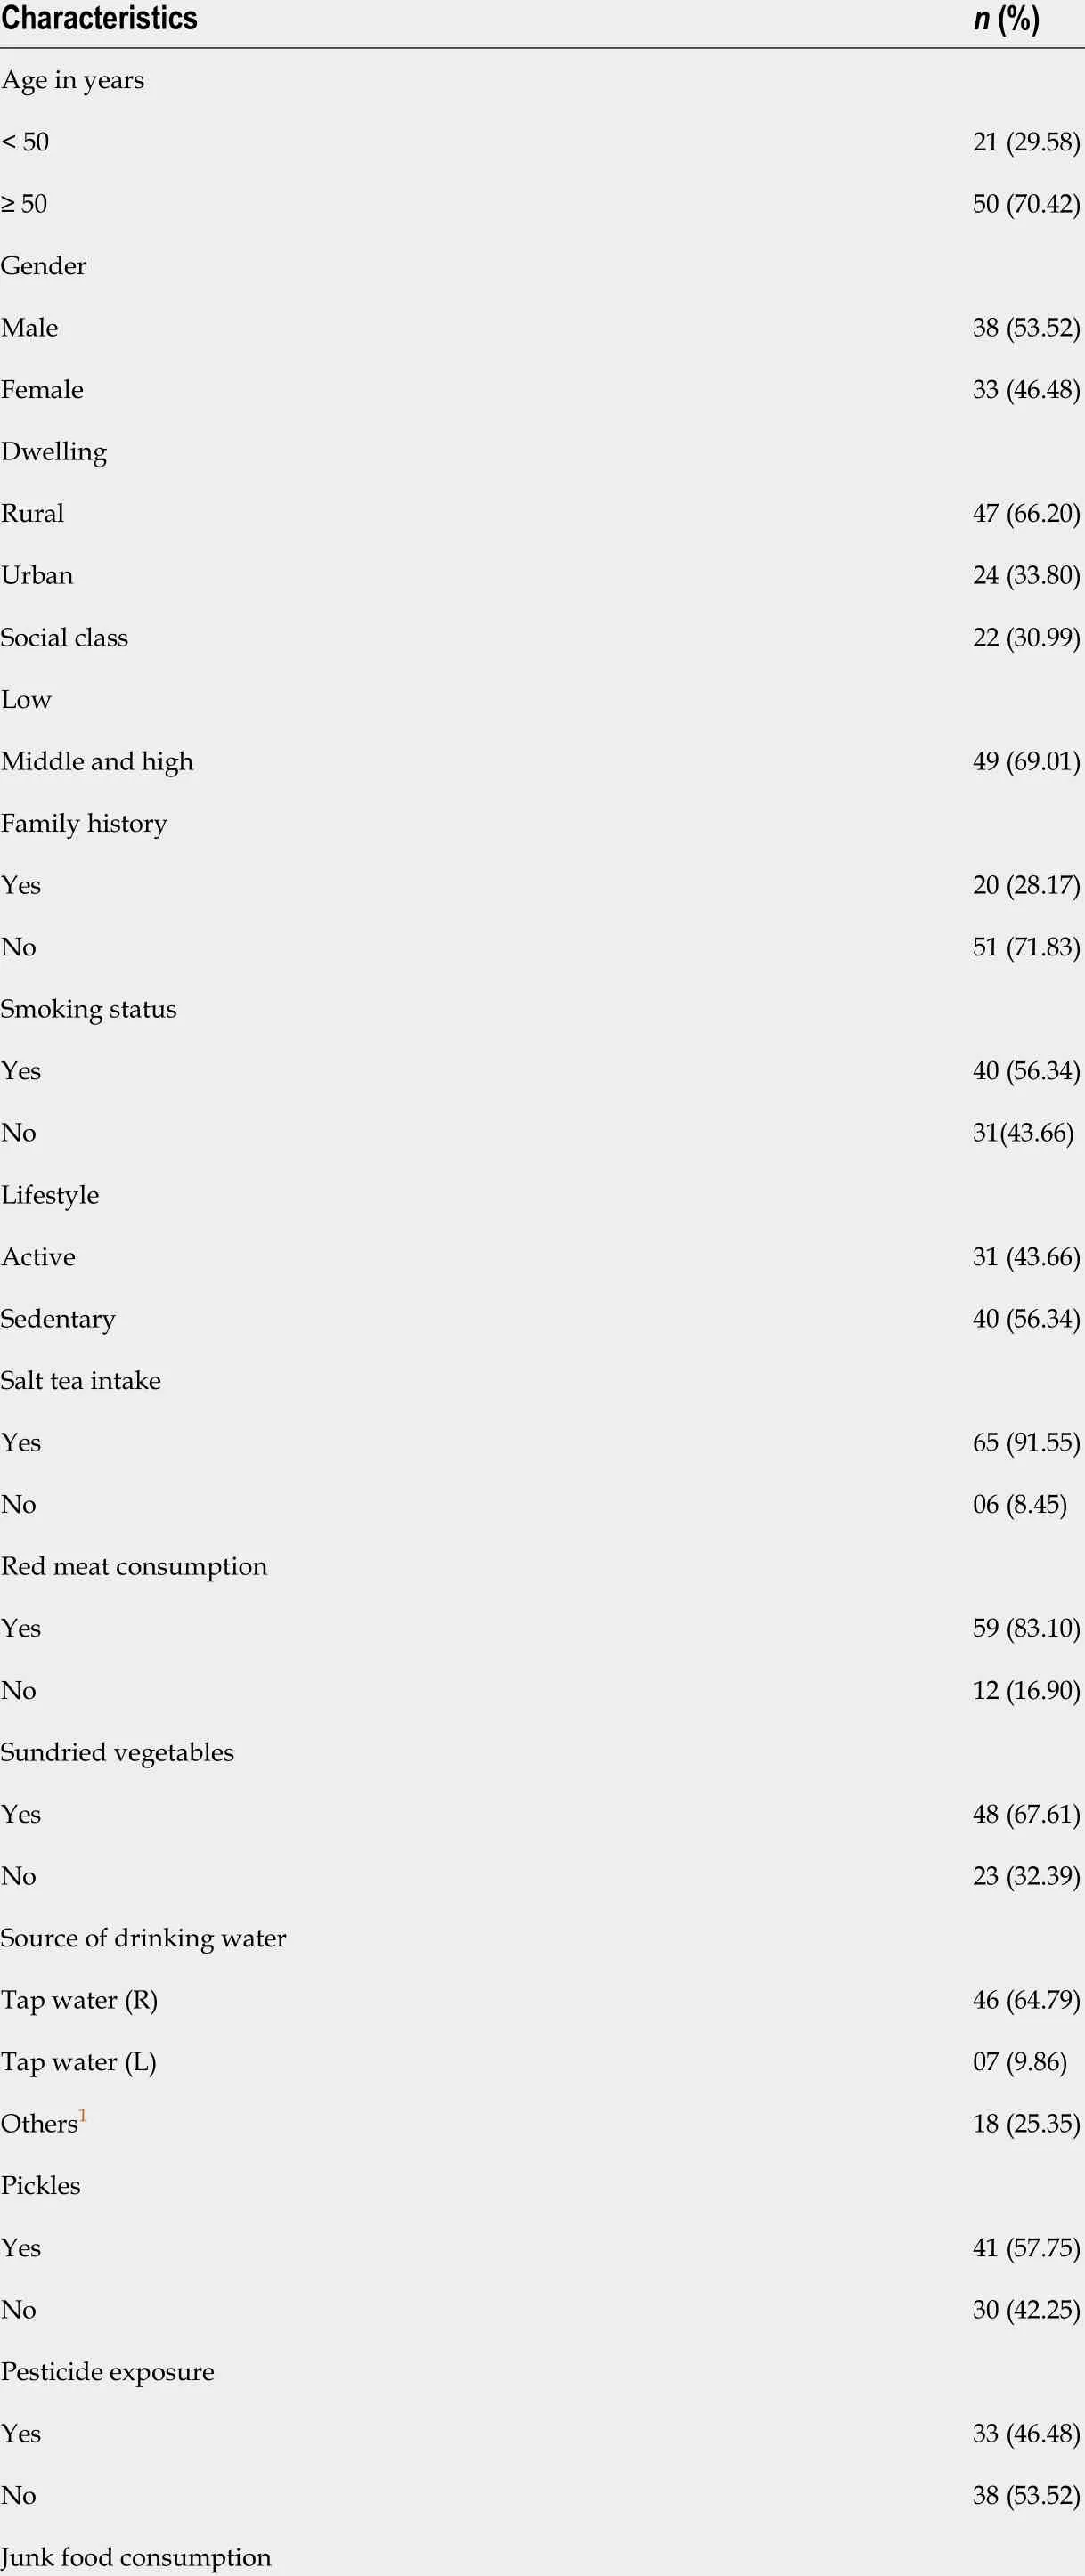
Table 1 Clinicoepidemological and clinicopathological parameters of study population (n = 71 )

Yes 05 (7 .04 )No 66 (92 .96 )Site of tumor Colon 36 (50 .70 )Rectum 20 (28 .17 )Rectosigmoid 15 (21 .13 )Tumor differentiation Well 18 (25 .35 )Moderate 46 (64 .79 )Poor 07 (9 .86 )Invasion depth T108 (11 .27 )T222 (30 .99 )T331 (43 .66 )T410 (14 .08 )T1 + T230 (42 .25 )T3 + T441 (57 .75 )TNM staging I 25 (35 .21 )II 25 (35 .21 )III 18 (25 .35 )IV 03 (4 .22 )I + II 50 (70 .42 )III + IV 21 (29 .58 )Tumor grade 118 (25 .35 )246 (64 .79 )307 (9 .86 )DUKE stage A 05 (7 .04 )B 44 (61 .97 )C 22 (30 .99 )Node status 051 (71 .83 )1 and 220 (28 .17 )LVI Present 54 (76 .06 )Absent 17 (23 .94 )PNI Present 15 (21 .12 )Absent 56 (78 .87 )TALNR Present 62 (87 .32 )
1 Others: Spring, Well, Pond.N: Total Number of samples; R: River water through Tap; L: Lake water through Tap; TNM: Tumor-node-metastasis; TALNR: Tumor associated lymphnode response; LVI: Lymphovascular invasion; PNI: Perineural invasion.
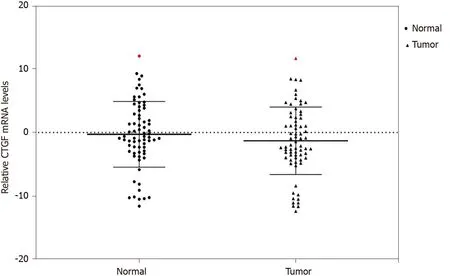
Figure 1 Quantitative real-time polymerase chain reaction analysis of connective tissue growth factor mRNA across the colorectal cancer tissues and their adjacent normals (n = 71 ). mRNA: Messenger RNA; CTGF: Connective tissue growth factor.
The correlation between real time PCR, western blotting and immunohistochemical analysis was high and significant (P= 0 .0001 ).
Correlation of CTGF with various clinicopathological factors
To better understand the clinical significance of CTGF expression in CRC, expression of CTGF was correlated with a series of clinicopathological parameters. The overexpression of CTGF was associated with smoking, tumor differentiation, invasion depth,TNM stage, tumor grade, Duke staging both at mRNA level as well as at protein level.Node status, lymphovascular, PNI and necrosis of tumor tissues was also significantly associated with the overexpression of CTGF (P< 0 .001 ). Gender was associated with mRNA expression of CTGF (P= 0 .037 ), but not with its protein expression. No significant association with other parameters such as age, sex, dwelling, social class,family history, lifestyle, salt tea intake, sundried vegetables, junk food consumption,pesticide exposure, use of pickles, source of drinking water and site of tumor was observed at mRNA or protein level. CTGF high expression was also significantly correlated with recurrence of the patients after surgery, but no association was seen with vital status of the CRC patients (Tables 2 -4 ).

Figure 2 Representative images of immunohistochemical expression of the connective tissue growth factor protein in colorectal cancer and adjacent normal (H & E and DAB Chromogen × 100 insect × 400 ). A: Negative control; B: Tumor negative staining; C: Tumor + 1 , weak staining; D:Tumor + 2 , moderate staining; E: Tumor + 3 , strong staining. Scale bars: 100 μM.
Figure 3 Connective tissue growth factor. A: The connective tissue growth factor (CTGF) is upregulated in human colorectal cancer (CRC) samples.Representative Immunoblot showing expression of tumors and their adjacent normals in CRC. Lane N: Normal; Lane T: Tumor. β-actin is used as a loading control.About 40 μg protein loaded on 12 % sodium dodecyl sulphate-Gel transferred to polyvinylidene difluoride membrane, anti-β actin primary Ab (1 :1000 ), anti-CTGF primary Ab (1 :500 ); B: Normalized densitometric values. The experiments were performed in triplicates; mean and standard error was calculated. CTGF: Connective tissue growth factor.

Table 2 Clinicopathological relevance of connective tissue growth factor mRNA expression in colorectal cancer patients as determined by quantitative real-time polymerase chain reaction

Junk food consumption Yes 0 (0 )5 (100 )Referent No 14 (21 .21 )52 (91 .23 )0 (0 -3 .08 )0 .251 .32 Site of tumor Colon 7 (19 .44 )29 (80 .56 )Referent Rectum 6 (30 .00 )14 (70 .00 )1 .8 (0 .4 -7 .45 )Rectosigmoid 1 (6 .67 )14 (93 .33 )0 .3 (0 .01 -2 .7 )0 .232 .91 Tumor differentiation Well 8 (44 .44 )10 (55 .56 )Moderate 5 (10 .87 )41 (89 .13 )Referent Poor 1 (14 .29 )6 (85 .71 )0 .15 (0 .03 -0 .7 )0 .009 a 9 .35 Invasion depth T15 (62 .50 )3 (37 .50 )T27 (31 .82 )15 (68 .18 )Referent T32 (6 .45 )29 (93 .55 )0 .3 (0 .03 -2 .0 )0 .001 a 17 .21 T40 (0 )10 (100 )T1 + T212 (40 .00 )18 (60 .00 )T3 + T42 (4 .88 )39 (95 .12 )0 .08 (0 .008 -0 .4 )0 .000 a 13 .5 TNM staging I 11 (44 .00 )14 (56 .00 )Referent II 2 (8 .00 )23 (92 .00 )0 .1 (0 .01 -0 .6 )0 .002 a 14 .5 III 1 (5 .56 )17 (94 .44 )0 .07 (0 .01 -0 .7 )IV 0 (0 )3 (100 .00 )0 .040 a 4 .21 I + II 13 (26 .00 )37 (74 .00 )III + IV 1 (4 .76 )20 (95 .24 )0 .1 (0 .01 -1 .1 )Tumor grade 18 (44 .44 )10 (55 .56 )25 (10 .87 )41 (89 .13 )Referent 31 (14 .29 )6 (85 .71 )0 .1 (0 .03 -0 .7 )0 .009 a 9 .35 DUKE stage A 2 (2 .82 )3 (4 .23 )B 11 (15 .49 )33 (46 .48 )Referent C 1 (1 .41 )21 (29 .58 )0 .5 (0 .05 -6 .8 )0 .042 a 5 .20 Node status 013 (25 .49 )38 (74 .51 )Referent 1 and 21 (5 .00 )19 (95 .00 )0 .1 (0 .003 -1 .2 )0 .041 a 3 .81 LVI Present 8 (14 .81 )46 (85 .19 )Referent Absent 6 (35 .29 )11 (64 .71 )3 .1 (0 .7 -12 .7 )0 .0643 .42 PNI Present 0 (0 .00 )15 (100 )Referent Absent 14 (25 .00 )42 (75 .00 )0 (0 -1 .08 )0 .031 a 4 .67 TALNR

1 Others: Spring, Well, Pond.aP < 0 .05 : Statistical significance.R: River water through tap; L: Lake water through tap; TALNR: Tumor associated lymph-node response; LVI: Lymphovascular invasion; PNI: Perineural invasion; CI: Confidence interval.
CTGF and CRC prognosis
Kaplan-Meier survival curves from date of diagnosis of the disease and from date of surgery as shown in Figures 5 and 6 revealed that CRC patients with low CTGF protein expression had good overall survival (OS) and disease-free survival (DFS) than those with higher levels of CTGF. The patients had a median survival time of 37 mo from the time that CRC was diagnosed and 28 mo from when the surgery was done and the higher CTGF protein levels were significantly associated with the recurrence of disease (P=0 .020 ). To determine the independent predictive value of CTGF expression, the influence of each clinicopathological parameter and the expression pattern of CTGF on patient OS and DFS was determined using extended Coxregression model listed in Table 5 . Although TNM stage, Duke Stage, Node status,Necrosis and CTGF Expression showed an accord with the DFS, but only TNM stage and PNI were significant independent predictors of OS in the multivariate analysis (P< 0 .05 ). A classification tree analysis was also done to explore the relationship of CTGF overexpression with different variables of colorectal tumors (Figure 7 ). TNM Stage,Duke Stage, Node status and necrosis were important factors for recurrence of the disease and TNM stage with PNI positive tumors were important predictors for CTGF expression in CRC.
DISCUSSION
In the present study, the CTGF mRNA and protein expression in CRC tissues was evaluated and their histopathological confirmed adjacent normals using qRT-PCR,western blotting, and IHC. The results show that 80 .28 % of CRC tissues at mRNA level and 60 .56 % of CRC tissues at protein level had overexpression compared to their adjacent normals. CTGF was overexpressed at both the protein and mRNA levels in the majority of samples, showing that CTGF is upregulated at both the transcriptional and translational levels, although some samples showed overexpression at the mRNA level only. CTGF overexpression in CRC has previously been reported in some studies but they did not contain much clinicopathological data of patients. Higher expression levels of CTGF in CRC tissues compared to adjacent normal specimens have been found in cancers of the esophagus, pancreas and gliomas[11 ,22 ,23 ]. In this study, it was observed that CTGF expression was high in 61 .97 % of tumor sections as compared to their adjacent normals and was predominantly present in cytoplasm of CRC tumor cells. This is analogous to a variety of other tumor forms, such as esophageal and pancreatic cancers[11 ,22 ]. Previous CTGF immunohistochemical studies also revealed cytoplasmic or membranous staining[17 ,18 ]. Higher levels of CTGF are linked to more advanced disease in esophageal adenocarcinoma and breast cancer[11 ,24 ]. CTGF, a well-known transcriptional target of transforming growth factor-beta (TGF-β), was found to have higher mRNA and protein levels in more advanced Duke and TNMstages of CRC[18 ,25 ].

Table 3 Clinicopathological relevance of connective tissue growth factor protein expression in colorectal cancer patients as determined by Western blot analysis

Junk food consumption Yes 0 (0 )5 (100 )Referent No 28 (42 .42 )38 (57 .58 )0 (0 -1 .1 )0 .063 .5 Site of tumor Colon 12 (33 .33 )24 (66 .67 )Referent Rectum 12 (60 )8 (40 )3 (0 .84 -10 .89 )Rectosigmoid 4 (26 .67 )11 (73 .33 )0 .7 (0 .13 -3 .1 )0 .0775 .12 Tumor differentiation Well 14 (77 .78 )4 (22 .22 )Referent Moderate 13 (28 .26 )33 (71 .74 )0 .1 (0 .02 -0 .5 )Poor 1 (14 .29 )6 (85 .71 )0 .04 (0 .01 -0 .64 )0 .000 a 15 .33 Invasion depth T17 (87 .50 )1 (12 .50 )T213 (59 .09 )9 (40 .91 )Referent 0 .000 a 18 .61 T37 (22 .58 )24 (77 .42 )0 .04 (0 .01 -0 .44 )T41 (10 )9 (90 )T1 + T220 (66 .67 )10 (33 .33 )T3 + T48 (19 .51 )33 (80 .49 )0 .12 (0 .03 -0 .4 )0 .000 a 16 .12 TNM staging I 19 (76 .00 )6 (24 .00 )Referent II 7 (28 .00 )18 (72 .00 )0 .12 (0 .02 -0 .5 )0 .000 a 23 .3 III 2 (11 .11 )16 (88 .89 )0 .04 (0 .003 -0 .3 )IV 0 (0 .00 )3 (100 )0 (0 -0 .5 )I + II 26 (52 .00 )24 (48 .00 )III + IV 2 (9 .52 )19 (90 .48 )0 .1 (0 .01 -0 .5 )0 .001 a 11 .2 Tumor grade 114 (77 .78 )4 (22 .22 )Referent 213 (28 .26 )33 (71 .74 )0 .1 (0 .02 -0 .5 )31 (14 .29 )6 (85 .71 )0 .05 (0 .01 -0 .6 )0 .000 a 15 .33 DUKE stage A 4 (80 .00 )1 (20 .00 )Referent B 22 (50 .00 )22 (50 .00 )4 (0 .3 -205 )C 2 (9 .09 )20 (90 .91 )0 .02 (0 .01 -0 .5 )0 .001 a 13 .9 Node status 026 (50 .98 )25 (49 .02 )Referent 1 and 22 (7 .14 )18 (41 .86 )0 .10 (0 .01 -0 .53 )0 .001 a 10 .10 LVI Present 17 (31 .48 )37 (68 .52 )Referent Absent 11 (64 .71 )6 (35 .29 )0 .2 (0 .06 -0 .90 )0 .015 a 5 .97 PNI Present 1 (6 .67 )14 (93 .33 )Referent Absent 27 (48 .21 )29 (51 .79 )0 .1 (0 .01 -0 .58 )0 .003 a 8 .55 TALNR
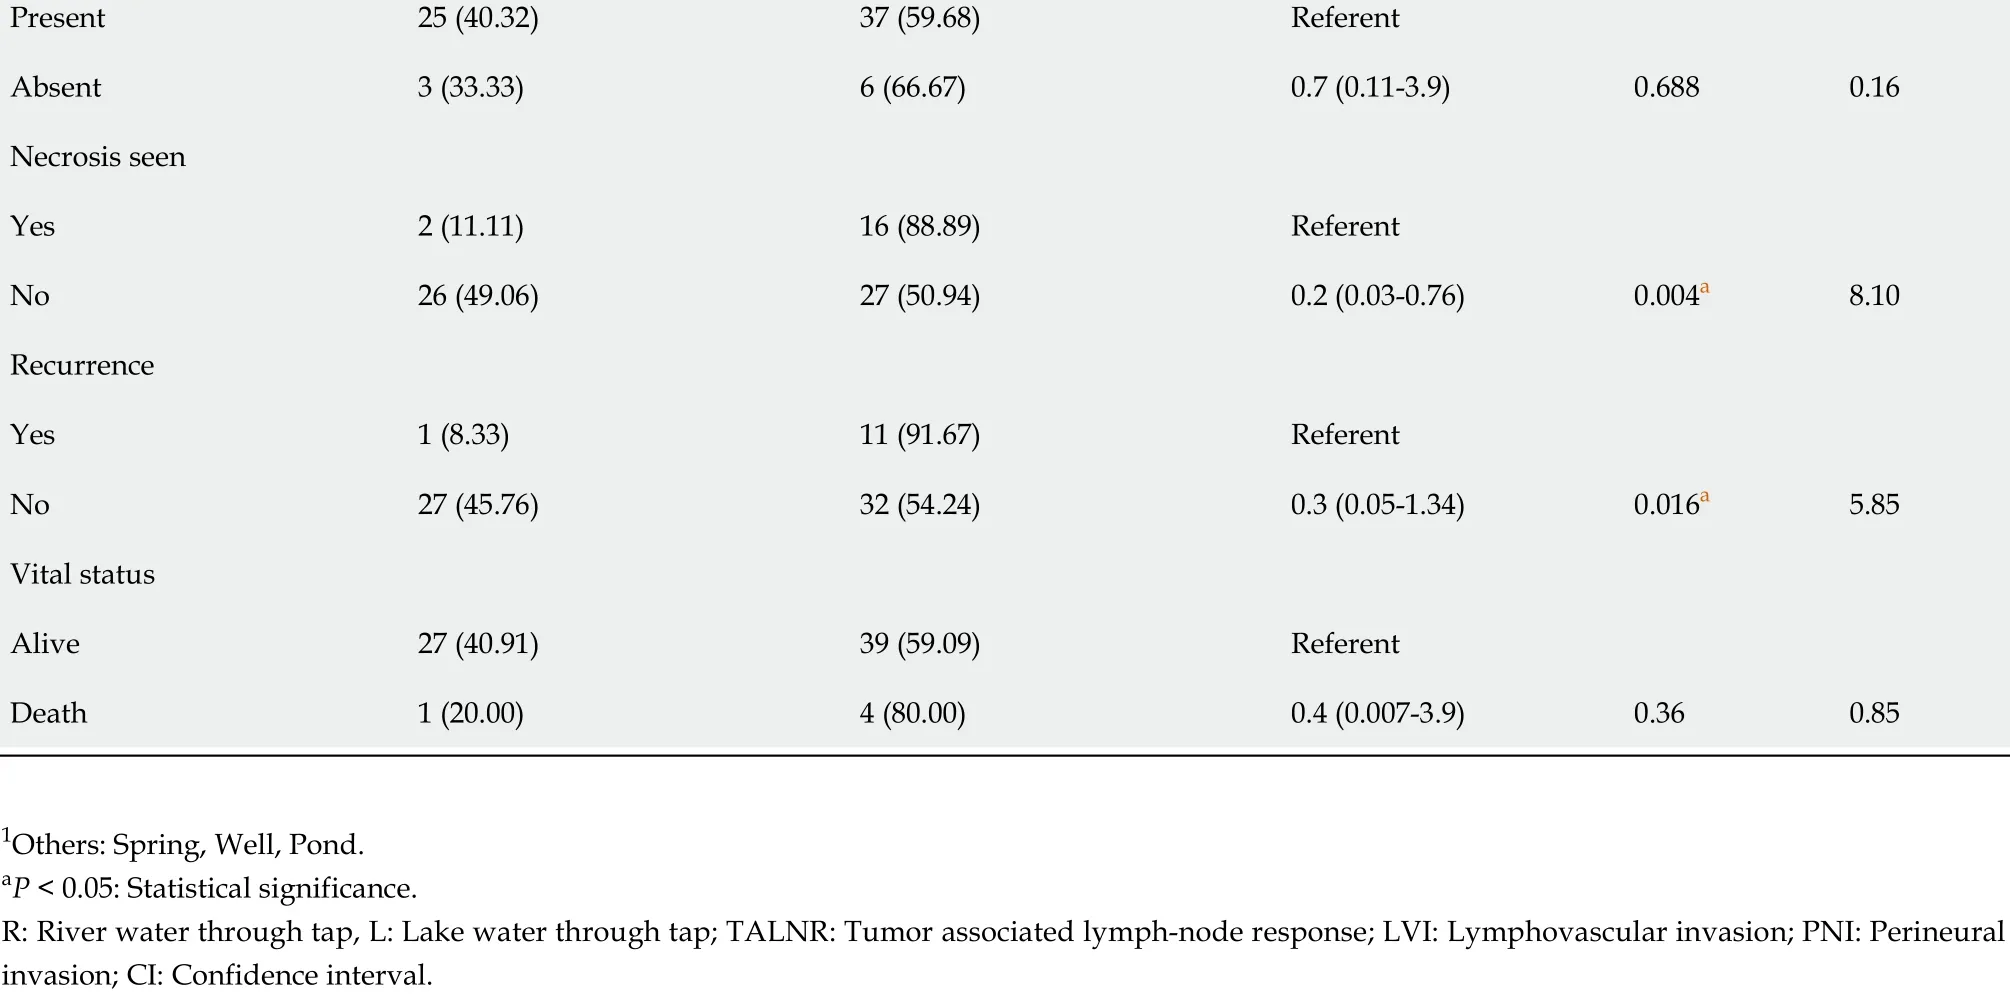
Present 25 (40 .32 )37 (59 .68 )Referent Absent 3 (33 .33 )6 (66 .67 )0 .7 (0 .11 -3 .9 )0 .6880 .16 Necrosis seen Yes 2 (11 .11 )16 (88 .89 )Referent No 26 (49 .06 )27 (50 .94 )0 .2 (0 .03 -0 .76 )0 .004 a 8 .10 Recurrence Yes 1 (8 .33 )11 (91 .67 )Referent No 27 (45 .76 )32 (54 .24 )0 .3 (0 .05 -1 .34 )0 .016 a 5 .85 Vital status Alive 27 (40 .91 )39 (59 .09 )Referent Death 1 (20 .00 )4 (80 .00 )0 .4 (0 .007 -3 .9 )0 .360 .85 1 Others: Spring, Well, Pond.aP < 0 .05 : Statistical significance.R: River water through tap, L: Lake water through tap; TALNR: Tumor associated lymph-node response; LVI: Lymphovascular invasion; PNI: Perineural invasion; CI: Confidence interval.
In our study, we correlated the CTGF expression with a number of clinicopathological parameters of patients and we found that CTGF protein overexpression was significantly associated with smoking, tumor differentiation, invasion depth, TNM staging, Duke Staging, Tumor grade and lymph node metastasis (P< 0 .001 ). This was also the first study which revealed that the presence of LVI (P= 0 .015 ), PNI (P = 0 .016 )and necrosis (P= 0 .008 ) in the tumor was significantly associated with the overexpression of CTGF. In consideration with a previous study, smoking is an important factor which might oxidatively activate the latent TGF-β members like CTGF[26 ]. In another study, rat models were exposed to cigarette smoke, and it was found that CTGF shRNA effectively suppressed the upregulation of CTGF and cyclin D1 expression in narrow, intrapulmonary arteries which indicated that CTGF plays a crucial role in smoke-induced pulmonary vascular remodeling while regulating cyclin D1 expression[27 ]. In a study, it was found that CTGF mRNA overexpression was significantly associated with Duke Stage which was particularly noticeable in Duke’s A and B stage tumors, while as they found noticeable proportions of CTGF protein overexpression in Duke’s stage C[18 ]. In addition to this, CTGF protein expression was higher in more advanced T-stage and lymph node positive CRC samples asperthe previous studies[25 ]. The recurrent cases of colon cancer have been recorded in cases where the lesion was initially diagnosed as LVI negative but later revealed to be positive after re-evaluation with additional more deeply cut specimens when the recurrence was discovered. In the current study, LVI was observed in 54 /71 (76 .00 %)CRCs, in which 86 .09 % had high expression of CTGF and was significantly associated with CTGF overexpression (P= 0 .043 ), and the presence increased with tumor stage from 56 % in stage I, 80 % in stage II, 94 .44 % in stage III and in all the three cases of stage IV involved in this study. Since our study included only three cases of Stage IV CRC tumors as the samples taken are mostly from the early-stage primary CRC patients, so most of the samples were skipped due to exclusion criteria of chemo/radio therapy which included mostly the late stage or recurrent patients. Most of the CRC patients with stage I or II are treated with surgery, though some stage II patients can be benefited by adjuvant therapy. The preferable method to treat stage III CRC patients is surgery coupled with adjuvant chemotherapy[28 ,29 ]. Comparable to other investigations, our findings indicated that LVI was associated with aggressive tumor characteristics such as higher tumor grade and advanced tumor stage (P= 0 .05 ).Presence of LVI was a significant prognostic indicator in patients with stage III CRC[30 ]. PNI was present in 15 /71 (21 .12 %) and the presence increased with the tumor stage from 4 % in Stage I, 20 % in stage II and 33 .33 % in Stage III CRC patients and in all 14 /15 (93 .33 %) PNI positive cases showed significant association with CTGF overexpression (P= 0 .020 ). The connection of PNI with histological markers associated with tumor growth (lymphatic invasion and venous invasion) suggests that these components may all be involved in the metastatic processes that include vascular emboli, lymphatic invasion, and PNI. It has been shown that PNI status can be used toaid in identifying the stage II CRC patients for adjuvant treatment chemotherapy[31 ].According to certain studies, PNI evaluation utilizing a grading system based on PNI location inside the gut could improve the value of cancer staging[32 ].

Table 4 Clinicopathological relevance of connective tissue growth factor high and low expression status determined by immunohistochemistry in colorectal cancer patients

Junk food consumption Yes 0 (0 )5 (100 )Referent No 27 (40 .91 )39 (59 .09 )0 (0 -1 .1 )0 .073 .30 Site of tumor Colon 11 (30 .56 )25 (69 .44 )Referent Rectum 12 (60 .00 )8 (40 .00 )3 .4 (0 .9 -12 .5 )Rectosigmoid 4 (26 .67 )11 (73 .33 )0 .8 (0 .1 -3 .7 )0 .065 .81 Tumor differentiation Well 14 (77 .78 )4 (22 .22 )Referent Moderate 12 (26 .09 )34 (73 .91 )0 .1 (0 .02 -0 .4 )Poor 1 (14 .29 )6 (85 .71 )0 .05 (0 .01 -0 .6 )0 .000 a 16 .52 Invasion depth T17 (25 .93 )1 (2 .27 )Referent T212 (44 .44 )10 (22 .73 )0 .2 (0 .003 -1 .8 )0 .001 a 17 .30 T37 (25 .93 )24 (54 .550 )0 .04 (0 .01 -0 .4 )T41 (3 .70 )9 (20 .45 )0 .01 (0 .01 -0 .40 )T1 + T219 (70 .37 )11 (25 .00 )T3 + T48 (29 .63 )33 (75 .00 )0 .14 (0 .04 -0 .4 )0 .000 a 14 .11 TNM staging I 18 (66 .67 )7 (15 .91 )Referent II 7 (25 .93 )18 (40 .91 )0 .1 (0 .03 -0 .6 )0 .000 a 20 .7 III 2 (7 .41 )16 (36 .36 )0 .05 (0 .01 -0 .3 )IV 0 (0 )3 (6 .820 )0 (0 -0 .6 )I + II 25 (92 .59 )25 (56 .82 )III + IV 2 (7 .41 )19 (43 .18 )0 .12 (0 .01 -0 .5 )0 .001 a 10 .31 Tumor grade 114 (77 .78 )4 (22 .22 )Referent 212 (26 .09 )34 (73 .91 )0 .1 (0 .02 -0 .4 )31 (14 .29 )6 (85 .71 )0 .05 (0 .01 -0 .6 )0 .000 a 16 .52 DUKE stage A 4 (80 .00 )1 (20 .00 )Referent B 21 (47 .73 )23 (52 .27 )0 .2 (0 .004 -2 .6 )C 2 (9 .09 )20 (90 .91 )0 .02 (0 .014 -0 .5 )0 .001 a 13 .3 Node status 025 (49 .02 )26 (50 .98 )Referent 1 and 22 (10 .00 )18 (90 .00 )0 .1 (0 .01 -0 .6 )0 .002 a 9 .30 LVI Present 17 (31 .48 )37 (68 .52 )Referent Absent 10 (58 .82 )7 (41 .18 )0 .3 (0 .1 -1 .13 )0 .043 a 4 .11 PNI Present 1 (6 .67 )14 (93 .33 )Referent Absent 26 (46 .43 )30 (53 .57 )0 .1 (0 .002 -0 .6 )0 .020 a 5 .42 TALNR
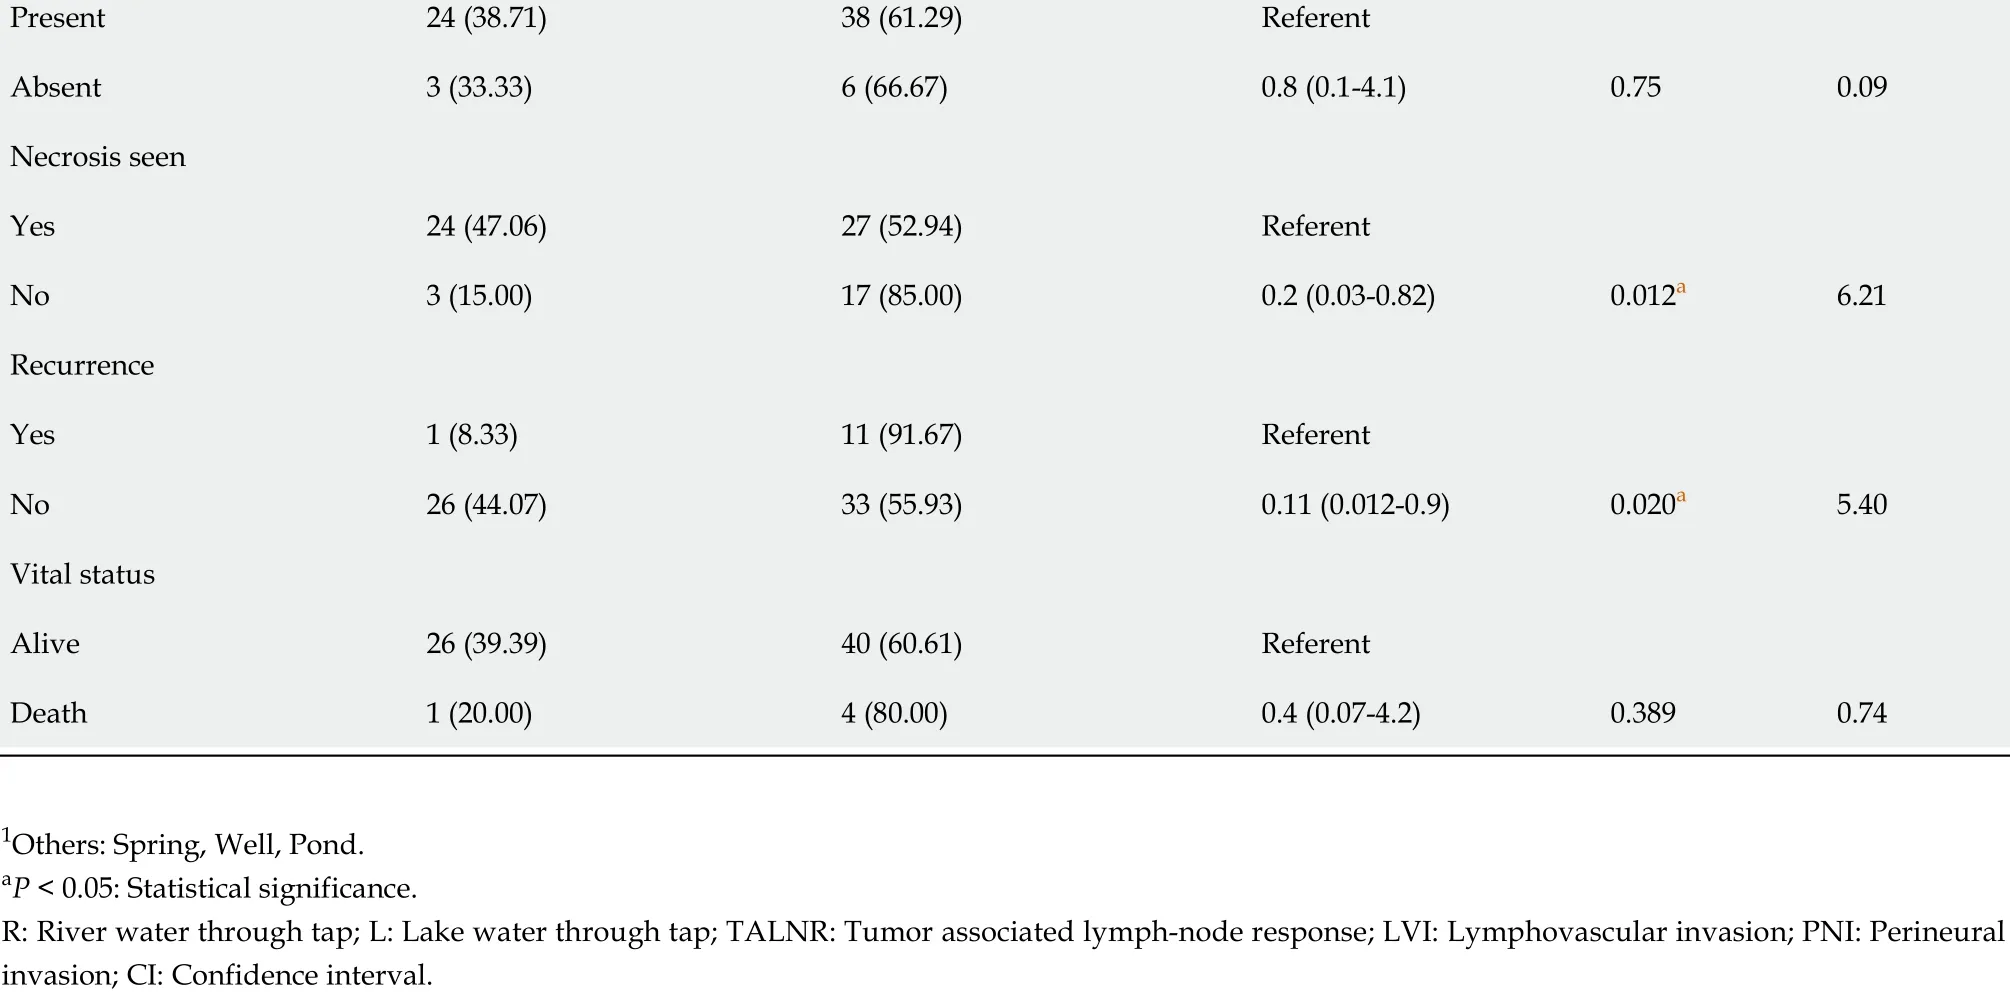
Present 24 (38 .71 )38 (61 .29 )Referent Absent 3 (33 .33 )6 (66 .67 )0 .8 (0 .1 -4 .1 )0 .750 .09 Necrosis seen Yes 24 (47 .06 )27 (52 .94 )Referent No 3 (15 .00 )17 (85 .00 )0 .2 (0 .03 -0 .82 )0 .012 a 6 .21 Recurrence Yes 1 (8 .33 )11 (91 .67 )Referent No 26 (44 .07 )33 (55 .93 )0 .11 (0 .012 -0 .9 )0 .020 a 5 .40 Vital status Alive 26 (39 .39 )40 (60 .61 )Referent Death 1 (20 .00 )4 (80 .00 )0 .4 (0 .07 -4 .2 )0 .3890 .74 1 Others: Spring, Well, Pond.aP < 0 .05 : Statistical significance.R: River water through tap; L: Lake water through tap; TALNR: Tumor associated lymph-node response; LVI: Lymphovascular invasion; PNI: Perineural invasion; CI: Confidence interval.
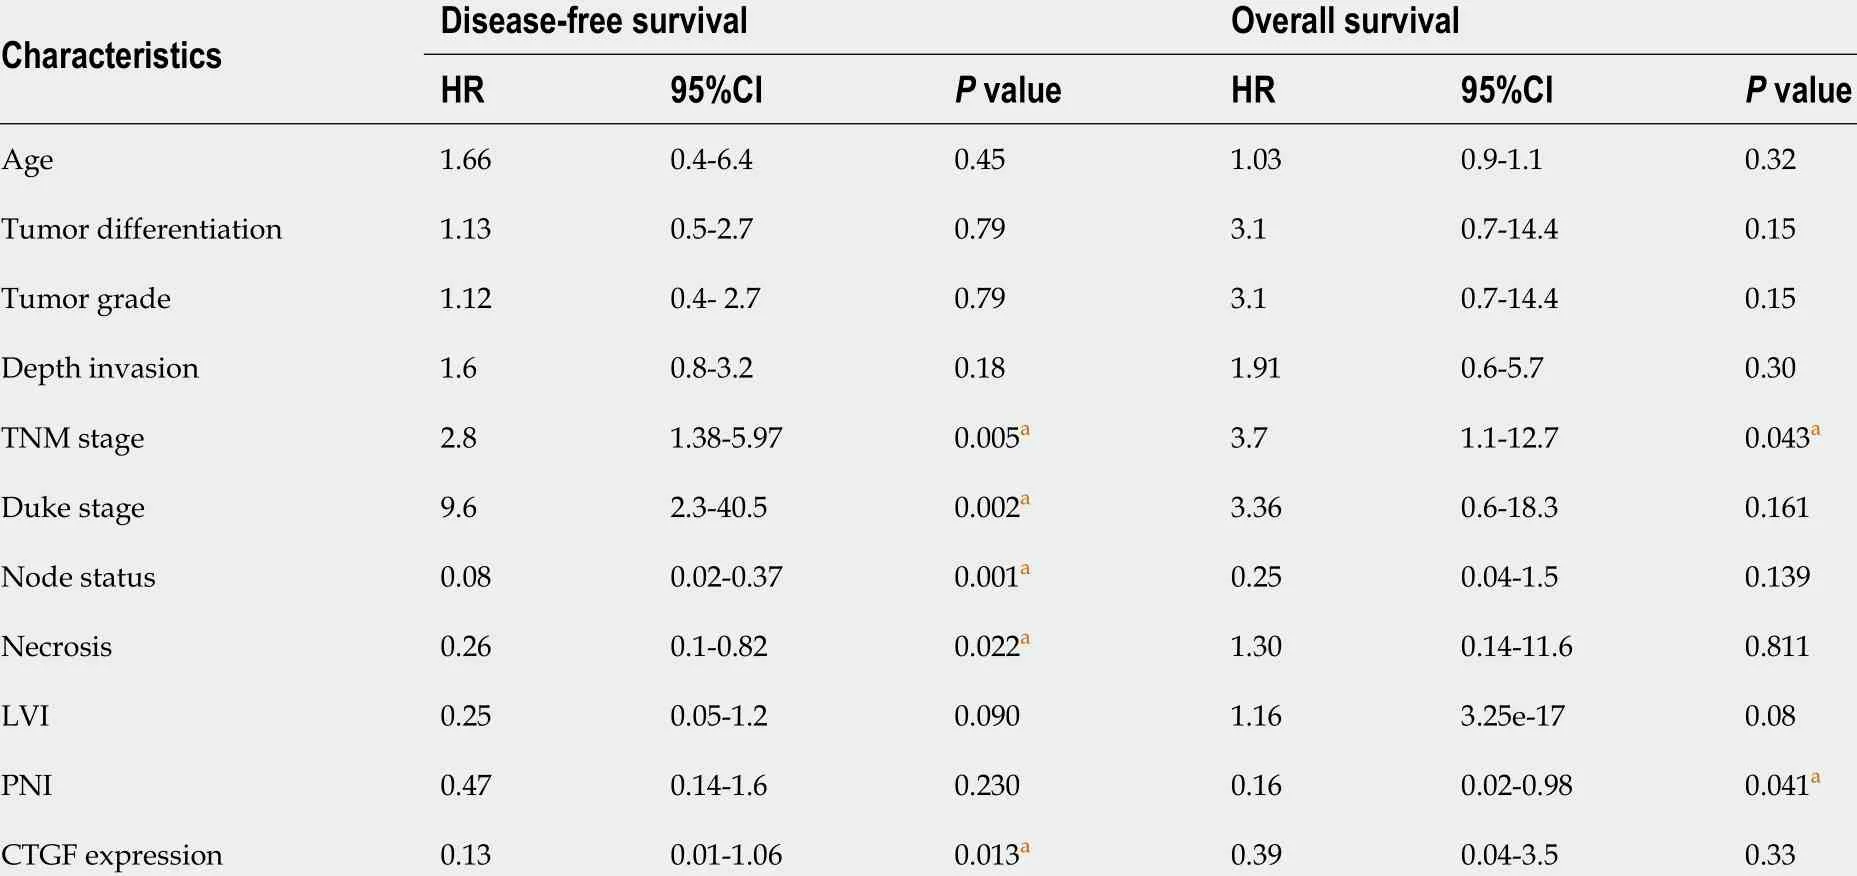
Table 5 Predictors for recurrence or mortality of colorectal cancer using extended cox-regression analysis model
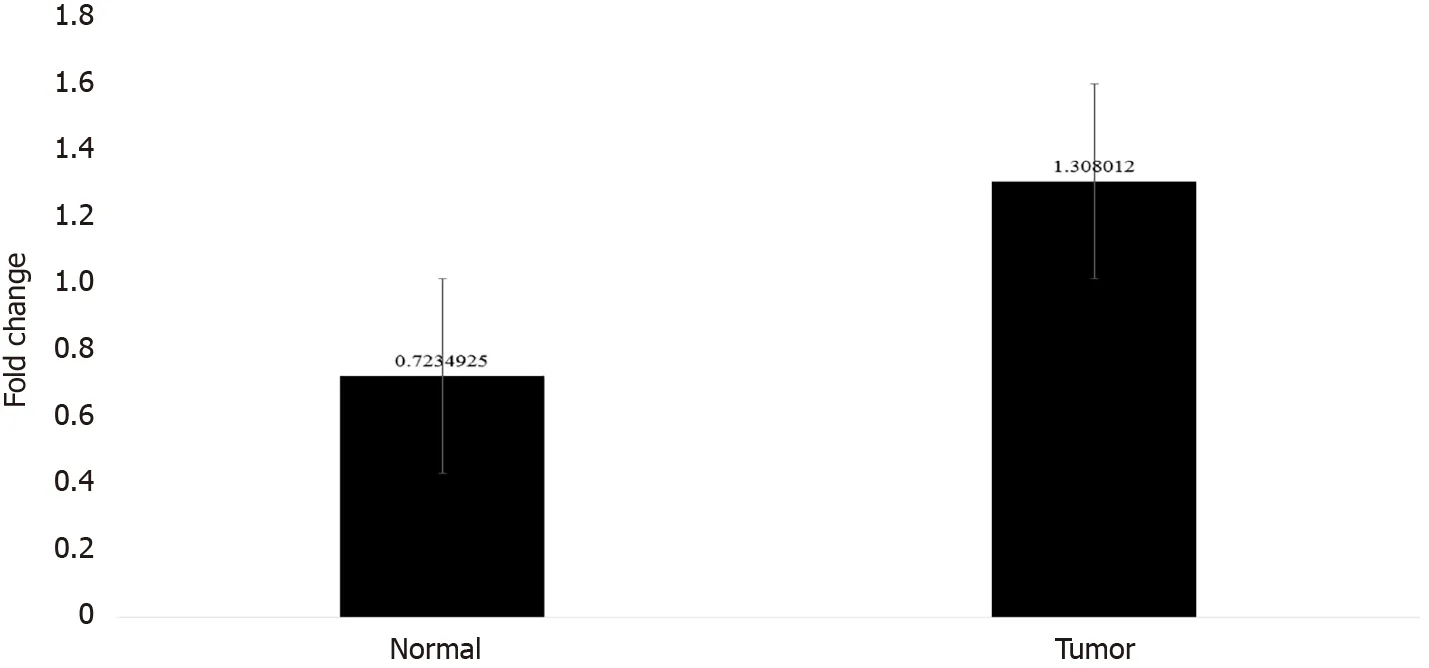
Figure 4 Bar graph showing the average fold change of connective tissue growth factor overexpression in colorectal cancer tumors and their adjacent normal tissue with error bars.

Figure 5 Kaplan-Meier survival analysis of 71 colorectal cancer patients from the time of diagnosis of the disease with connective tissue growth factor protein expression. A: Overall survival (OS) with connective tissue growth factor (CTGF) High and low expression; B: Disease-free survival(DFS) with CTGF High and Low expression; C and D: Depict OS and DFS of colorectal cancer patients respectively stratified as Stage I + II and III + IV.
Furthermore, it was observed that a high CTGF expression was associated with high recurrence of the disease, but no significant association was seen with vital status of the patients. The difference in this study may be due to limited sample size and a shorter time period of 4 -year survival analysis. Some other studies have looked into the connection between CTGF expression and CRC prognosis, with mixed results.Previously, studies were conducted to examine CTGF expression in primary CRC using IHC and it was observed that elevated CTGF protein levels were linked to a lower probability of peritoneal metastasis and a substantially increased OS and DFS[17 ,18 ]. A previous study has shown that CRC patients with low expression levels of CTGF were associated with shorter survival and shorter recurrence time and moreover overexpression of CTGF in human CRC cells showed a decrease in the invasiveness of tumor cells[17 ]. This seems to be at odds with our findings. The following could be a possible explanation for the aforesaid inconsistency: They compared the CTGF expression with only stage II and III CRC disease, but we stratified the patients broadly into two merged categories of Stage I/II and Stage III/IV. The search for a more accurate mechanism is underway. Previous research has found that tumor stage is the biggest indicator of poor prognosis in people with colon cancer[33 ]. The results of the present study indicated that high expression levels of CTGF were associated with the TNM Stage which is the most important prognostic factor in CRC. After stratifying our population of 71 CRC patients asperTNM stage into I/II and III/IV groups, we found a significant correlation of TNM stage with OS of the patient (P=0 .001 ; Chi2 = 17 .05 ) as well as with recurrence of the disease (P = 0 .034 , Chi2 = 8 .64 ).Among all, 41 .67 % of the recurrent cases had Stage I/II CRC disease in which 55 .93 %had high expression of CTGF protein and about 58 .33 % recurrent cases had Stage III/IV CRC disease, in which 91 .67 % of recurrent cases had a high expression of CTGF(P= 0 .017 ). In this study, we found that TNM stage was a significant prognostic factor for both OS and DFS of CRC patients, as the stage progresses and CTGF expression increases, the chances of survival decrease in both pre- and postoperative conditions.Hence, proper staging considering LVI and PNI also is conducive to optimal care and has much to do with prognosis of CRC.

Figure 6 Kaplan-Meier survival analysis of 71 colorectal cancer patients after surgery with connective tissue growth factor protein expression. A and B: Depicts the overall and disease-free survival with connective tissue growth factor High and Low expression respectively; C and D: Shows the overall and disease-free survival of colorectal cancer patients respectively, stratified as Stage I + II and III + IV. CTGF: Connective tissue growth factor; OS: Overall survival; DFS: Disease-free survival.

Figure 7 Connective tissue growth factor classification tree analysis for disease-free and overall survival of colorectal cancer patients;the numbers in the circles and boxes shows connective tissue growth factor high expression and percentage of the positive markers per total number of cases and arrows show the significant P values. A: Tree model of connective tissue growth factor high expression showing that tumornode-metastasis (TNM) stage, duke stage, lymph node status and Necrosis of tumor tissue were independent predictors for disease-free survival; B: Depicts that TNM Stage and perineural invasion status were independent predictors for overall survival of colorectal cancer patients. aP < 0 .05 . CRC: Colorectal cancer; CTGF:Connective tissue growth factor; PNI: Perineural invasion.
CONCLUSION
In conclusion, our results reported strong cytoplasmic localization and overexpression of CTGF in colorectal tumors compared to their adjacent normals. Moreover, the results of this study indicate that the overexpression of CTGF is associated with more intrusive clinicopathological parameters of CRC, suggesting that the expression of CTGF may be important in CRC progression. CTGF expression status could be an independent prognostic factor for CRC patients. LVI and PNI status could be used as complementary factors for TNM staging of CRC. However, because the current study included a limited sample size, more studies with a large number of samples is needed to fully comprehend the mechanism of CTGF induced CRC progression.
ARTICLE HIGHLIGHTS

ACKNOWLEDGEMENTS
The authors have greatly appreciated the cooperative participation of patients. The authors would also like to thank the technical personnel of the Department of Pathology at SKIMS for their assistance with the IHC experiments. Authors are also grateful to Daniel Ingo Hefft, University Centre Reaseheath, Reaseheath College,Nantwich CW56 DF, United Kingdom for English language editing. The authors would like to extend their sincere appreciation to the researchers supporting project number RSP 2021 /301 , King Saud University, Riyadh, Saudi Arabia.
 World Journal of Gastroenterology2022年5期
- World Journal of Gastroenterology的其它文章
- Simultaneous endoscopic and video-assisted retroperitoneal debridement in walled-off pancreatic necrosis using a laparoscopic access platform: Two case reports
- Curative resection with endoscopic submucosal dissection of early gastric cancer in Helicobacter pylorinegative Ménétrier’s disease: A case report
- Viral hepatitis: Innovations and expectations
- Effect of Bacillus subtilis, Enterococcus faecium, and Enterococcus faecalis supernatants on serotonin transporter expression in cells and tissues
- Abnormal liver chemistries as a predictor of COVID-19 severity and clinical outcomes in hospitalized patients
- Colorectal cancer screening and surveillance in patients with inflammatory bowel disease in 2021