Atrophic gastritis and gastric cancer tissue miRNome analysis reveals hsa-miR-129 -1 and hsa-miR-196 a as potential early diagnostic biomarkers
Greta Varkalaite,Evelina Vaitkeviciute, Ruta Inciuraite, Violeta Salteniene, Simonas Juzenas,VytenisPetkevicius, Rita Gudaityte,Antanas Mickevicius, Alexander Link, Limas Kupcinskas,Marcis Leja, JuozasKupcinskas,Jurgita Skieceviciene
Abstract
Key Words: Gastric cancer; Atrophic gastritis; Tumorigenesis; Helicobacter pylori;MicroRNAs; Biomarkers
INTRODUCTION
Gastric cancer (GC) is the one of the most common malignancy and the fourth leading cause of cancer-related death worldwide[1 ]. Studies show, that in most cases GC development is a stepwise process: Chronic gastric mucosa inflammation progresses to atrophic gastritis (AG) or intestinal metaplasia (IM), which eventually may become predisposition to GC. This complex cascade involves many factors:Helicobacter pylori(H. pylori) infection, lifestyle, dietary habits, and genetic or epigenetic alterations,including miRNA expression changes[2 ,3 ]. One of the major concerns in diagnostics of GC is poor survival rate and prognosis, while this tumor is usually diagnosed at late stages. Therefore, investigation of the molecular mechanisms that are critical in the complex GC pathological cascade may help to identify novel therapeutic targets and consequently improve the disease prognosis. MicroRNAs (miRNAs) are small (approx 22 nt) non-coding RNA molecules that regulate gene expression by binding to the specific sites within 3 ’ untranslated regions of target mRNAs[4 ,5 ]. MiRNAs play very important role in many physiological and pathological processes as well as tumorigenesis and may function as either tumor-suppressors or as oncogenic miRNAs[6 -8 ].Studies have reported numerous differentially expressed miRNAs in malignant gastric tissues including members of miR-20 , miR-451 , miR-148 , miR-223 families[9 -11 ].Despite the previous efforts and conducted miRNA studies in GC, the miRNome characterization of premalignant gastric condition - AG - remains largely unknown.
In this study, we aimed to investigate miRNome profile through GC tumorigenesis cascade including precancerous lesions, such as AG. Also, expression of two miRNAs(hsa-miR-129 -1 and hsa-miR-196 a) was analyzed in plasma samples of the independent cohort of AG and GC patients. Tissue miRNome analysis results revealed distinct miRNA profiles comparing controls (CON), AG, and GC groups. Also, our study findings show that two miRNAs: Hsa-miR-129 -1 and hsa-miR-196 a may be a relevant biomarker for GC diagnostics.
MATERIALS AND METHODS
Study population
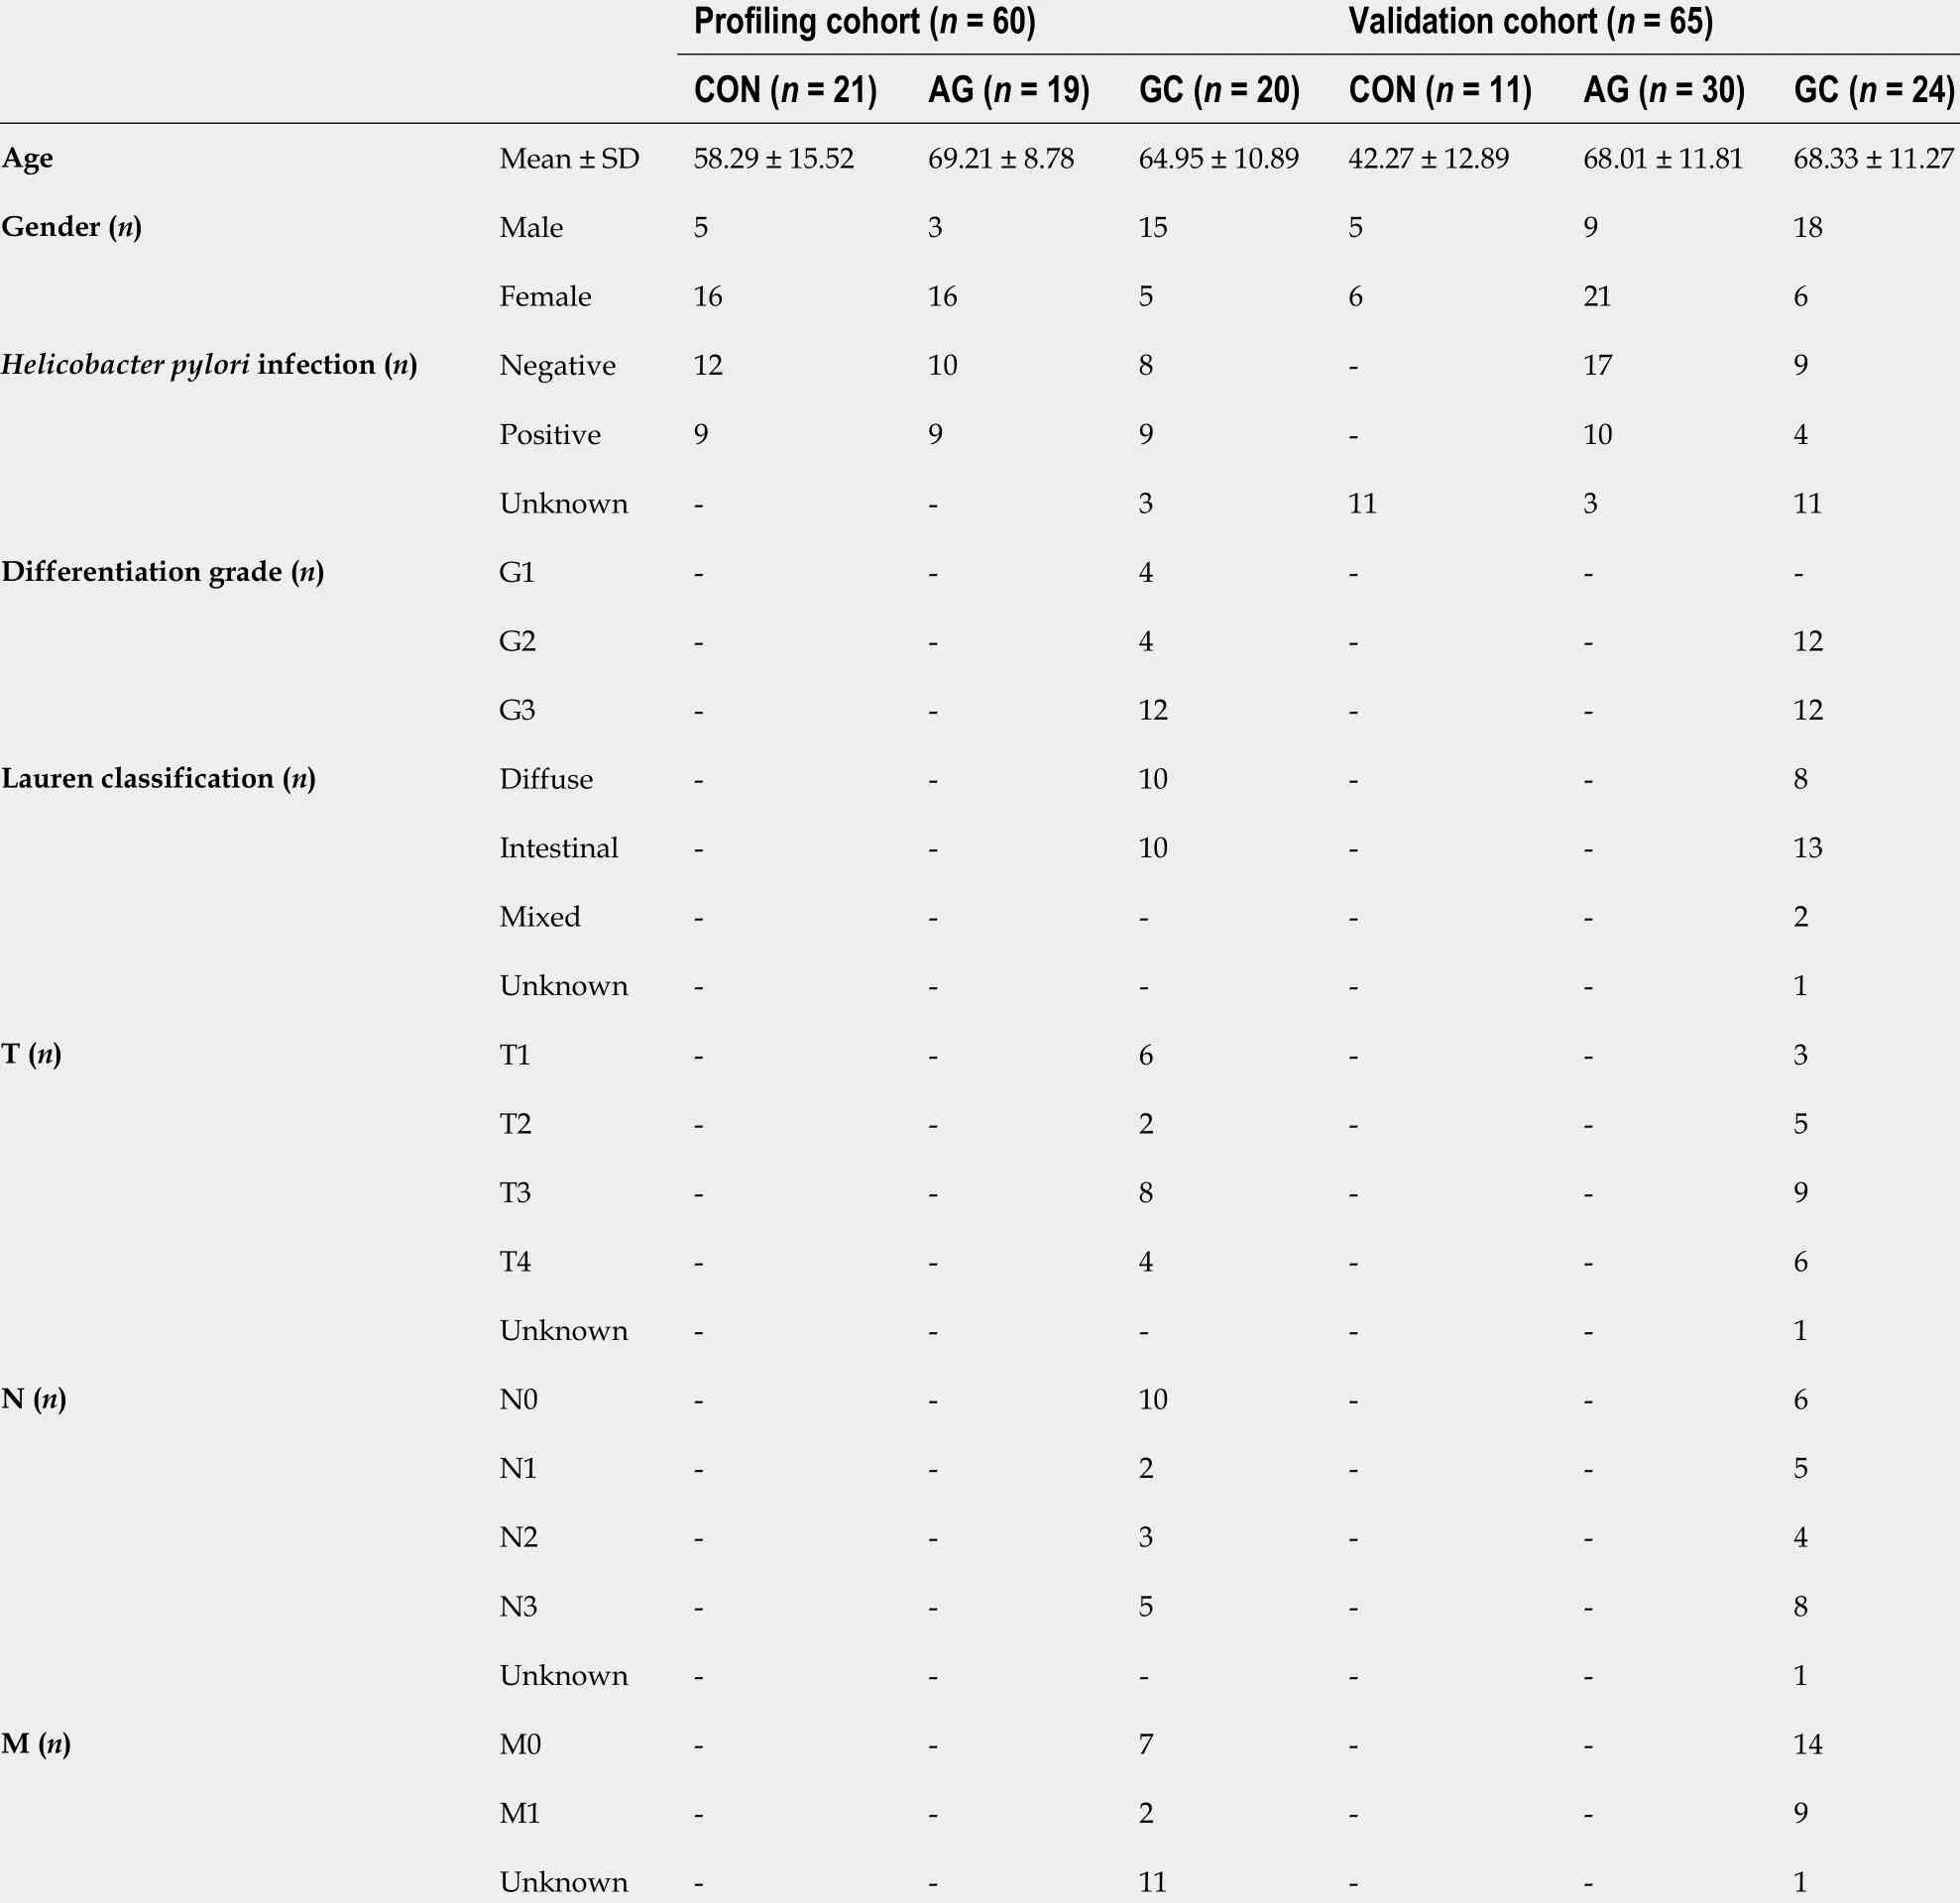
The study included a total of 125 CON and patients diagnosed with AG and GC, who were divided into the profiling cohort of 60 subjects and validation cohort of 65 subjects. Tissue samples of profiling cohort were collected during the years 2007 -2015 ,while plasma of participants in validation cohort was collected from years 2011 -2019 at the Departments of Surgery and Gastroenterology, Hospital of Lithuanian University of Health Sciences (Kaunas, Lithuania). Clinical and phenotypic characteristics of subjects investigated in profiling and validation cohorts are presented in Table 1 .H.pyloristatus was assessed using indirect ELISA to detect serum-specific IgG antigen(Virion/Serion GmbH, Germany). Control group consisted of subjects, who had no signs of atrophy or IM according to Operative Link on Gastritis Assessment (OLGA)staging system (stage 0 )[12 ]. AG group consisted of individuals that had stage I-IV atrophy score in gastric mucosa by OLGA classification. Gastric adenocarcinoma in GC patients was verified by histology and classified according to the American Joint Committee on Cancer TNM Staging Classification and Lauren Classification[13 ,14 ].Adjacent GC (GCaj) samples were biopsy samples obtained from endoscopically healthy appearing gastric mucosa at least 2 cm away from the primary tumor.
The study was approved by the Kaunas Regional Biomedical Research Ethics Committee (approval No BE-2 -10 and BE-2 -31 ) and performed in accordance with the Declaration of Helsinki. All study participants provided written informed consent before enrollment.
Total RNA extraction
Total RNA, including small RNA fraction, was isolated from CON, AG and GC tissues using miRNeasy Mini Kit (Qiagen, Germany) according to the manufacturer’s instructions. Quantification of RNA was performed using Nanodrop2000 spectrophotometer (Thermo Fisher Scientific, United States) and quality of RNA samples was evaluated by Agilent 2100 Bioanalyzer (Agilent Technologies, United States).Circulating nucleic acids, including circulating miRNA fraction, was isolated using QIAamp Circulating Nucleic Acid Kit (Qiagen, Germany) according to manufacturer’s instructions. All isolated samples were stored at -80 °C prior to further analysis.

Table 1 Demographic characteristics of profiling and validation cohorts
Small RNA-seq library preparation and next-generation sequencing
Small RNA libraries were prepared using Illumina TruSeq Small RNA Sample Preparation Kit (Illumina, United States) according to the manufacturer’s protocol with 1 μg RNA input per sample followed by RNA 3 ’ adapter ligation, RNA 5 ’ adapter ligation, cDNA synthesis, polymerase chain reaction (PCR) amplification using unique barcode sequences for each sample and gel size-selection of small RNA library. The yield and quality of sequencing libraries were assessed using the Agilent 2100 Bioanalyzer (Agilent Technologies, United States). The small RNA libraries were randomized, pooled 24 samples per lane and sequenced using Illumina HiSeq 2500 (1 × 50 bp single-end reads).
Bioinformatics analysis of small RNA-seq data
Analysis of raw small RNA-seq data was performed by nf-core/smrnaseq pipeline v.1 .0 .0 including Nextflow v.20 .07 .1 [15 ], Java v.11 .0 .7 , and Docker v.19 .03 .12 . In brief,all steps consisted of read quality control using FastQC v.0 .11 .9 , removing 3 ’ adapter sequences with TrimGalore! v.0 .6 .5 , mapping to mature and hairpin miRNAs(miRBase v.22 .1 [16 ]), and GRCh37 human reference genome with Bowtie v.1 .3 .0 [17 ].After alignment and trimming sorted BAM files were used for further analysis with edgeR v.3 .32 .1 [18 ] and mirtop v.0 .4 .23 . MiRNA quality was assessed and summarized using MultiQC v.1 .9 [19 ]. Normalized counts were generated using isomiRs package and differential expression analysis was carried out using the DESeq2 Bioconductor package v.1 .26 .0 [20 ]. The threshold for significant differential expression was Bonferroni[21 ] adjusted P-value < 0 .05 and absolute value of log2 fold change (FC)|log2 FC| > 1 .
Validation of miRNA expression in plasma by reverse transcription quantitative realtime PCR
To validate differentially expressed miRNAs in plasma samples, isolated plasma circulating microRNA was reverse transcribed to cDNA using the TaqMan™MicroRNA Reverse Transcription Kit (Thermo Fisher Scientific, United States). The material was preamplified using the TaqMan PreAmp Master Mix (Applied Biosystems, United States) according to the manufacturer’s protocol. Quantitative realtime PCR (RT-PCR) was performed using the TaqMan MicroRNA Assays: Hsa-miR-129 * (Assay ID: 002298 ), hsa-miR-196 a (Assay ID: 241070 _mat) on 7500 Fast Real-Time PCR System (Applied Biosystems, United States). All RT-qPCR reactions were run in duplicate in a 20 μL reaction and the relative fold change in miRNA expression was estimated using the 2 -ΔΔCt method[22 ]. Ct values were normalized to the RNU6 B (Assay ID: 001093 , Thermo Fisher Scientific, United States) endogenous control.
Statistical analysis
Statistical analysis was performed using RStudio software (R v.3 .6 .3 ). Shapiro-Wilk normality test was used to test the normal distribution of data. For normally distributed data, statistical significance was assessed by Student'st-test. If the data did not pass normality tests was performed non-parametric Wilcoxon rank-sum test. AP<0 .05 was considered statistically significant. Area under the receiver operating characteristic curve (AUC-ROC) analysis was performed using pROC R package.
RESULTS
Small RNA sequencing reveals distinct miRNomes of healthy, premalignant, and malignant stages of GC
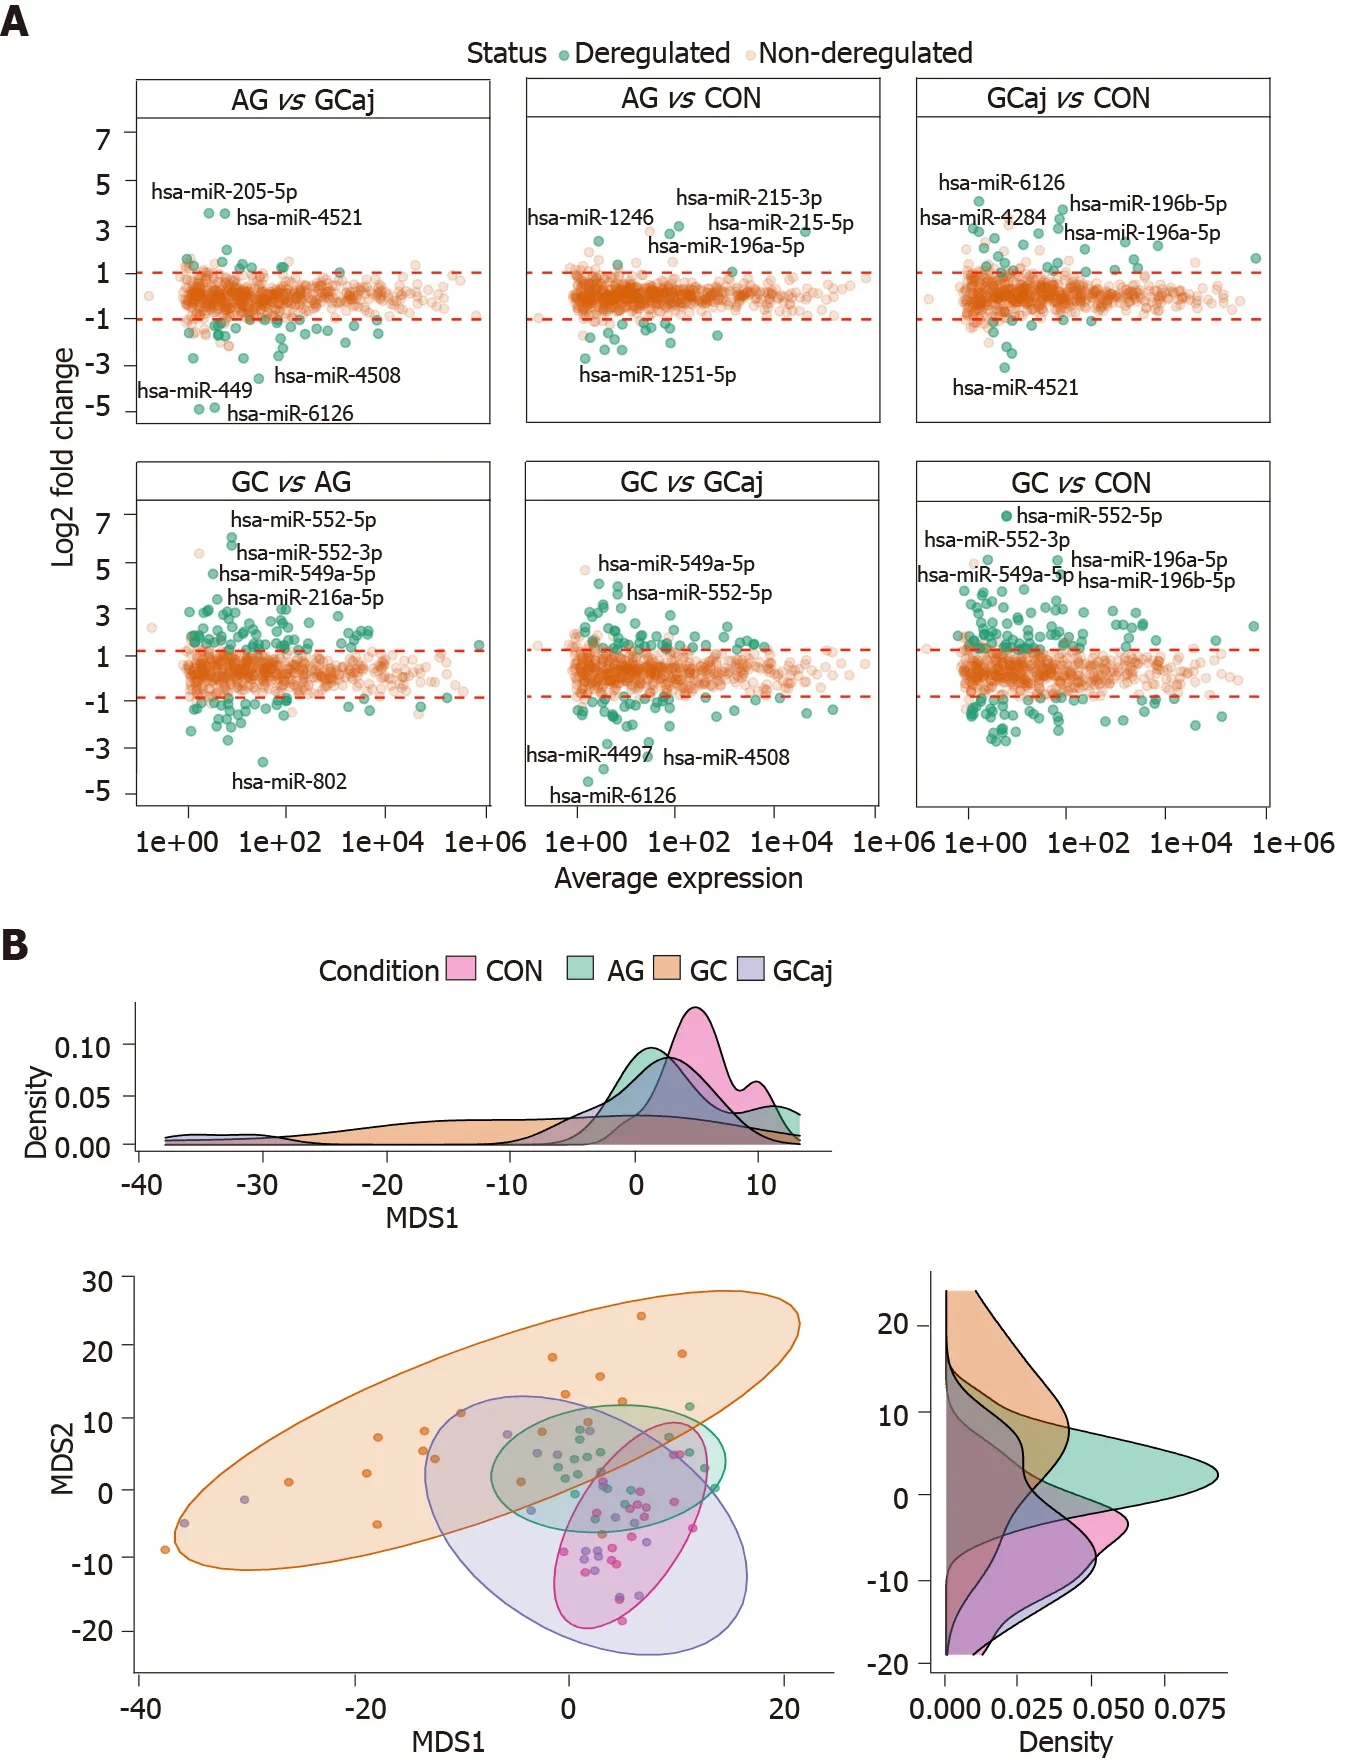
Small RNA sequencing of CON, AG, and paired GC (cancerous and adjacent) tissues in total identified 1037 miRNAs annotated in the miRBase v22 .1 . Sequencing yielded approx 250 M raw sequencing reads (from 359 K to 16 M reads per sample). After quality control steps 396 low-abundant and non-variable miRNAs and 5 outlying samples were removed resulting in 641 miRNAs and 75 samples which were used for further analysis (Supplementary Figures 1 and 2 ). The number of deregulated miRNAs corresponded to pathological cascade of GC development. The highest number of deregulated miRNAs were determined when comparing GC and CON groups (129 differentially expressed miRNAs, 82 up-regulated and 47 down-regulated;Supplementary Table 1 ). Next, 99 differentially expressed miRNAs were identified analyzing GC compared to AG (67 up-regulated and 32 down-regulated;Supplementary Table 2 ). The lowest number, 20 miRNAs, were found to be deregulated comparing AG and CON (6 up-regulated and 14 down-regulated;Supplementary Table 3 ). Differential expression results comparing GCvsGCaj, AGvsGCaj, and CONvsGCaj are presented in Supplementary Tables 4 , 5 and 6 respectively.Differential expression results and top five deregulated miRNAs in each case are represented in Figure 1 A. Multidimensional scaling analysis of normalized expression values, assessing the similarity structure of miRNomes (Spearman’s correlation distance), revealed 4 clusters, corresponding to the CON, AG, GC cancerous and adjacent tissues (Figure 1 B). The AG cluster was intermediate between GC and CON,whereas GCaj was overlapping with AG and CON groups.
Hsa-miR-1 29 -1 -3 p and hsa-miR-196 a-5 p may be employed for discrimination of healthy, premalignant, and malignant GC cases

Figure 1 Results of microRNA differential expression analysis. A: Differentially expressed gastric tissue microRNAs among different conditions. Padjusted < 0 .05 and |log2 fold change| > 1 ; B: Multidimensional scaling plot based on normalized data showing a clustering corresponding to control, atrophic gastritis, gastric cancerous and adjacent tissues. The density plots show distributions of the first and second dimensions. CON: Control; AG: Atrophic gastritis; GC:Gastric cancerous; GCaj: Gastric adjacent tissue; MDS: Multidimensional scaling.
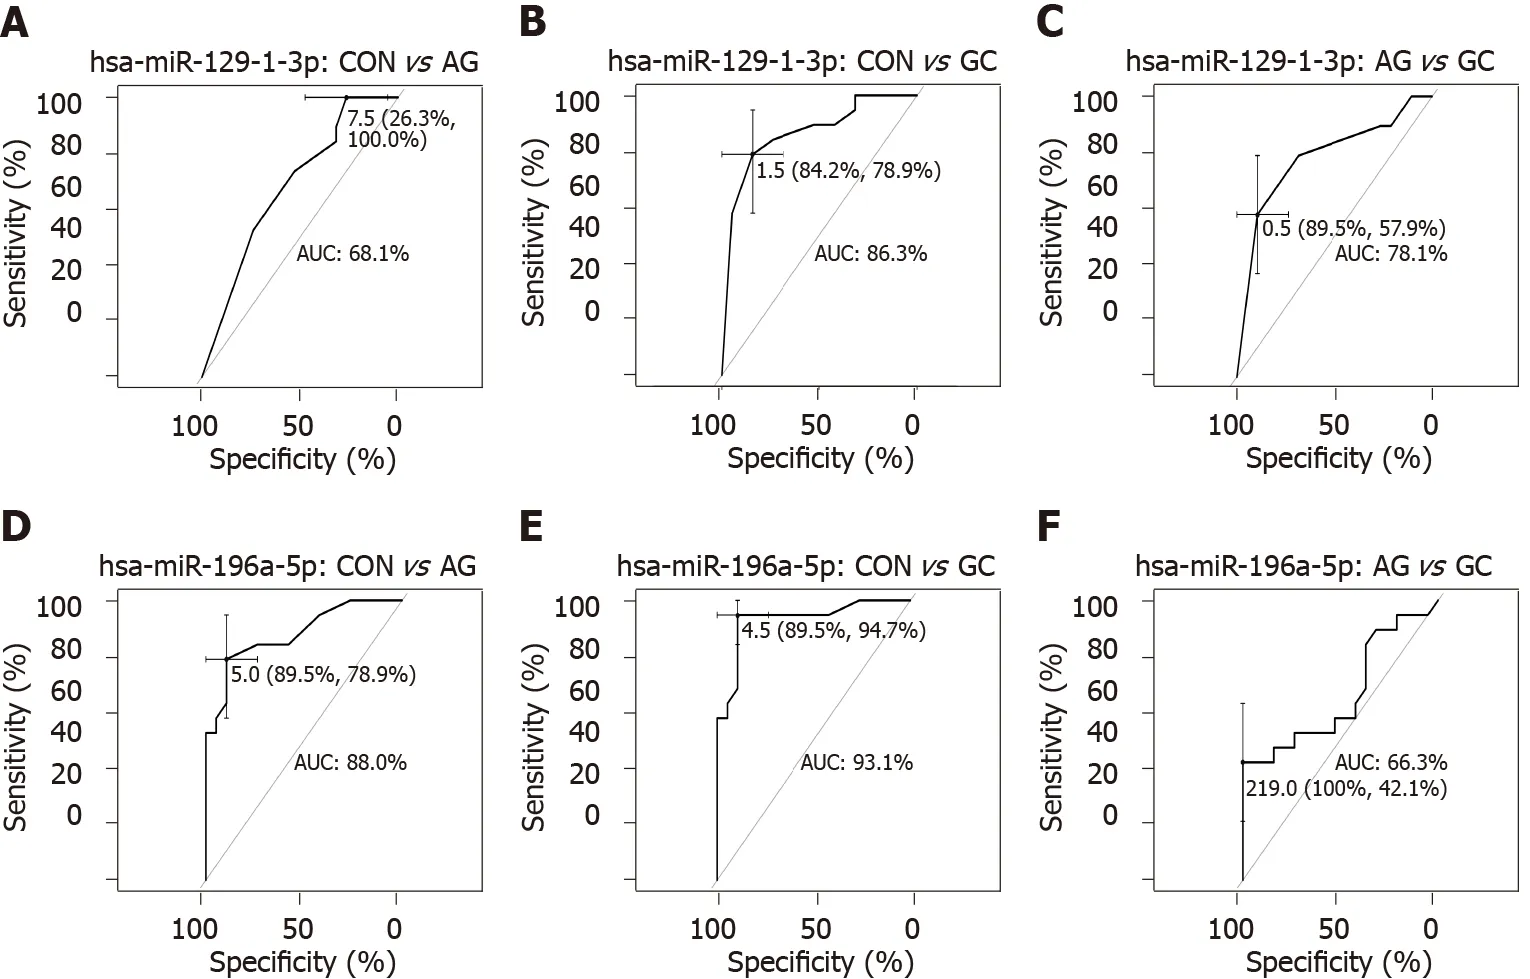
To further study miRNome profiles, altered expression of miRNAs was analyzed in three main comparison groups: AGvsCON, GCvsCON and AGvsGC according to clinical significance. Analyzing uniquely deregulated miRNAs, 40 differentially expressed miRNAs were found when compared GC to CON (25 .8 % of all deregulated miRNAs), 18 (11 .6 %) - AG compared to GC, and 6 (3 .9 %) - AG compared to CON(Figure 2 ). Most of the deregulated miRNAs (n = 79 , 68 .7 %) were similar between GCvsCON and GCvsAG comparison groups. 12 miRNAs (7 .7 %) were deregulated in both AG and GC groups when compared to CON. Four miRNAs (2 .6 %) were similarly deregulated between AGvsCON and AGvsGC groups. Finally, only 2 miRNAs (hsamiR-129 -1 -3 p and hsa-miR-196 a-5 p) (1 .29 %) were identified as deregulated between all comparison groups. AUC-ROC analysis revealed that expression level of hsa-miR-129 -1 -3 p in tissues resulted in AUCs: 68 .1 %; 86 .3 %, and 78 .1 %, CONvsAG, CONvsGC, and AGvsGC, respectively (Figures 3 A, 3 B and 3 C). In addition to this,expression level of hsa-miR-196 a-5 p could be significant for discrimination of CONvsAG, CONvsGC and AGvsGC and resulted in AUCs: 88 .0 %, 93 .1 % and 66 .3 %(Figures 3 D, 3 E and 3 F).
刚开始自驾游时,大孙女李子宜还在上小学,现在她已经上高三了。这些年的出游大大锻炼了她的各种能力。从新疆回来后,她将自己的感受写成了14页纸的《天路行》,获得“国家新闻奖”。在学校,她制作的旅游幻灯片图文并茂,很受同学们欢迎,为此,她成为学校的小记者。她的地理成绩在全年级也是名列前茅。
Hsa-miR-1 29 -1 -3 p and hsa-miR-196 a-5 p expression in the plasma follows the expression pattern of CON, AG, and GC tissues
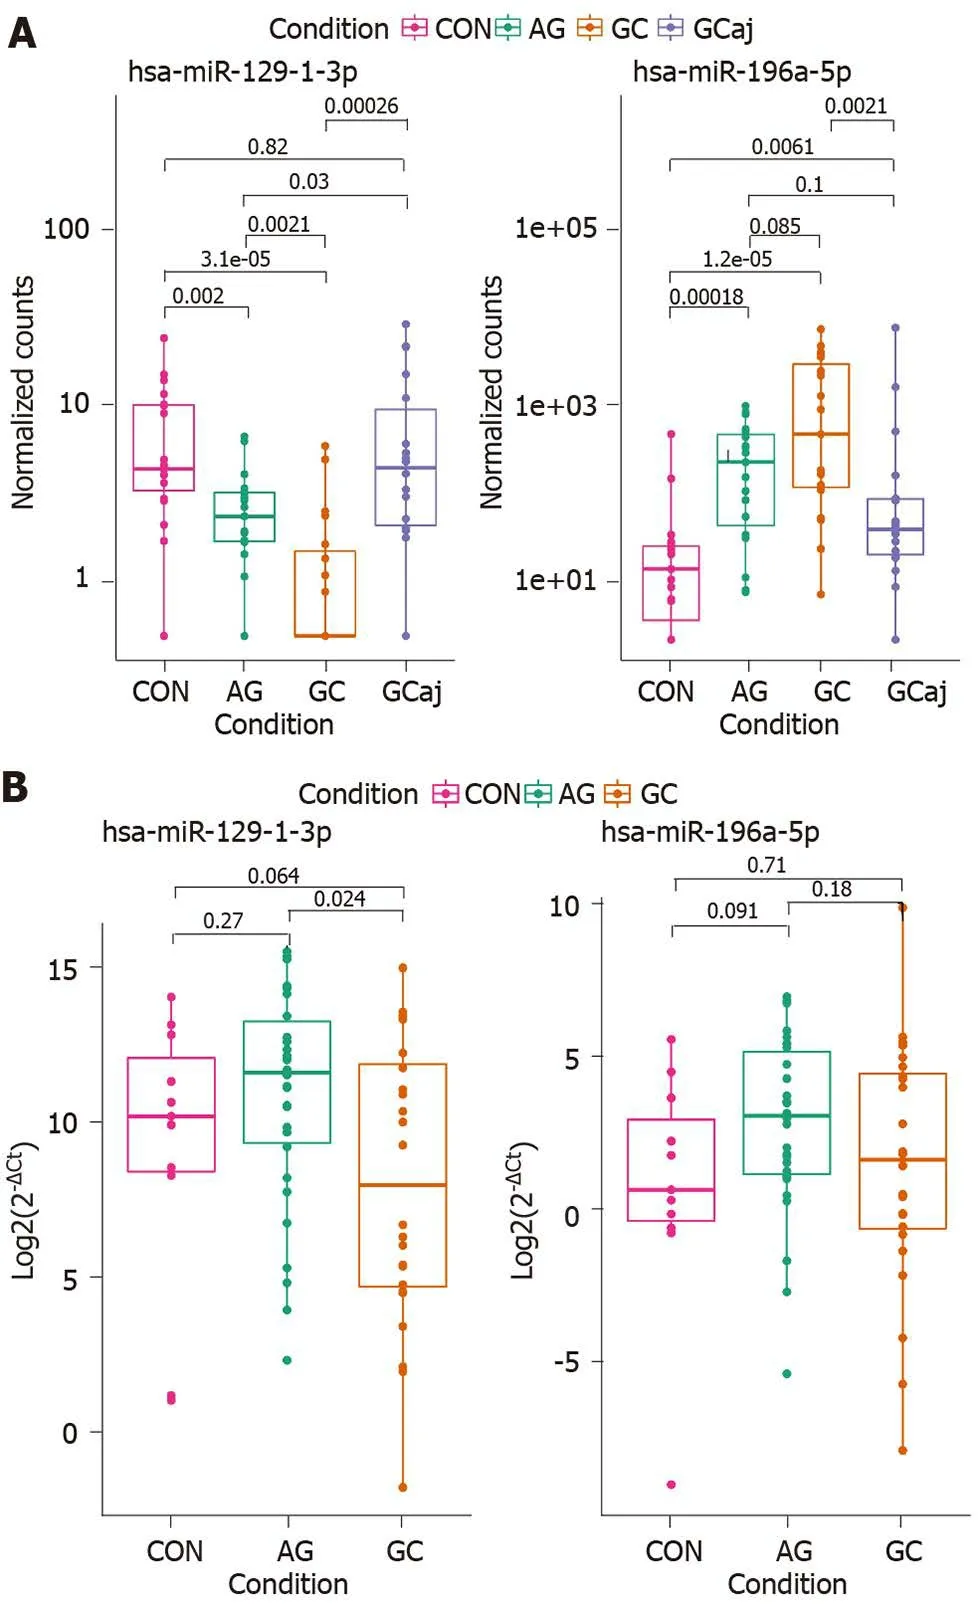
Differential expression analysis of NGS data in tissue samples revealed that hsa-miR-129 -1 -3 p was significantly down-regulated and hsa-miR-196 a-5 p was up-regulated in AG and GC tissues compared to CON (P= 0 .002 and P = 0 .00018 ; P = 1 .2 × 10 -5 andP=3 .1 × 10 -5 , respectively). Moreover, hsa-miR-129 -1 -3 p was significantly down-regulated in the case of AG compared to GC (P= 0 .0021 ) and reflected a stepwise process of apathology (Figure 4 A). Therefore, to identify whether the expression changes of these two miRNAs can be detected noninvasively in the body fluids of the patients, hsamiR-129 -1 -3 p and hsa-miR-196 a-5 p were selected for RT-qPCR analysis in plasma samples of independent cohort. The analysis showed similar expression patterns in the case of hsa-miR-129 -1 -3 p, which was significantly down-regulated when comparing AG and GC groups (P= 0 .024 ). There were no other significant findings between the groups (Figure 4 B).

Figure 3 Receiver operating characteristic curves showing prediction performances of expression levels. A-C: Hsa-miR-129 -1 -3 p; D-F: HsamiR-196 a-5 p in tissue samples between different comparison groups: Control vs atrophic gastritis; control vs gastric cancer; and atrophic gastritis vs gastric cancer.AUC: Area under the curve; CON: Control; AG: Atrophic gastritis; GC: Gastric cancer.
Hsa-miR-2 15 -3 p/5 p and hsa-miR-934 may be associated with H. pylori-induced GC
To investigate role of miRNAs in AG atrophy progression (OLGA classification) andH. pylori-induced GC, differential miRNAs profile analysis in the subgroups of the study was performed. The analysis revealed a minor clustering in AG tissues corresponding to OLGA stages (Supplementary Figures 3 A and 3 H).H. pyloristatus in GC tissues (Supplementary Figure 3 B). However, no significantly deregulated miRNAs were determined comparing I-II OLGA stagesvsIII-IV OLGA stages (AG tissue samples). On the other hand, analyzing GC group based onH. pyloriinfection status[H. pylori(neg.)vs H. pylori(pos.)], three miRNAs were shown to be significantly deregulated: Hsa-miR-215 -3 p (log2 FC = -4 .52 , P-adjusted = 0 .02 ), hsa-miR-215 -5 p(log2 FC = -4 .00 , P-adjusted = 0 .02 ), and hsa-miR-934 (log2 FC = 6 .09 , P-adjusted = 0 .02 ).

Figure 4 Hsa-miR-129 -1 -3 p and hsa-miR-196 a-5 p expression levels in study comparison groups. A: Atrophic gastritis and gastric cancer tissue samples compared to controls; B: Atrophic gastritis and gastric cancer plasma samples compared to controls. Box plot graphs; boxes correspond to the median value and interquartile range. CON: Control; AG: Atrophic gastritis; GC: Gastric cancerous; GCaj: Gastric adjacent tissue.
DISCUSSION
This study represents comprehensive miRNome profiling of premalignant and malignant GC cases by implementing high throughput technologies such as NGS.Although there are several studies reporting profiles of GC tissue miRNAs[23 ,24 ],analysis of the association between miRNA expression and AG is very scarce reporting only individual miRNAs[25 ]. Moreover, based on small RNA-seq findings, two miRNAs were analyzed in subjects’ plasma samples to investigate potential noninvasive markers. To our best knowledge this is the first study analyzing AG and GC tissue miRNomes in the subjects of European origin.
First, our study showed different profiles of deregulated miRNAs between tissue samples of studied groups. In total, 20 differentially expressed miRNAs were identified in AG and 129 - in GC comparing to CON; also 99 deregulated miRNAs -comparing GC and AG groups. MiRNAs such as hsa-miR-3131 , hsa-miR-483 , hsa-miR-150 , hsa-miR-200 a-3 p, hsa-miR-873 -5 p were previously reported by the GC profiling studies of Pereiraet al[23 ] and Assumpção et al[24 ]. Yet, we were able to identify number of novel miRNAs (of which hsa-miR-548 ba, hsa-miR-4521 , hsa-miR-549 a were the most deregulated). There are no data showing the role of these novel miRNAs in inflammatory or tumorous processes of gastric tissue. However, recent studies have shown that hsa-miR-548 ba was associated with bladder cancer, hsa-miR-549 a with the metastasis of renal cancer, and hsa-miR-4521 withH. pyloriinfection in esophageal epithelial cells[26 -28 ]. Taking into consideration miRNome of AG, hsa-miR-3591 -3 p,hsa-miR-122 -3 p and hsa-miR-122 -5 p, hsa-miR-451 a miRNAs were already reported by Liuet al[29 ], while the most deregulated miRNAs including hsa-miR-215 , hsa-miR-4497 , and hsa-miR-1251 were reported for the first time in our study. Previous research showed that hsa-miR-215 -5 p was deregulated in different lesions of the gastrointestinal tract (Barrett’s esophagus, intraepithelial neoplastic lesions, ulcerative colitis)[30 -32 ]. However, hsa-miR-4497 and hsa-miR-452 were not previously associated with AG but were reported to play an important role in GC development[33 ,34 ].
Next, we identified hsa-miR-215 -3 p and hsa-miR-215 -5 p to be down-regulated while hsa-miR-934 - up-regulated in GC group comparing negative and positiveH.pyloriinfection status. Studies revealed the altered expression of various miRNAs inH.pylori-induced GC tissue samples, including miR-934 , miR-146 a, miR-375 , miR-204 [35 -37 ]. Although, hsa-miR-215 deregulation was previously associated with GC[38 -40 ],there is no data showing its link withH. pyloriinfection.
In addition to this, we showed that two miRNAs (hsa-miR-129 -1 -3 p and hsa-miR-196 a-5 p) were gradually deregulated comparing all three study groups (CON, AG,and GC) which also corresponds to pathological cascade of GC. In concordance to our results, it has already been shown that hsa-miR-129 -1 -3 p was down-regulated in GC tissues, function as a tumor suppressor in GC and even corresponds to the same expression pattern in gastric juice[41 ,42 ]. There is no data regarding the hsa-miR-196 a expression in AG tissue, however, investigators have revealed that hsa-miR-196 a is overexpressed in GC tissue, plasma, commercial cell lines and promotes cell proliferation[43 ,44 ]. ROC-AUC analysis suggests great potential of hsa-miR-196 a-5 p expression in tissue for discrimination of AG and GC in contrast to CON (AUC =89 .5 % and AUC = 89 .5 %, respectively). Therefore, further studies are needed to confirm this finding.
Finally, selected miRNAs were analyzed in independent cohort of CON, AG, and GC plasma samples by using RT-qPCR. Results showed similar deregulation direction in plasma samples as in the tissue samples. However, significant differences were only determined comparing the expression of hsa-miR-129 -1 -3 p between AG and GC suggesting its potential role in non-invasive diagnostics of malignant cases. No significant expression changes were observed between study groups and hsa-miR-196 a-5 p. Other studies have shown controversial results: Tsai et al[45 ] reported that miR-196 a/b was up-regulated in both the plasma and tissue of metastatic GC patients,while miRNome profiling study revealed that miR-196 a-5 p was found to be downregulated in plasma of patients with precursor lesions of GC compared to non-active gastritis[46 ].
In our study, using NGS and RT-qPCR techniques we have shown the distinct miRNome profiles of CON, AG, GC, GCaj tissues, and potential of specific miRNAs as non-invasive biomarkers. In addition to this, novel miRNAs not previously reported as AG or GC associated epigenetic markers were identified. We have shown that hsamiR-196 a-5 p expression in tissue could be significant for discrimination between CON and AG or GC, confirmed hsa-miR-129 -1 -3 p as non-invasive biomarker in disease progression monitoring, and showed that miRNAs could be a great candidate for future research of new diagnostic approaches.
CONCLUSION
In conclusion, we showed gradual deregulation of hsa-miR-196 a-5 p and hsa-miR-129 -1 -3 p in the gastric carcinogenesis pathway and confirmed hsa-miR-129 -1 -3 p as a possible non-invasive biomarker. We also found hsa-miR-215 -3 p/5 p and hsa-miR-934 to be significantly deregulated in GC based onH. pyloriinfection status. These data provide novel insights into complex GC pathogenesis cascade which could be highly significant for future studies of new diagnostic GC targets.
ARTICLE HIGHLIGHTS


Research motivation
Novel biomarkers that would help to improve GC patients’ diagnosis and prognosis are highly needed. Studies show that microRNAs (miRNAs) play an important role in many cancers and could be a promising biomarker or even therapeutic target.
Research objectives
The objectives of the study were to analyze whole miRNome profiles of control,premalignant and malignant gastric tissues, and select the potential miRNA markers that could have a potential for minimally invasive GC diagnostics.
Research methods
Total RNA from gastric tissue samples was subjected for small RNA sequencing(smRNA-seq). Plasma total circulating nucleic acids were used for the expression analysis of the most tissue deregulated miRNAs by real-time quantitative polymerase chain reaction. Statistical analysis involved the differential expression and discrimination analyses.
Research results
The abundance of altered expression miRNAs corresponded to a pathological cascade of GC development. Hsa-miR-129 -1 -3 p and has-miR-196 a-5 p were shown to be deregulated in healthy-premalignant-malignant sequence. In addition to this, we showed that down-regulation of hsa-miR-129 -1 -3 p could also be detected noninvasively in GC patients’ plasma samples. Finally, results indicated that hsa-miR-215 -3 p/5 p and hsa-miR-934 were significantly deregulated based onH. pyloriinfection status for GC patients.
Research conclusions
Gastric tissue miRNome study provides extensive profiling of control, premalignant and malignant cases. Based on smRNA-seq results several miRNAs were shown as potential gastric carcinogenesis (hsa-miR-196 a-5 p and hsa-miR-129 -1 -3 p); andH. Pylori-related (hsa-miR-215 -3 p/5 p and hsa-miR-934 ) biomarkers.
Research perspectives
This study provides novel insights into complex GC pathogenesis cascade and could serve as a reference for future research to support our findings.
 World Journal of Gastroenterology2022年6期
- World Journal of Gastroenterology的其它文章
- Comments on validation of conventional non-invasive fibrosis scoring systems in patients with metabolic associated fatty liver disease
- COVID-19 , liver dysfunction and pathophysiology: A conceptual discussion
- Gallbladder Burkitt’s lymphoma mimicking gallbladder cancer: A case report
- Validation of the PAGE-B score to predict hepatocellular carcinoma risk in caucasian chronic hepatitis B patients on treatment
- Effects of viremia and CD4 recovery on gut “microbiome-immunity” axis in treatment-naïve HIV-1 -infected patients undergoing antiretroviral therapy
- Recent advances in the diagnostic evaluation of pancreatic cystic lesions
