
A Case Study on the Rapid Rain-to-Snow Transition in Late Spring 2018 over Northern China: Effects of Return Flows and Topography
2022-03-12 07:50WenlongZHANGXiaopengCUIBolongDUANBoYURunxiaGUOandHaiwenLIU
Wenlong ZHANG, Xiaopeng CUI, Bolong DUAN, Bo YU, Runxia GUO, and Haiwen LIU
1 Institute of Urban Meteorology, China Meteorological Administration, Beijing 100089
2 Key Laboratory of Cloud–Precipitation Physics and Severe Storms, Institute of Atmospheric Physics,Chinese Academy of Sciences, Beijing 100029
3 Lanzhou Central Meteorological Observatory, Lanzhou 730020
4 Beijing Weather Forecast Center, Beijing 100089
5 Department of Aviation Meteorology, Civil Aviation University of China, Tianjin 300300
6 University of Chinese Academy of Sciences, Beijing 100049
ABSTRACT
Key words: midlatitude heavy snow, return flow, phase transition, Bohai Sea cold pool, complex terrain, numerical simulation
1. Introduction
The midlatitude Beijing–Hebei region of China is located in the eastern part of North China, with the Northwest Pacific to the east. North China is prone to experiencing heavy snows in autumn, winter, and spring. Heavy spring snows in North China help alleviate spring drought, promote vegetation growth, reduce dusts and sandstorms, purify the air, and reduce forest and grassland fire hazards. On the other hand, heavy spring snows have adverse effects, such as deep snow cover and spring freezing, which cause damage to civil aviation, transportation networks, city operations, and agricultural and forestry production.
Considerable progress has been made toward understanding heavy snows at mid- to high latitudes, including the characteristics of large-scale circulation (Evans,2006; Chen et al., 2019), the effects of fronts, especially occluded fronts (Schultz and Mass, 1993; Schultz and Vaughan, 2011; Schultz et al., 2014) and frontogenesis(Martin, 1998), the mechanism of atmospheric stratification instability (Marwitz and Toth, 1993), topographic effects (Umek and Gohm, 2016; Campbell et al., 2018),and lake surface effects (Steenburgh and Onton, 2001).For instance, Sharp and Mass (2004) analyzed the influence of easterly gap winds on snowfall near the Columbia River Gorge, while Stuart and Grumm (2006)employed NCEP 2.5° × 2.5° reanalysis data to study the role of easterly wind anomalies within the lower and upper troposphere in the formation of persistent snowstorms on the East Coast of the United States. Researchers have also reported an interesting type of easterly wind—return flow (RF) phenomenon in the midlatitude zone and its role in heavy snow processes (Lewis et al.,1989; Crisp and Lewis, 1992; Lewis and Crisp, 1992).RFs can be observed in the Gulf of Mexico near 30°N,the eastern plains of China near the Yellow Sea, and some regions in Europe. Crisp and Lewis (1992) pointed out that ancient people living in the Yangtze River Delta of China discovered the RF phenomenon. They presented a conceptual diagram of RF in the Yangtze River Delta and proposed a clear definition of RF (Crisp and Lewis, 1992). Under the forcing of the synoptic-scale surface cold high pressure system near the cold air source, the dry and cold air over land flows southward,passes over a warm and wet underlying surface (usually the ocean), experiences some changes to the temperature and moisture of the airflow, and then rotates clockwise to flow westward, thereby returning to land in the form of an easterly wind (Crisp and Lewis, 1992). In North China, RFs refer to cold air streams that flow southward from the Northeast Plain of China, pass through the Bohai Sea, and intrude into the North China Plain in the form of easterly winds. North China’s heavy rain and snow events in winter, spring, and autumn are sometimes closely related to these RFs (Zhang et al., 2007).However, since previous studies mostly applied conventional observations or NCEP data, detailed investigations of RFs remain lacking. Of particular importance, a conceptual diagram of the RFs in North China has not yet been presented. Because of the complex topographical conditions, the characteristics and effects of RF in North China may differ from others.
Compared with heavy snows in mid- and late winter,heavy snows in early winter or late spring often accompany a rain–snow phase transition. These transitions, especially the rapid rain-to-snow (RRTS) transitions, represent a difficult problem for operational forecasts and meteorological services, as an inaccurate rain–snow phase transition forecast will lead to poor predictions of the snowfall time, magnitude, and snow depth (Wang et al., 2011; Yang et al., 2013; Guo, 2016), with the ice crystal deposition/sublimation parameterizations (Ma et al., 2021). Through individual case studies or statistical studies, some scholars believe that reducing the surface temperature to below 0°C with advective cooling is the decisive factor for the phase change (Laird and Dickey,1953; Stewart et al., 1990; Dai, 2008; Wang et al., 2013).Others believe that the phase type is not only determined by the surface temperature but also related to the temperature of the layer from 700, 850, or 925 hPa to the ground. Because the raindrops and snow particles in clouds experience evaporative cooling or melting cooling as they fall, the phase type of precipitation is affected. Some differences are observed in the criteria presented by the researchers. Taking the 925-hPa level as an example, the criteria may change from −2 to 4°C(Bocchieri, 1980; Homan and Uccellini, 1987; Stewart and King, 1987; Stewart, 1992; Xu et al., 2006; Qi and Zhang, 2012; Zhang et al., 2013; Sims and Liu, 2015).Ye et al. (2011) investigated the causes of the rain-tosnow phase transition of an early winter, heavy snow event in Beijing and pointed out that the occurrence of the phase transition was attributed to a rapid decrease in the surface temperature approaching the freezing point due to the advection of easterly cold air. They also observed that the temperature decrease before the onset of snow was attributed mainly to the evaporative cooling of raindrops. A few cloud microphysics studies have reported that the critical requirement for freezing rain is that cloud ice particles must completely melt before they fall to the ground and that sufficient ice crystals or snow particles in the cloud are an important condition for producing snowfall (Czys et al., 1996; Huang and Xu,1999).
To date, the demand for accurate weather forecasts and services has been difficult to meet based on the climatic statistical criteria of precipitation phase transitions.Due to the limited data, previous studies could only rely on speculations to discuss the effects of diabatic processes, such as evaporative cooling and melting cooling,on the precipitation phase type when discussing the critical temperature conditions from the surface to the 700-hPa level and could not directly draw specific physical images and carry out a detailed mechanistic understanding. In particular, few studies have been performed on late spring heavy snows. Some questions often arise in late spring heavy snow forecasts, such as the mechanism of the RRTS transition under a high-temperature climatic background, the role of the RF, and the role of the complex terrain in the RRTS phase transition.
This paper aims to use observational and numerical simulation data to study extreme late spring heavy snow events. In Section 2, a case review is given. An observational analysis using conventional data is provided in Section 3. A numerical simulation analysis, which is the main feature of our research compared with previous research, is performed in Section 4. In Section 5, a comprehensive discussion and conceptual diagrams are presented. Section 6 gives our conclusions.
2. Case overview
2.1 Poor forecasting of the RRTS phenomenon
From 0000 UTC 4 to 0000 UTC 5 April 2018, a late spring heavy snow event occurred in Beijing and northwestern Hebei Province, becoming the most delayed occurrence of heavy spring snow ever recorded over Beijing in the last 30 years. In the Beijing area, more than 10 mm of snowfall was observed by one-third of all surface weather stations. The maximum snowfall in 24 h was 16.9 mm, which was recorded at Xidazhuangke Station in Yanqing District, and the maximum snow depth was 14.0 cm, which also occurred in Yanqing District but at Foyeding Station. Many stations in northwestern Hebei Province also observed snowfall greater than 10 mm; the maximum snowfall in 24 h was 22 mm, which was recorded at Yangyuan Station.
The temperature in central North China is often relatively high in late spring. Taking Beijing Station as an example, the daily average temperature on 4 April averaged over the past 10 years is 12.8°C; the average highest temperature is 18.9°C; and the average lowest temperature is 6.8°C. Therefore, forecasters considered that this precipitation process could include both a longer rain stage and a longer rain–snow transition stage. However,the actual process was mainly dominated by snow, resulting in obvious disagreement regarding the occurrence time and amount of snow between the observations and the forecast. Consequently, we select this case and pay more attention to the causes of the RRTS phase transition.
2.2 The observed RRTS features at representative stations
To describe the characteristics of the RRTS phase transition, four representative stations are selected (Fig.1a). Yangyuan (station number: 53492, altitude: 938.7 m) represents the mountainous area of northwestern Hebei Province; Yanqing (54406, 489.1 m) represents the mountainous area of northwest Beijing; Beijing(54511, 32.5 m) represents the plain area significantly affected by urbanization; and Sanhe (54502, 19.3 m)represents the plain area not significantly affected by urbanization.
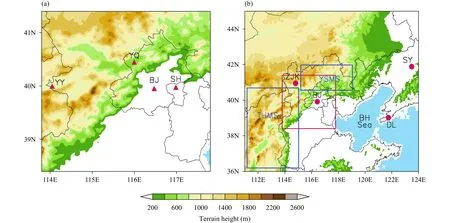
Fig. 1. Distributions of the representative stations of (a) the centers of heavy snowfall and (b) sounding. The shaded background is the terrain,and the blue infill is the ocean. Letters “YY,” “YQ,” “BJ,” and “SH” denote Yangyuan, Yanqing, Beijing, and Sanhe stations, respectively. Letters “SY,” “DL,” and “ZJK” denote Shenyang, Dalian, and Zhangjiakou stations, respectively. Letters “BH Sea” represent the Bohai Sea. The red rectangle in (b) shows the location of (a). The blue box with letters “THMS” denotes the Taihang Mountains, and the box with the letters“YSMS” denotes the Yanshan Mountains.
As indicated by the hourly evolution of the precipitation and air temperature at Yangyuan Station (Fig. 2a),precipitation occurred on 4 April from 0600 to 1400 UTC, and peak snowfall appeared at 0700 UTC. Before snowfall, the temperature at 0300 UTC was 4.5°C and that at 0500 UTC was 1.7°C. However, when nearly 2 mm of snow fell at 0600 UTC, the temperature dropped to −2.7°C. Hence, there was a sharp temperature decrease of approximately 4.4°C from 0500 to 0600 UTC.Therefore, the precipitation at Yangyuan Station completed the RRTS transition process within one hour,which was significantly faster than that estimated by the operational forecast.
The precipitation at Yanqing Station occurred mainly between 0800 and 1600 UTC 4 April, almost all of which was snowfall (Fig. 2b). The peak snowfall occurred at 1200 UTC. The highest temperature occurred at 0500 UTC (4.7°C). At 0700 UTC, one hour before snow started to fall, the temperature was 4°C. However, when snow began to fall at 0800 UTC, the temperature dropped rapidly to 0°C. Similar to the precipitation at Yangyuan Station, the precipitation at Yanqing Station also completed the RRTS phase transition within one hour.
The precipitation at Beijing Station occurred mainly between 0800 and 1800 UTC (Fig. 2c), and the precipitation phase transition was more complicated. Light rain occurred at 0800 UTC, followed by mixed rain and snow from 0900 to 1200 UTC, and then only snow occurred after 1200 UTC. Therefore, rain did not persist for longer than one hour. However, due to the urban heat island effect, mixed rain and snow lasted approximately 4 h. The highest temperature was 8.9°C at 0400 UTC, and the temperature was 7.8°C one hour before precipitation occurred. When precipitation began to fall at 0800 UTC,the temperature dropped sharply to 2.6°C; thus, the drastic temperature decrease within one hour was 5.2°C.Subsequently, the temperature remained at 1.1–1.5°C during the mixed rain and snow stage and at 0.5–0.7°C during the only snow stage.
The precipitation at Sanhe Station occurred mainly between 1000 and 1800 UTC (Fig. 2d). The highest temperature appeared at 0500 UTC (9.0°C). At 1000 UTC,the temperature was 4.7°C, and 0.2 mm of rain fell. At 1100 UTC, the temperature quickly dropped to 0.7°C, so the temperature drop within one hour was 4°C; simultaneously, the precipitation phase changed from rain to snow, and the amount of snow reached 2 mm. After 1100 UTC, the temperature was maintained at 0.5–0.0°C, and the precipitation phase was only snow. Therefore, in the plain area not significantly affected by urbanization, the precipitation phase transition was also completed within one hour.
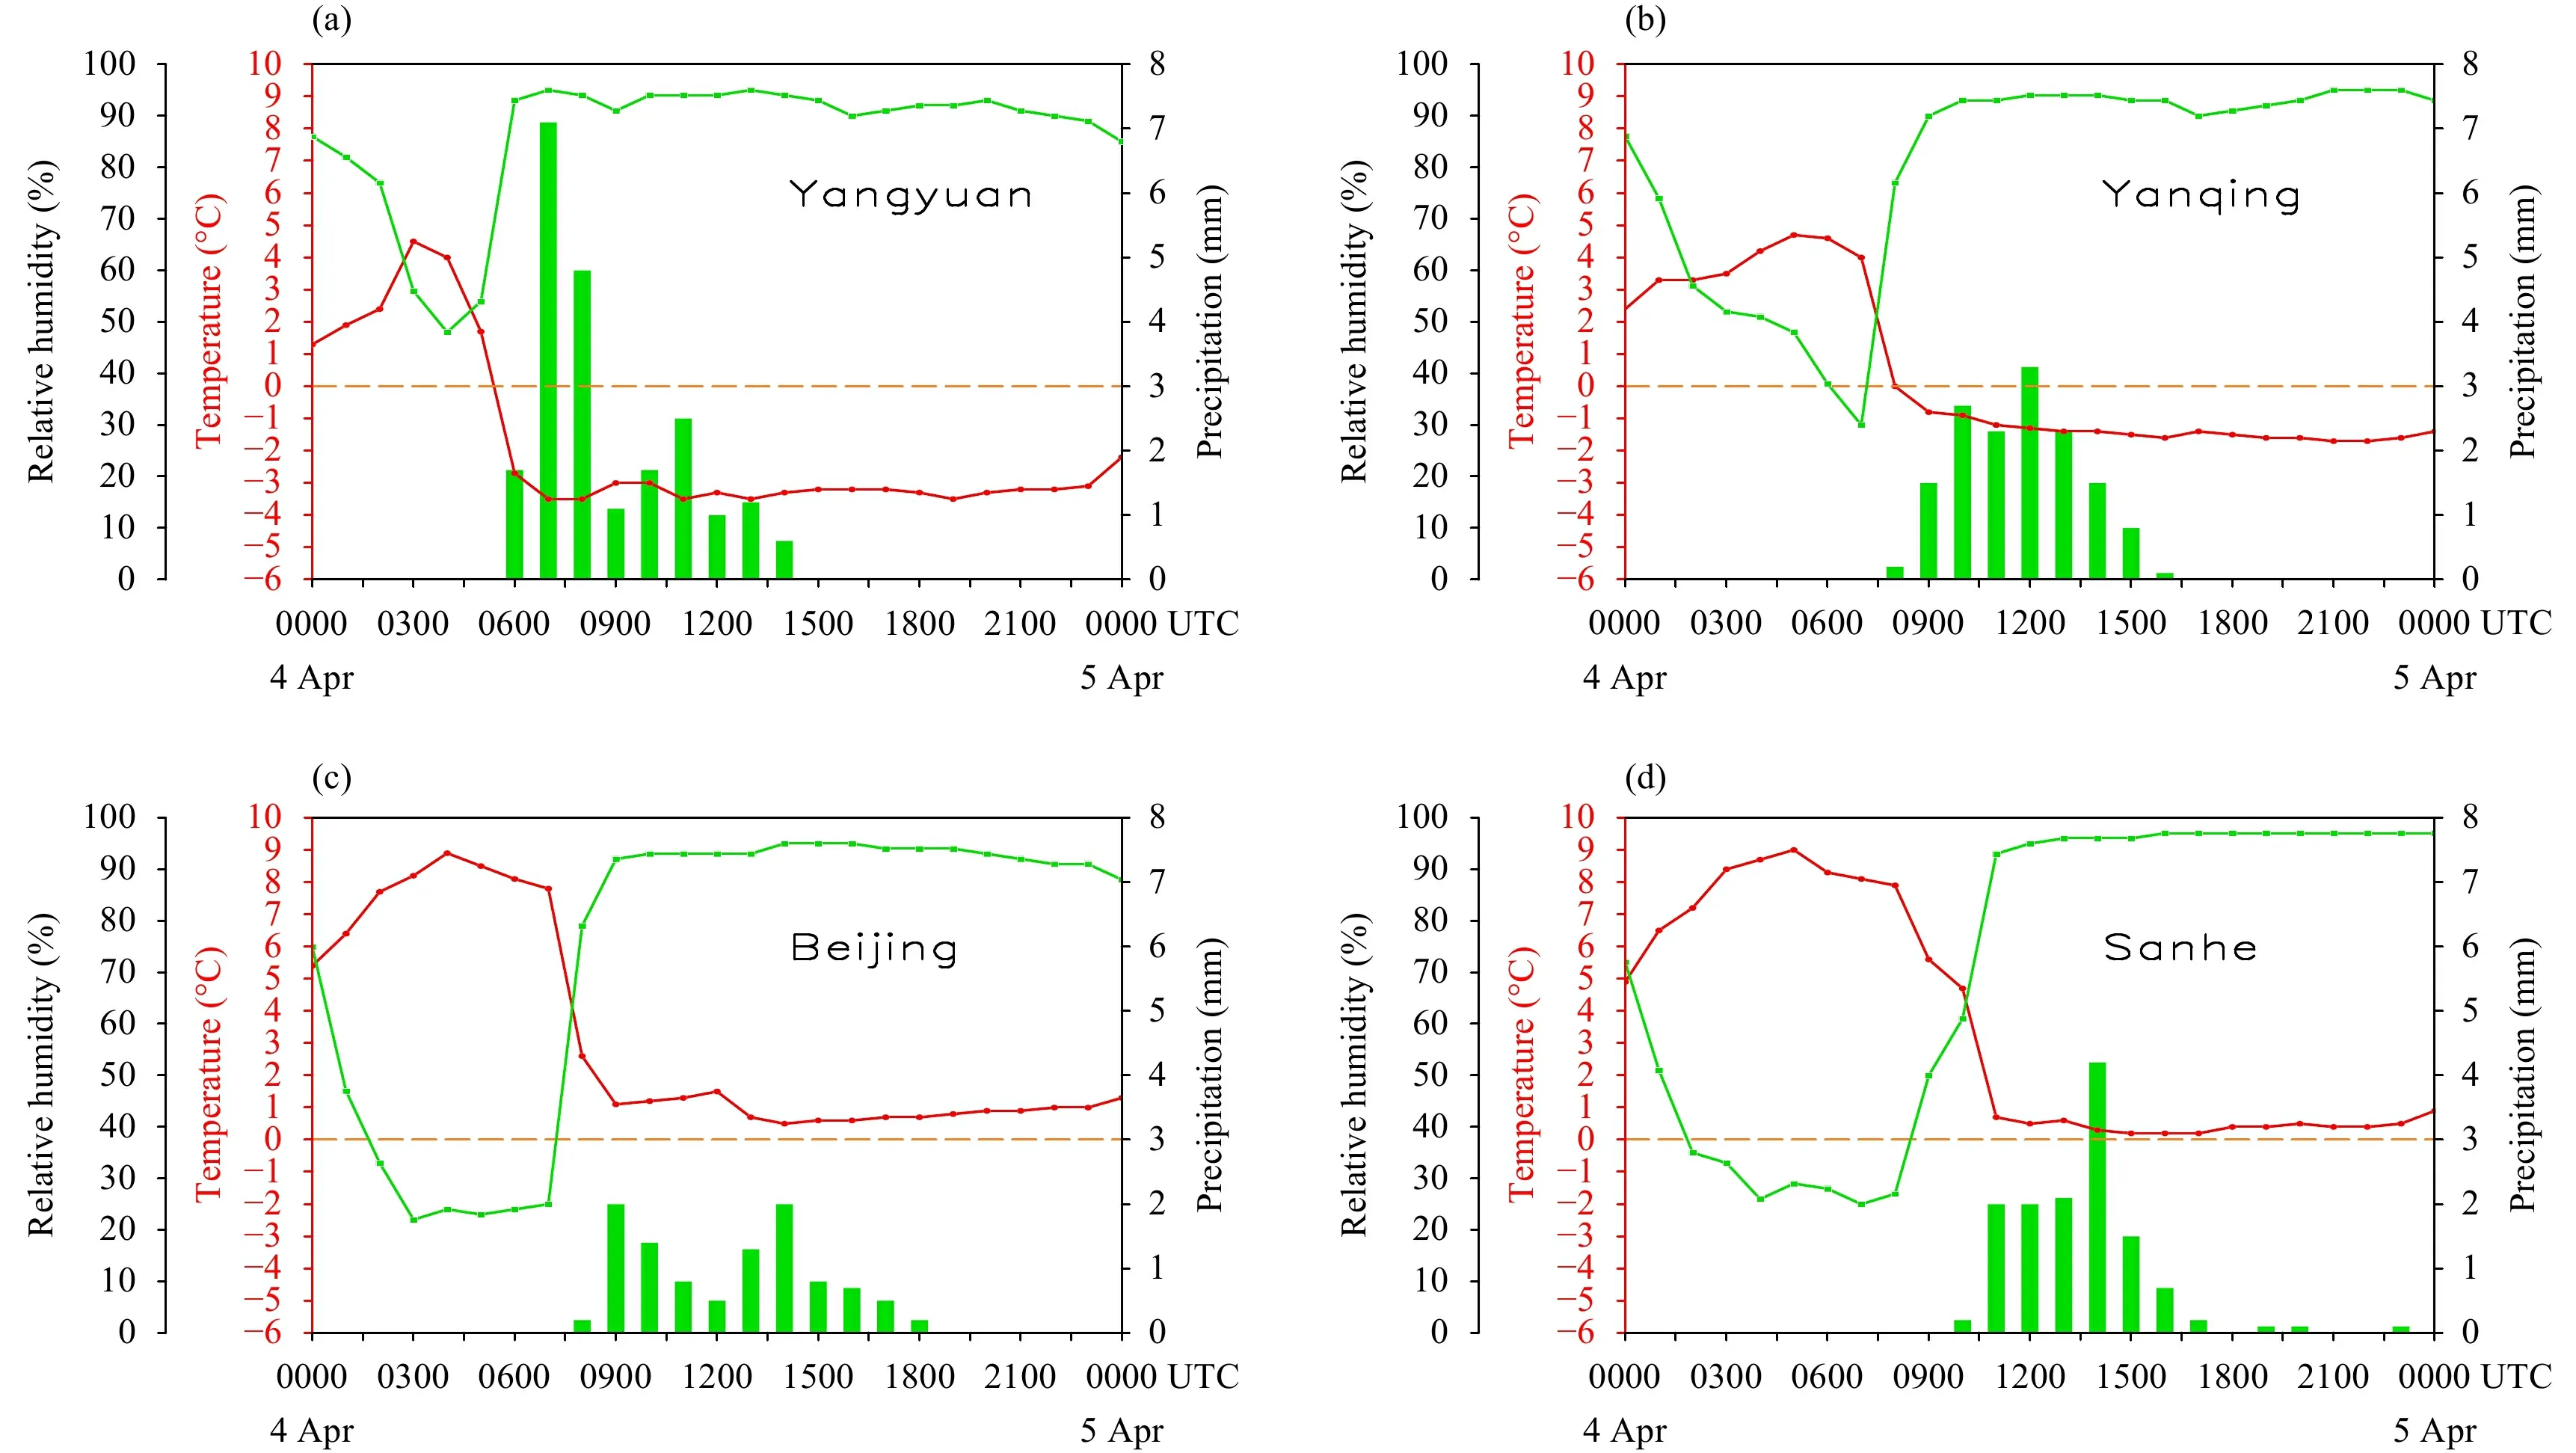
Fig. 2. Hourly evolution of the temperature (red line; °C), relative humidity (green line; %), and precipitation (green columns; mm) of the representative stations on 4 April 2018. (a) Yangyuan, (b) Yanqing, (c) Beijing, and (d) Sanhe.
3. Observational analysis of the circulation background
3.1 Important role of RF
At 0000 UTC 4 April 2018, the mid–high-latitude area of Asia was occupied by two troughs and one ridge at 500 hPa (Fig. 3a). The northwest flow in the rear area of the Siberia trough caused the polar cold air to intrude southward, strengthening both the middle-latitude front and the wind speed near 40°N. The low over the Okhotsk Sea extended southwest and formed a trough over Northeast China, accompanied by pronounced cold advection. A shortwave trough at 39°N and 103°E moved eastward and strengthened. Simultaneously, the Qinghai–Tibet Plateau trough moved eastward. The flows in front of these two troughs then linked meridionally and formed notable southwest winds at 30°–39°N, 105°–115°E.
At 850 hPa (Fig. 3b), the meridional features of the circulation became more obvious. A closed, high pressure center was formed at 35°–48°N, 114°–124°E. The northeasterly airflow to the east of the high pressure center forced the cold air from the Okhotsk Sea to flow southward and then to flow westward at 35°–40°N,which formed an RF situation. At 30°–50°N, 100°–110°E, there was a closed low pressure center, accompanied by significant warm advection in front of the low,which prompted frontogenesis over northwestern Hebei Province. At the surface (not shown), there was a boundary at 110°E. To the west of this boundary, there was an inverted trough at 25°–50°N, 100°–110°E, and Hebei Province was in front of the inverted trough in the direction of motion. To the east of the boundary, there was a high pressure center at 35°–50°N, 110°–130°E and a mesoscale high pressure center at the northern edge of Hebei Province, the latter of which caused the easterly RF to be more significant in northwestern Hebei Province.
3.2 Sounding features of the RF
With the help of observations from the sounding stations along the RF path, the characteristics of the RF can be further understood. Four representative stations were selected (Fig. 1b). Beijing Station (station number and altitude are the same as previously mentioned) represented the Beijing–Hebei plain area; Shenyang Station(54342, 49.5 m) represented the Northeast China Plain;Dalian Station (54662, 92.5 m) represented the junction area of the Northeast China Plain and Bohai Sea; and Zhangjiakou Station (54401, 725.6 m), which is located approximately 100 km north of Yangyuan Station, represented the area west of the Taihang Mountains in northwestern Hebei Province.
At 0000 UTC 4 April, as indicated by the sounding data from Shenyang Station (Fig. 4a), the RF was active mainly in the layer between 850 hPa and the surface. The speed of the northeasterly winds was 12–16 m s−1and reached the strength of the low-level jet. The difference between the air temperature and dewpoint temperature(DTTD) exceeded 20°C, indicating that the RF was very dry. The sounding data from Dalian Station exhibited similar characteristics (Fig. 4b). Although Dalian is very near the Bohai Sea, there was no increase in the relative humidity within the surface layer, suggesting that the RF occupied the northern coastal area of the Bohai Sea at 0000 UTC.
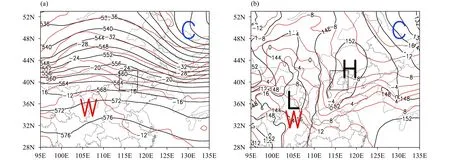
Fig. 3. Observed geopotential height (black solid contours; dagpm) and temperature (red contours; °C) at 0000 UTC 4 April at (a) 500 hPa and(b) 850 hPa. Letters “H” and “L” denote the centers of high geopotential height and low geopotential height, and “W” and “C” denote warm air and cold air, respectively.

Fig. 4. Soundings at 0000 UTC 4 April 2018, at (a) Shenyang (SY), (b) Dalian (DL), (c) Beijing (BJ), and (d) Zhangjiakou (ZJK). Letters“LCL” denote lifting condensation level.
The sounding data from Beijing Station at 0000 UTC(Fig. 4c) revealed easterly winds with speeds of 6–8 m s−1in the layer from the surface to 850 hPa. The near-surface layer DTTD was less than 5°C due to the humid easterly winds from 1000 hPa over the Bohai Sea, which is consistent with light fog observations. However, the 850–925-hPa layer was dry, and the DTTD was approximately 20°C, similar to that at Shenyang and Dalian stations. Therefore, the Beijing plain area might have been directly affected by the RF. Simultaneously, the sounding data from Zhangjiakou Station (Fig. 4d) showed that the 750–925-hPa layer was occupied by southeasterly winds with speeds of 2–10 m s−1, but its DTTD was less than 5°C, which is obviously different from the DTTD under the dry 925-hPa easterly winds in Beijing.Zhangjiakou Station was located at the western edge of the North China cold high, and thus affected by southeasterly winds in the western part of the anticyclonic circulation (Fig. 3b). However, due to its high altitude and the blocking effects of the Taihang and Yanshan Mountains (the main peak is greater than 1500 m), the Zhangjiakou area was not directly affected by the dry and cold RF from Northeast China.
The abovementioned analyses reveal that RF played an important role in the RRTS phase transition.However, similar to previous studies, due to the limitations imposed by the temporal and spatial resolutions of the observation data, it is impossible to obtain a clear physical image of the RF.
4. Numerical simulation and analysis of the causes of RRTS transitions
4.1 Configuration and verification
We employed version 3.5 of the Weather Research and Forecasting (WRF) model. The model configuration consisted of a two-way interactive domain with two levels of nesting comprising horizontal grid spacings of 9 and 3 km. The simulation adopted terrain-following coordinates, 50 vertical levels, and a top level at 50 hPa.The model physics employed in each domain included the Dudhia (1989) shortwave radiation scheme, Rapid Radiative Transfer Model (RRTM) longwave radiation scheme (Mlawer et al., 1997), WRF single-moment 5-class (WSM5) explicit microphysics scheme (Mielikainen et al., 2012), Yonsei University (YSU) planetary boundary layer scheme (Hong et al., 2006), and Noah land surface parameterization scheme (Chen and Dudhia, 2001).The Kain–Fritsch (KF) cumulus scheme (Kain and Fritsch, 1990) was utilized in the 9-km grid spacing domain, and no implicit cloud scheme was employed in the finest 3-km resolution domain. In addition, intensified,static, surface classification data from the Beijing–Hebei region were applied. The model integration was initialized at 0000 UTC 4 April 2018. The model first guess fields and 3-h interval lateral boundary conditions were obtained from the NCEP 1° × 1° global analysis.The data from automatic weather stations, radar reflectivity factors and radial wind data were assimilated through three-dimensional variational data assimilation (3DVAR)to form the initial fields. The simulation period covered 36 h, and the simulated data were output hourly.
A comparison between the simulated precipitation and the observed precipitation was performed. During the 0000–0600 UTC period on 4 April (Figs. 5a, d), representing the initial stage of snowfall in the Beijing–Hebei region, the distribution pattern and magnitude of the simulated 6-h cumulative precipitation were similar to those of the observed precipitation. The precipitation zone gradually moved from west to east and covered Yangyuan Station in Hebei Province with snowfall of approximately 4 mm. From 0600 to 1200 UTC (Figs. 5b, e), the main stage of snowfall, the simulated precipitation area continued to move eastward and was shaped like a pincer with a maximum magnitude of 16 mm, which was similar to the observed value. However, the simulated snowfall near Yanqing Station in northwest Beijing was smaller than the observed snowfall. Moreover, the significant simulated snowfall belt in northwestern Beijing occurred from 1200 to 1800 UTC (Figs. 5c, f), later than the observations. The simulated snowfall in southeastern Beijing was approximately 2 mm smaller than the observed snowfall. The comparison between the 24-h accumulated snowfall from 0000 UTC 4 to 0000 UTC 5 April(Figs. 5g, h) also indicates agreement between the simulated and observed distributions and magnitudes of precipitation. In addition, the simulated 500- and 850-hPa geopotential height fields, temperature fields, and wind fields were also consistent with the observations. Therefore, simulation data with a resolution of 3 km can be utilized to analyze the causes of RRTS transitions.
4.2 Characteristics of the RFs in the plain and mountainous areas
Due to the complex topography of North China, including the Bohai Sea, North China Plain, Yanshan Mountains, and Taihang Mountains, the RFs in North China may manifest in complex ways. Therefore, it is necessary to conduct a detailed analysis of the characteristics of RFs according to the different geopotential heights,different heavy snow locations, and different evolution stages.
4.2.1Cold–moist RF at 1000 hPa and cold–dry RF at 925 hPa in the Beijing–Hebei plain area
The Daxinganling Mountains in western Northeast China are oriented in a north–south direction with an average altitude of approximately 1300 m, and the Changbai Mountains in eastern Northeast China are oriented in a northeast–southwest direction with an average altitude of approximately 1400 m. The Northeast China Plain with an altitude of less than 200 m is located between these two mountain ranges, forming a narrow topographic channel conducive to the southward movement of cold air from the Okhotsk Sea surface high pressure system.At 0300 UTC 4 April (Fig. 6a), due to this topographic forcing, cold air flowed southward along this channel and behaved as northerly winds. After reaching the Bohai Sea, part of this air mass east of 120°E continued to flow southward, while part of the air mass west of 120°E became northeasterly winds that invaded the North China Plain, forming the abovementioned RF. At 0600 UTC(Fig. 6b), accompanying this change in the large-scale background circulation, part of the RF west of 118°E and north of 39°N transformed into southeasterly winds. The time of this change in wind direction corresponded to the beginning of the observed precipitation in the plain area.

Fig. 5. Comparisons of the cumulative precipitation (shaded; mm) between the (a, b, c, g) simulation and (d, e, f, h) observations. (a, d)0000–0600 UTC 4 April, (b, e) 0600–1200 UTC 4 April, (c, f) 1200–1800 UTC 4 April, and (g, h) 0000 UTC 4 to 0000 UTC 5 April.
In late spring, solar radiation is often strong. Due to the different physical properties of the sea and land, the land surface temperature increases abruptly in the afternoon, while the sea surface temperature increases slowly,forming a significant sea–land temperature difference in the near-surface layer. At 0600 UTC (Fig. 7a), a cold pool formed in the Bohai Sea at 1000 hPa, and the boundary of this cold pool was similar to the coastline of the Bohai Sea. The temperature at the cold pool center was 2°C, while the highest temperature on the North China Plain reached 7–8°C, so a strong temperature gradient appeared near the coastline. The Bohai Sea also corresponded to an area with high relative humidity.With the intrusion of dry and cold air at 0600 UTC, the relative humidity in the northern Bohai Sea dropped to 20%, whereas that in the central and southern Bohai Sea was maintained at 40%–60%, forming the cold–moist RF on the leeward side of the Bohai Sea. However, the cooling and humidifying effects of the Bohai Sea existed only in the relatively shallow near-surface layer. At 925 hPa(Fig. 7b), the Bohai Sea area was occupied by cold–dry northeasterly winds, and the temperature and relative humidity gradient belts corresponding to the oceanic boundaries basically disappeared. In addition, due to the low friction of the ocean surface, a low-level jet formed at 925 hPa over the Bohai Sea, facilitating wind speed convergence on the leeward side of the Bohai Sea.
The abovementioned analyses show that during the period from 0300 to 0600 UTC, the Beijing–Hebei plain area was affected by both a shallow cold–moist RF at 1000 hPa and a relatively deep dry–cold RF at 925 hPa.
4.2.2Cold–dry RF at 925 hPa in the northwest mountainous area of Beijing

Fig. 6. Wind fields at 1000 hPa (black streamlines) at (a) 0300 UTC 4 April and (b) 0600 UTC 4 April. The shaded background indicates the terrain, and the light blue infill denotes the ocean.

Fig. 7. Temperature (red contours; °C), relative humidity (shaded; %), and wind (vectors; m s−1) at 0600 UTC 4 April 2018, at (a) 1000 hPa and(b) 925 hPa.
From the simulated relative humidity and wind at 925 hPa, the RF exhibited significant dry characteristics. The main body of the RF corresponded well to the area with a relative humidity of 30% and below. Therefore, the 30%relative humidity contour was selected to track the RF activities. From 0300 to 0600 UTC, the RF advanced from the Bohai Sea to the Beijing plain area, and then gradually intruded the vicinity of Yanqing Station in the mountainous area of northwest Beijing. At 0300 UTC(Fig. 8a), the Beijing plain area was governed mainly by 40%–50% relative humidity. The 30% relative humidity zone invaded the southeast corner of Beijing (approximately 39.7°N, 116.75°E). At 0400 UTC (Fig. 8b), the 30% relative humidity boundary extended approximately 20 km westward and approximately 10 km northward in 1 h, reaching approximately 39.8°N, 116.45°E.At this time, the wind direction also changed from east to southeast. At 0500 UTC (Fig. 8c), most of Beijing was controlled by southeasterly winds, and the 30% relative humidity zone intruded approximately 20 km westward and 40 km northward in 1 h, reaching approximately 40.2°N, 116.25°E, indicating that the southeasterly winds had strengthened. Another notable feature at this time was the intrusion of the RF into the area near the front of the western valley. At 0600 UTC (Fig. 8d), most of the plain area was occupied by the RF. The 30% relative humidity zone intruded 20–30 km northwest in 1 h, reaching approximately 40.4°N, 116.1°E, and the RF intruded the valley near Yanqing Station. These analyses demonstrate that although the mountainous area of northwest Beijing has a higher altitude, owing to the intrusion of the RF along the valley, the snowfall in the mountainous area of northwest Beijing might have been directly affected by the cold–dry RF at 925 hPa.
4.2.3Cold–moist RF at 800 hPa in the northwest mountainous area of Hebei Province

Fig. 8. Simulated relative humidity (shaded; %), temperature (red contours; °C), and wind barbs (full barb is 4 m s−1) at 925 hPa at (a) 0300 UTC, (b) 0400 UTC, (c) 0500 UTC, and (d) 0600 UTC 4 April 2018. The thick black solid line is the contour line of the terrain height of 100 m.The black circle indicates the area around Yanqing Station.
Since the average altitude in the northwestern part of Hebei Province exceeds 1000 m, the northwest Hebei Province is affected predominantly by the circulation system above the 850-hPa layer. Therefore, the 800-hPa level was selected as the representative layer to investigate the characteristics of the near-surface layer and boundary layer in this region. At 0300 UTC (Fig. 9a), an anticyclonic circulation was centered at 800 hPa over the northeastern corner of the Beijing border (approximately 40°N, 117°E) with a radius of 500 km. This anticyclonic circulation was separated from the North China high (at 0000 UTC located at 35°–50°N, 115°–125°E). When cold air flowed southward, the southern part of the North China high strengthened due to the increased surface pressure. Controlled by this anticyclonic circulation, the cold–dry air from the northeast flowed southward, passed over the Bohai Sea, and then flowed westward at 36°–39°N, forming an RF. This RF showed cold and dry characteristics east of 115°E but cold and moist features near Yangyuan Station (39.5°N, 114°E). Note that the anticyclonic circulation affecting Yangyuan was very shallow. At 750 hPa (Fig. 9b), the anticyclonic circulation disappeared, and there were no easterly winds in the entire study area. The region within 112°–116°E was dominated by southerly winds, while that east of 116°E was dominated by northwesterly or southwesterly winds.Therefore, Yangyuan Station was also directly influenced by the RF at 800 hPa. However, this relatively shallow RF was cold and moist, and thus obviously differed from that over the Beijing–Hebei plain area and mountainous area of northwest Beijing.
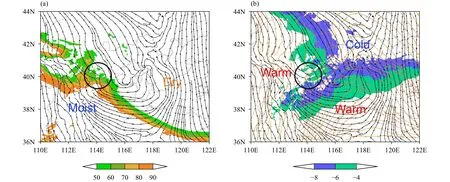
Fig. 9. Simulated (a) relative humidity (shaded; %) and wind (black streamlines) at 800 hPa and the simulated (b) temperature (shaded; °C) and wind at 800 hPa (black streamlines) and wind at 750 hPa (gold streamlines) at 0300 UTC 4 April. The black circle indicates the area around Yangyuan Station.
The characteristics of this RF have been debated in previous studies, in which some researchers considered it cold and moist, while others considered it cold and dry.However, from our abovementioned analyses, the RF features might have manifested differently in different geographical locations, at different terrain heights, and within different periods of snowfall. There was a cold–moist RF at 1000 hPa, a cold–dry RF at 925 hPa, and a cold–moist RF at 800 hPa, forming an interesting characteristic “sandwich” structure.
4.3 Characteristics of convergence, vertical motion, and water vapor transport
The location of heavy snow is closely related to the RF. Analyzing the characteristics of boundary layer convergence and vertical movement caused by the RF in different regions, as well as the characteristics of water vapor transport in this heavy snow process, can establish a foundation for further exploring the causes of heavy snow phase transitions.
4.3.1Plain and Yanqing mountainous areas of Beijing
At 0600 UTC (Fig. 10a), the Beijing plain area was controlled primarily by the easterly winds of the RF at 1000 hPa, and there was no obvious convergence zone in the plain area. At 925 hPa (Fig. 10b), similarly, there were no obvious convergence zones in the plain area or Yanqing mountainous area, which was occupied mainly by the southeasterly winds of RF. At 700 hPa, obvious southwesterly winds were roughly perpendicular to the specific humidity contours and temperature contours, indicating that the warm and humid airflow climbed along the cold–dry air cushion, and its water vapor transport capacity was strong. At 0800 UTC (Fig. 10c), at 1000 hPa, the Beijing plain area changed to be controlled by southeasterly winds, and an obvious convergence zone appeared over southeast Beijing. At 925 hPa (Fig. 10d),the southeasterly winds further strengthened and invaded along the valley to the western mountain area, where they formed an obvious convergence zone near Yanqing Station. The southerly component of the southwesterly winds at 700 hPa further strengthened, and the 3 g kg−1specific humidity contour moved northward to approximately 40°N, approximately 10–50 km within 3 h, which resulted in significant humidification in the plain area of southeastern Beijing.
The appearance of these strong convergence zones in the near-surface layer corresponded to the significant increase in snowfall observed in the Beijing plain area and Yanqing Station. The convergent upward motion of the near-surface layer caused by the RF, the climbing of warm–moist air along the cold–dry air cushion, and the vertical upward motion in front of the surface inverted trough combined to form relatively strong convective motions, which were beneficial to heavy snowfall over Beijing.
The height–time profile at Beijing Station (Fig. 11a)indicates that the easterly winds acted mainly below 850 hPa from 0300 to 0900 UTC. The convergence of the near-surface layer forced upward motions and formed a vertical speed center of 0.2 m s−1from 0600 to 0700 UTC at 1000–850 hPa. Warm–moist air climbed along cold–dry air in combination with the influence of the upper-level trough, forming a strong ascending center at 700–400 hPa from 0500 to 1100 UTC, which was conducive to the further development and maintenance of snowfall. The 700-hPa layer was very dry at 0300 UTC with a relative humidity of approximately 20%. However, by 0600 UTC, the relative humidity increased to 80%–90%, which corresponded to the transport of warm–moist air at 700 hPa and cloud formation due to convergent upward motion of the boundary level.

Fig. 10. Convergence (orange dashed contours with interval 10; 10−4 s−1) and wind (black streamlines) at 1000 hPa (left) and 925 hPa (right) at(a, b) 0600 UTC and (c, d) 0800 UTC 4 April. The plots are superimposed with the specific humidity (green contours; g kg−1) and wind at 700 hPa (blue streamlines). The black circles in (a) and (c) indicate the Beijing plain area, and the black circles in (b) and (d) indicate the area around Yanqing Station.
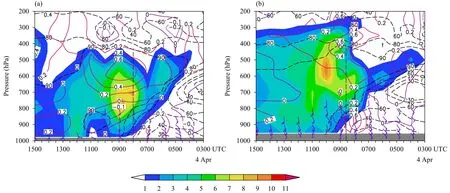
Fig. 11. Height–time cross-sections of cloud hydrometeor snow particles (shading; 10−1 g kg−1), upward vertical velocity (red solid contours; m s−1), and relative humidity (black dashed line; %) at representative stations on 4 April 2018. (a) Beijing Station and (b) Yanqing Station. The plots are superimposed with the easterly winds (wind barbs, a full barb is 4 m s−1). The gray area represents the terrain.
The height–time profile at Yanqing Station displays a wedge-shaped image (Fig. 11b), indicating that warm–moist air climbed along a cold–dry air cushion. The easterly winds acted mainly at 925–800 hPa above the terrain height and formed a convergence zone in the nearsurface layer. With the enhanced convergence, a relatively strong updraft center of 0.6 m s−1formed near 0800 UTC. Directly above the updraft center of the near-surface layer, there was another updraft center at 700–300 hPa created by the joint action of the climbing motion and upper-level trough, which made the cloud top reach 300 hPa, forcing the cloud body over Yanqing Station to become significantly higher than that over the plain area.This factor might have been one of the favorable factors for Yanqing Station to become the snowfall center in Beijing.
4.3.2Mountainous area of northwestern Hebei Province
At 0300 UTC (Fig. 12a), 800-hPa southeasterly winds invaded the mountainous area of northwestern Hebei Province and formed an obvious convergence zone near Yangyuan Station, which corresponded to a vertical velocity center with a vertical velocity of approximately 0.2–0.6 m s−1. Concurrently, 700-hPa southwesterly warm–humid airflow existed above the cold–moist air of the RF. At 0600 UTC (Fig. 12b), both the southeasterly winds of the RF and the wind convergence zone were enhanced at 800 hPa, corresponding to a more significant vertical velocity center near Yangyuan. Simultaneously,the 700-hPa warm–humid southwesterly airflow intensified, especially the 3 g kg−1specific humidity contour,which moved northward approximately 70 km from 39.7°N at 0300 UTC to 40.5°N, indicating that the snowfall area was supplied with sufficient water vapor.
The height–time profile at Yangyuan Station (Fig. 13)did not display an obvious wedge-shaped feature of ascending warm air. The southeasterly winds acted at 900–800 hPa from 0300 to 1200 UTC, corresponding to an area of 60%–80% relative humidity and a significant vertical velocity center with a maximum speed of 0.6 m s−1and forming a cold–humid cushion. Above the updraft center of the near-surface layer, there was a middle–high-level updraft center, which made the cloud top over Yangyuan Station exceed 300 hPa.
Yangyuan Station in Hebei Province is approximately 240 km west of Beijing Station, and the altitude is approximately 0.9 km higher. However, under the action of synoptic-scale circulation, the water vapor transport conditions and thermal dynamical uplift mechanism at Yangyuan were better than those of the Beijing plain area, which was conducive to Yangyuan Station becoming the precipitation center of this heavy snow event over the Beijing–Hebei region.
4.4 Diabatic cooling of cloud hydrometeors
In previous studies of precipitation phase transitions,conventional observation data or NCEP data were usually employed, and it was impossible to study diabatic processes such as the sublimation, melting, and evaporative cooling of cloud hydrometeor particles as they fell to the ground. However, our numerical simulation data provide an opportunity to further study the influence of diabatic cooling on the RRTS phase transition.
4.4.1Cloud hydrometeors and temperature changes in the middle and lower troposphere

Fig. 12. Convergence (shading; 10−4 s−1), upward vertical velocity (contours with 0.1 interval; m s−1), and wind (black streamlines) at 800 hPa at(a) 0300 UTC and (b) 0600 UTC 4 April 2018. The plots are superimposed with the specific humidity (green contours; g kg−1) and wind at 700 hPa (blue streamlines). The black circles in (a) and (b) indicate the area around Yangyuan Station.
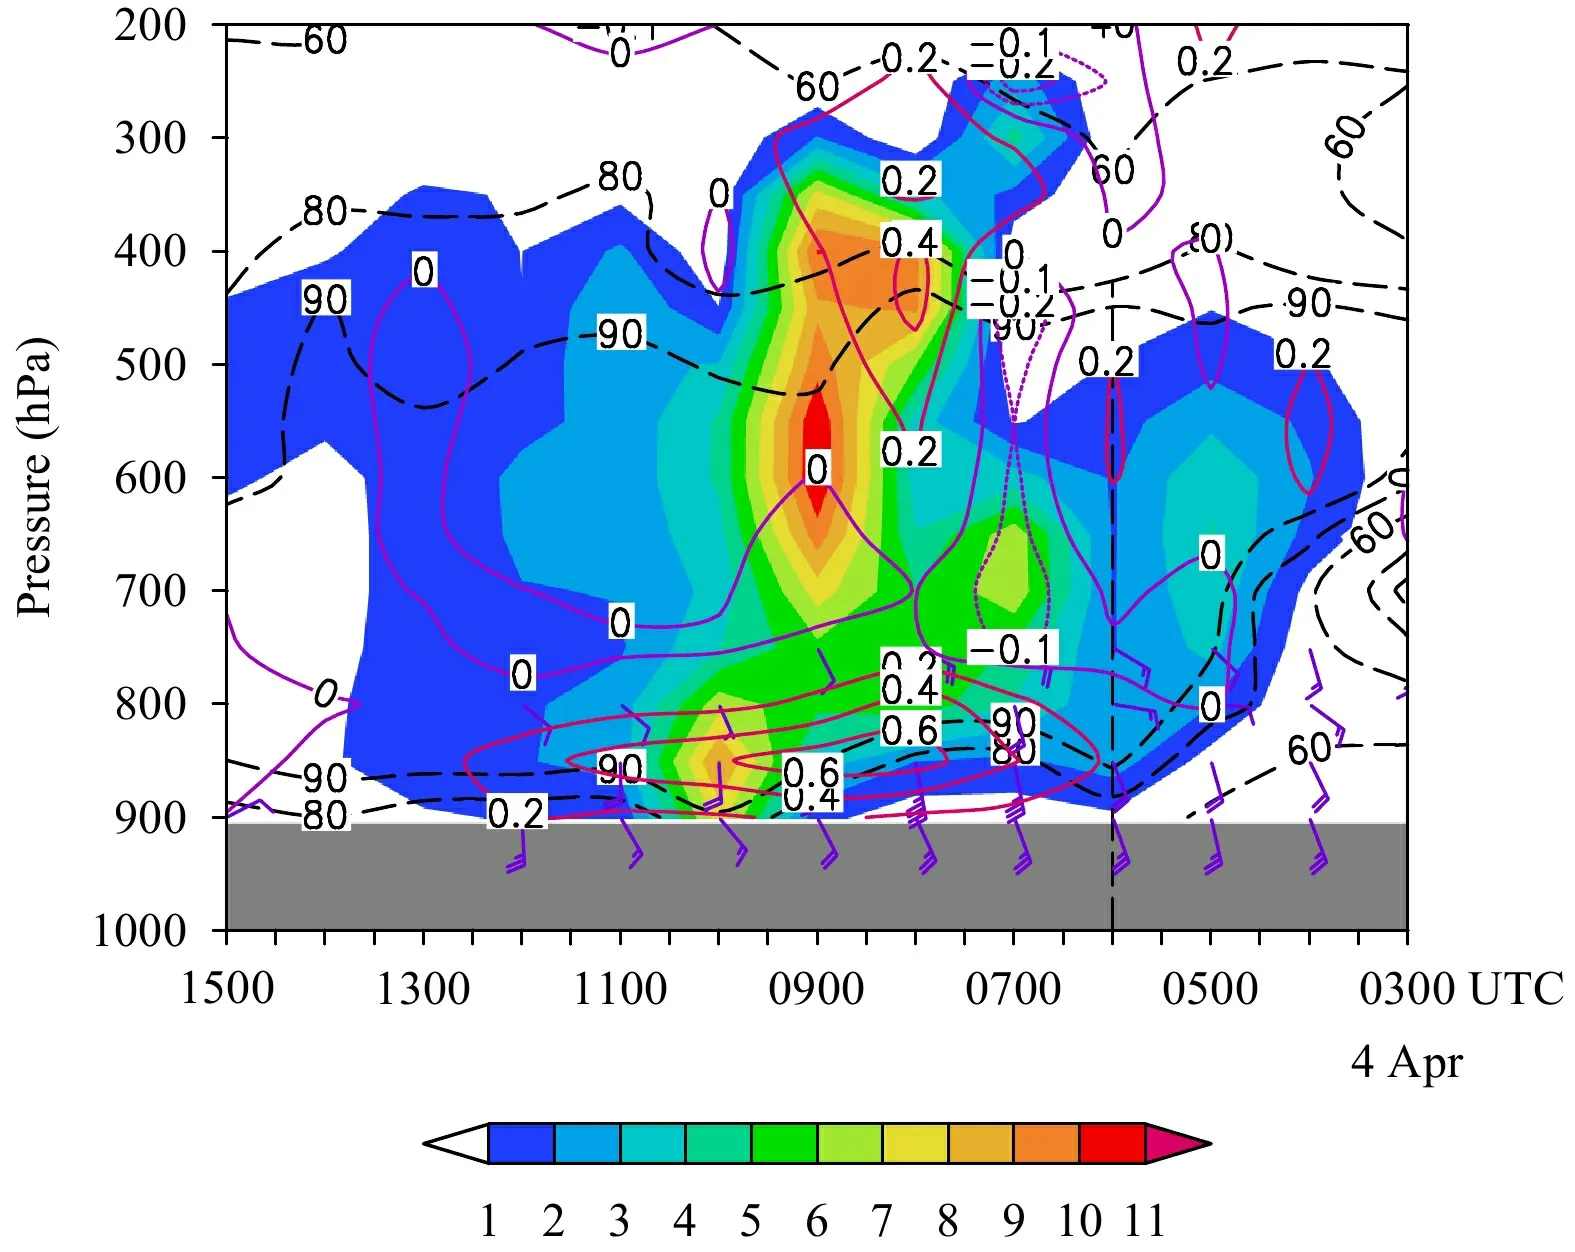
Fig. 13. As in Fig. 11, but for Yangyuan Station.
The cloud microphysical characteristics and atmospheric temperature from 700 hPa to the ground have a direct effect on the precipitation phase. If clouds are dominated by snow particles, when the surface temperature is 0–1.5°C, a mixture of rain and snow will occur; in contrast, if clouds are dominated by raindrops when the surface temperature is 0–1.5°C, rain will occur (Yuter et al., 2006). The 700-hPa level and the profile along 40°N were selected to investigate the influence of cloud hydrometeors on the RRTS phase transformation.
At 0300 UTC (Fig. 14a), the Beijing area and northwestern Hebei Province were occupied by temperature contours ranging from −2 to −4°C. Snow particles fell in a small area near the western boundary of Hebei Province. As indicated by the longitude–height cross-section (Fig. 14b), near the 700-hPa layer, a shallow warm layer existed at 114°–118°E due to the southwestward warm advection at 700 hPa. Simultaneously, in the plain area (116°–119°E), the temperature at 925 hPa was 0°C,while that at the surface was approximately 4°C; in the mountainous areas (114°–116°E), the surface layer was located at approximately 900 hPa, and the surface temperature was also approximately 4°C. At 0600 UTC, the cloud area at 700 hPa (Fig. 14c) intruded the vicinity of Yangyuan and southwestern Beijing. The area north of 39.1°N was dominated by snow particles with temperatures of approximately −4 to −6°C, and the area south of 39.1°N was dominated by raindrops with temperatures of approximately −2 to −4°C. As revealed by the longitude–height cross-section (Fig. 14d), the cloud area had not yet arrived over the plains by this time. Due to the intensity of solar radiation in late spring, the surface–900-hPa layer temperature at 116°–119°E increased by approximately 2°C, thereby exceeding 6°C. In the mountainous area(114°–116°E), the 900–600-hPa layer changed from a warm layer to a cold layer (with a minimum temperature of −8°C) due to the falling drag of snowfall particles, and the surface temperature dropped to approximately 0°C,which corresponded to the time when snowfall occurred.Unlike the upright cloud body near 114°N, the eastern boundary of the cloud body near 115.5°N sloped eastward, which corresponded to a significant gradient zone of dropping temperatures due to the sublimation-induced cooling of snow particles falling through the dry air layer.
In the subsequent 2-h interval, ending at 0800 UTC(Fig. 14e), at 700 hPa, the cloud area moved northeast to 118°E, and the cloud area north of 39.8°N was dominated by snow particles. The corresponding temperature was −6 to −8°C due to a drop of approximately 2°C compared to the temperature at 0600 UTC. The area south of 39.8°N was dominated by raindrops. In the longitude–height cross-section (Fig. 14f), the sloped boundary of snow particles shifted eastward to approximately 116°E and entered the transition zone between the mountainous area and plain area. The temperatures of the 1000–850-hPa layer near the sloped boundary were −6 to 4°C following a sharp drop of 2°C compared to the temperatures at 0600 UTC due to the sublimation-, melting-, and evaporation-induced cooling of snow particles during snowfall. At 1000 UTC (Fig. 14g) and at 700 hPa, the snow particle cloud area moved eastward to 120°E, while the area characterized by raindrops moved slightly northward. There was a significant cooling zone in the area 39°–41°N, 118°–120°E in front of the eastward-moving cloud area with temperatures approximately 2–4°C lower than those at 0800 UTC. In the longitude–height crosssection (Fig. 14h), the sloped boundary of snow particles continued to move eastward near 117°E, accompanied by a drastic gradient zone of decreasing temperatures. The surface temperature of the plain area (116°–117.5°E)west of the sloped boundary dropped near 0°C, which is consistent with the RRTS transition occurring from 0800 to 1000 UTC.
4.4.2Influence of the diabatic cooling of snow particles on the phase transition
The abovementioned analyses reveal significant differences in the temperature and humidity characteristics of the RFs that affected the plain area of Beijing, mountainous area of northwestern Beijing, and mountainous area of northwestern Hebei Province. Coupled with the influences of their different terrain altitudes, the diabatic cooling caused by snowfall might vary among these three regions. Therefore, the time–altitude profiles of the snow particles and temperature at the representative stations were utilized to further investigate the influence of diabatic cooling on the RRTS phase transition.

Fig. 14. Simulated cloud hydrometeor snow particles (shading; 10−1 g kg−1) and temperature (red contours; °C) at 700 hPa (left) and the longitude–height cross-sections (right) along 40°N at (a, b) 0300 UTC, (c, d) 0600 UTC, (e, f) 0800 UTC, and (g, h) 1000 UTC 4 April. The cloud hydrometeor raindrops (black contours; 10−2 g kg−1) are superimposed onto (a, c, e, g). The thick dashed straight lines in (d, f, h) indicate the sloped boundary of snow particles.
At Beijing Station, representing the plain area (Fig.15a), the eastern boundary of snow particles sloped eastward, and the temperature near the sloped boundary dropped significantly due to the diabatic cooling caused by the sublimation, melting, and evaporation of snow particles during snowfall. The 1000–900-hPa layer exhibited more melting (≥ 0°C) with a relative humidity of approximately 20%, which was conducive to meltingand evaporation-induced cooling, so there was a drastic temperature decrease of 4°C from 0600 to 0800 UTC in this melting layer. This simulated temperature decrease was consistent with the observed sharp temperature decrease in the stage near the beginning of snowfall at Beijing Station. From 0900 to 1500 UTC, the stage of persistent snowfall, since the surface–500-hPa layer was quasi-saturated and the surface temperature was near 0°C, the diabatic cooling effect basically dissipated, and the temperature changed only marginally.
The temperature drop near the sloped boundary at Yanqing Station (Fig. 15b) was similar to that at Beijing Station. However, Yanqing Station is situated at a higher altitude (approximately 500 m); therefore, the thickness of the surface–900-hPa melting layer was only half that over the plain area, and thus, the diabatic cooling produced by the melting layer was weaker. However, because Yanqing Station sits at a higher altitude and its latitude is approximately 0.5° farther north than Beijing Station, the −8°C isotherm of Yanqing Station extended downward to 850 hPa at 0800 UTC, and the distance from the surface to the −8°C isotherm was approximately 1000 m less than that at Beijing Station. Therefore,when snow particles fell from 850 hPa and passed through a relatively thin melting layer, the snow particles could not melt before reaching the surface, which caused the surface temperature to drop rapidly to nearly 0°C between 0800 and 0900 UTC, which is consistent with the observations.
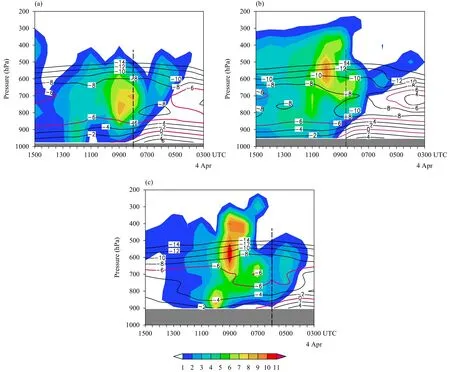
Fig. 15. Height–time cross-sections of cloud hydrometeor snow particles (shading; 10−1 g kg−1) and temperature (contours; °C) at representative stations on 4 April 2018. (a) Beijing Station, (b) Yanqing Station, and (c) Yangyuan Station. A gray profile signifying the terrain and dashed vertical lines indicating the onset of precipitation are superimposed onto the plots.
The RF at Yangyuan Station (Fig. 15c) in the mountainous area of northwestern Hebei Province was shallow with cold and moist characteristics, so the sublimation- and melting-induced cooling of snow particles was relatively weak. An obvious cold zone was located from 850 to 650 hPa from 0400 to 1300 UTC, with the cold center temperature reaching −6°C and the −4°C isotherm extending downward to 850 hPa. This cold zone corresponded to a vertically descending motion (Fig. 13). Simultaneously, the relative humidity of the cold zone was quasi-saturated (> 90%), so the cold zone was attributable primarily to snow particles dragging the cold air from 600 hPa downward to 850 hPa. Due to the relatively high altitude of Yangyuan Station (approximately 900 hPa), the near-surface, temperature change trend resembled that at an altitude of 850 hPa. The surface temperature gradually dropped from approximately 4°C at 0300 UTC to −2°C, which is consistent with the actual situation. Yangyuan Station’s rapid temperature decrease was directly related to the downward entrainment of middle-level, cold air by snow particles, which obviously differed from the rapid cooling mechanism in both the plain and the mountainous areas of Beijing.
In addition, compared to the situation at Beijing Station, the areas with many snow particles at both Yanqing Station and Yangyuan Station were located from 650 to 350 hPa, corresponding to temperature zones of −8 to−18°C. Because −12 to −18°C is considered the most suitable temperature for the formation of dendritic snowflakes (Auer and White, 1982), these temperatures might be an important reason for the larger amount of snowfall and larger snow depth at Yangyuan and Yanqing stations.
4.5 Influence of urbanization on the phase transition
Because of the intensive assimilation of automatic station data and the use of static surface classification data in the Beijing–Hebei region in the simulation, the influence of urbanization on the phase transition could be further investigated.
As shown in the height–time profile of the relative humidity at Sanhe Station in Hebei Province (Fig. 16a),from 0300 to 0900 UTC, the surface–850-hPa layer was dry with relative humidity ≤ 30%, accompanied by a 4–6 m s−1easterly wind. From 0300 to 0700 UTC, the 800–600-hPa layer was the middle–low-level dry area with relative humidity ≤ 30%, and the wedge-shaped feature of the cloud was obvious. A 90%–40% relative humidity gradient belt was detected at 0300–1000 UTC in the surface–500-hPa layer, forming a significant sloped dry–moist boundary. These features are consistent with those observed at Beijing Station. The simulated snowfall at Sanhe Station occurred at approximately 1000 UTC, approximately 2 h later than that at Beijing Station, which reasonably reflects the characteristics of the westward RF intrusion and the gradual eastward movement of the precipitation system in the plain area.

Fig. 16. Height–time cross-section at Sanhe Station of the (a) relative humidity (dashed contours; %) and wind (barbs, full barb is 4 m s−1) and(b) temperature (solid contours; °C). Cloud hydrometeor snow particles (shading; 10−1 g kg−1) are superimposed onto the plots, and the dashed vertical lines indicate the onset of precipitation.
As indicated by the temperature height–time profile at Sanhe Station (Fig. 16b), the overall characteristics of the temporal and spatial evolution of temperature were similar to those at Beijing Station. The 800–600-hPa layer behaved as a warm layer (−4 to −6°C) at 0300–0700 UTC but changed to a cold layer (−6 to −8°C) at 0800–1400 UTC. A drastic belt of decreasing temperatures accompanied the sloped dry–moist boundary. Between 1000 and 1500 UTC, the surface temperature remained at approximately 0°C. However, a significant difference in the temperature change rate between Sanhe Station and Beijing Station, especially the drop rate from 2 to 0°C,played a key role in the phase transition from rain to snow. At Sanhe Station, the surface temperature dropped from 6 to 0°C within 0900–1000 UTC; during this period, it took approximately 20 min for the temperature to drop from 2 to 0°C. Comparatively, at Beijing Station,the surface temperature dropped from 4 to 0°C within 0720–0930 UTC, and it took approximately 90 min for the temperature to drop from 2 to 0°C. Therefore, the development of urbanization has extended the duration of mixed rain and snow at Beijing Station, which reasonably reflects the observations. Further comparison shows that it took approximately 50 min for the temperature at Yanqing Station in Beijing to drop from 2 to 0°C and 1 h for the temperature at Yangyuan Station in Hebei Province’s mountainous area to drop from 2 to 0°C. The temperature drops at both of these stations were faster than those at Beijing Station.
5. Comprehensive discussion and conceptual diagrams
In this late spring heavy snow process over the Beijing–Hebei region, RF and water vapor transport at 700 hPa provided convergent uplift conditions and water vapor conditions, respectively. The RF, complex terrain,and snow particles dominating the clouds were the key factors for the RRTS phase transition. Furthermore, the RRTS mechanism in the northern part of the Taihang Mountains (the representative station is Yangyuan Station in Hebei Province), where the precipitation center was located, differed from that in the plain area (the representative station is Beijing Station).
Due to the temperature, humidity, and wind field structure characteristics of the synoptic-scale circulation system, the significant difference in the diurnal variation of the surface temperature between sea and land caused by strong solar radiation in late spring, and the significant height difference between the plain and mountainous areas, the RF affecting the Beijing–Hebei region presented a characteristic “sandwich” structure (Fig. 17a). The first layer was the shallow cold–moist RF blowing from the Bohai Sea to the Beijing–Hebei plain area at 1000 hPa, which was closely related to the strong differences in the surface temperature and humidity between the Bohai Sea and the North China Plain in late spring. The second layer was the thicker cold–dry RF at 925 hPa with a top level of 850 hPa; this RF mainly affected the plain area of Beijing and the Yanqing mountainous area in northwestern Beijing. The third layer was the cold–moist RF near 800 hPa related to cold air moving southward to 35°N and then returning to the northern part of the Taihang Mountains; this RF, which was also relatively shallow and affected mainly the northern part of the Taihang Mountains, was controlled by the 800-hPa anticyclonic circulation centered at 40°N, 117°E with a radius of about 500 km.
The RRTS transition in the plain area was directly related to the cold–dry RF at 925 hPa (Fig. 17b). The first role of the RF was the cold advection effect, which occurred approximately 4–6 h before the onset of snowfall,thereby offsetting and weakening the rapid temperature increase around noon due to the strong intensity of solar radiation in late spring. Thus, the surface temperature was maintained at 6–9°C before the occurrence of precipitation, which was approximately 10°C lower than the temperature on the same date in a normal year. The second role was the diabatic cooling effect, which occurred 1–2 h before and after the onset of precipitation.When snow particles fell through the deep dry layer, sublimation-, melting-, and evaporation-induced cooling occurred, causing the surface temperature to further drop by 4–6°C to nearly 0°C. The RF at 1000 hPa mainly enhanced the near-surface advection cooling in the plain area and supported the convergent ascension and transport of water vapor.
The RRTS transition in the northern part of the Taihang Mountains was attributed to both the relatively high altitude and the RF at 800 hPa. Because the thickness of the 800-hPa RF was relatively shallow and its cold air was weak, advection-, sublimation-, melting-,and evaporation-induced cooling had relatively small effects on the phase transition (Fig. 17c). However, due to the high altitude and the weakening effect of the RF on solar radiation warming, the surface temperature was maintained at 4–6°C before the onset of snowfall. In the period near the onset of snowfall, falling snow particles in clouds dragged the −4°C isotherm downward from 600 hPa to approximately 850 hPa. Due to the high altitude, the melting layer from the surface to the 0°C isotherm became very thin, so the snow particles had insufficient time to melt before falling to the ground, and thus,the RRTS transition occurred. Compared with the plain area, the mountainous areas with higher altitudes were more prone to RRTS transitions or snowfall for the same weather system background. In addition, the RF at 800 hPa also played roles in both boundary layer convergent ascension and water vapor transport.
6. Conclusions

Fig. 17. Conceptual diagrams of the mechanism responsible for the heavy snow process. (a) “Sandwich” structure of the RFs and water vapor transport at 700 hPa (shading indicates the terrain); “H1” and “H2” represent the locations of the high pressure centers at 850 and 800 hPa, respectively; WM indicates the warm–moist advection; RF indicates the return flow; and the gray rectangular box indicates the Taihang Mountains area. (b) The RRTS mechanism in the plains (shading signifies snow particle-dominated clouds; red contours indicate the temperature; asterisks indicate snow particles; thick dashed lines indicate the temperature on the same date in a normal year; yellow shading indicates the RF; and two straight vertical lines delineate the period in which the near-surface temperature sharply declined). (c) The RRTS mechanism in the mountainous area of Hebei Province [the arrows indicate falling snow entraining middle-level cold air downward, while the gray area represents the mountainous terrain; the other features are the same as those in (b)].
The phase changes in the precipitation processes of early winter and late spring in midlatitude regions constitute challenges for forecasting the timing and magnitude of snowfall. On 4 April 2018, a heavy snow process occurred in Beijing and northwestern Hebei Province, becoming the most delayed occurrence of spring heavy snow ever recorded over Beijing in the last 30 years.Forecasters considered this precipitation process to include both a longer rain stage and a longer rain–snow transition stage owing to the occurrence of this event in late spring. However, the actual process was dominated by snow, resulting in obvious disagreement regarding the occurrence time and amount of snow between the observations and the forecast. In this paper, the causes of the RRTS transition in this late spring heavy snow were investigated comprehensively by using observational and numerical simulation data. The main conclusions are presented as follows:
(1) The RF played an important role in this heavy snow process and presented a characteristic “sandwich”structure, which is different from the previous understanding of RFs. The first layer was the shallow cold–moist RF blowing from the Bohai Sea to the Beijing–Hebei plain area at 1000 hPa. The second layer was a thicker cold–dry RF at 925 hPa with a top level of 850 hPa; this RF mainly affected the plain area of Beijing and the Yanqing mountainous area in northwestern Beijing. The third layer was the cold–moist RF near 800 hPa, which was also relatively shallow and affected mainly the northern part of the Taihang Mountains.
(2) The RFs and water vapor transport at 700 hPa provided favorable conditions for convergent ascension and water vapor transport, and thus, the generation of heavy snow. The RFs, complex topography, and snow particles, which dominated the clouds, were the three key factors for the RRTS transition. The RRTS mechanism in the northern part of the Taihang Mountains differed from that in the plain area with an altitude near sea level.
(3) The RRTS mechanism in the plain area was directly related to the RF at 925 hPa. The first role of the RF was the cold advection effect, which occurred approximately 4–6 h before the onset of snowfall. The second role was the diabatic cooling effect, which occurred 1–2 h before and after the onset of precipitation.
(4) The RRTS mechanism in the northern part of the Taihang Mountains was closely related to the relatively high altitude, which led to a lower surface temperature owing to the vertical temperature lapse rate. Immediately before and after the onset of precipitation, snow particles in the clouds entrained the cold air in the middle layer downward, causing the melting layer (from the surface to the 0°C isotherm) to become very thin, and thus,the snow particles did not have adequate time to melt before falling to the ground.
(5) The Yanqing mountainous area in Beijing could have the characteristics of both the plain and mountainous area mechanisms: the advective cooling of RF, melting cooling of snow particles, and higher altitude worked concurrently for the RRTS. Compared with that in the plain area with less urbanization, the duration of the transition from rain to snow was extended by approximately 2 h in the plain area with significant urbanization.
In future work, the relative contributions of the sublimation-, melting-, and evaporation-induced cooling of cloud snow particles need to be further investigated.
Acknowledgments.The authors benefited from the discussion with Junhong Fan at the Key Laboratory of Meteorology and Ecological Environment of Hebei Province.
 Journal of Meteorological Research2022年1期
- Journal of Meteorological Research的其它文章
- A Possible Dynamic Mechanism for Rapid Production of the Extreme Hourly Rainfall in Zhengzhou City on 20 July 2021
- Diagnosing the Dynamic and Thermodynamic Effects for the Exceptional 2020 Summer Rainy Season in the Yangtze River Valley
- Estimation of Chlorophyll-a Concentration in Lake Taihu from Gaofen-1 Wide-Fieldof-View Data through a Machine Learning Trained Algorithm
- Southwesterly Water Vapor Transport Induced by Tropical Cyclones over the Bay of Bengal during the South Asian Monsoon Transition Period
- Energetics of Boreal Wintertime Blocking Highs around the Ural Mountains
- Potential Impact of Tonga Volcano Eruption on Global Mean Surface Air Temperature