
Diagnosing the Dynamic and Thermodynamic Effects for the Exceptional 2020 Summer Rainy Season in the Yangtze River Valley
2022-03-12 07:45NaWENShujieLIUandLaurentLI
Na WEN, Shujie LIU, and Laurent Z. X. LI
1 College of Atmospheric Sciences, Nanjing University of Information Science &Technology, Nanjing 210044, China
2 Key Laboratory of Meteorological Disaster of Ministry of Education, Nanjing University of Information Science &Technology, Nanjing 210044, China
3 Qingdao Engineering Technology Research Center for Meteorological Disaster Prevention,Qingdao Meteorological Bureau, Qingdao 266003, China
4 Laboratoire de Météorologie Dynamique, Centre National de la Recherche Scientifique, Sorbonne Université,Ecole Normale Supérieure, Ecole Polytechnique, Paris 75252, France
ABSTRACT
Key words: exceptional rainfall, Yangtze River valley, global warming, dynamic and thermodynamic effects
1. Introduction
The East Asian summer monsoon rainfall along a front extending from the mid–lower reaches of the Yangtze River valley (YRV), China to Japan was particularly strong in June–July 2020, causing disastrous floods in both eastern China and Japan. By its intensity and persistency, the rainy season in June–July 2020 was the strongest one since the last decades, and it attracted large public awareness and media attention. Qualified as super-Meiyu (plum rain), the 2020 rainy season also stimulates scientific interests (Chen et al., 2020; Liu et al.,2020; Zhang et al., 2020). An important question arises on the causality of this event, in particular, its relation and potential attribution to the anthropogenic warming of global climate.
Many studies have shown that the intensification of regional precipitation can be a response to global climate warming (Katz and Brown, 1992; Kundzewicz, 2005; IPCC, 2013). In fact, a warmer atmosphere is more likely to hold more water vapor, which creates the necessary condition for the water cycle to be intensified (Su et al.,2008; Ye and Qian, 2021).
However, the response of regional atmospheric circulation may also increase precipitation anomalies (Huang and Huang, 2012; Chen and Zhai, 2014, 2015, 2016; Si et al., 2016; Takaya et al., 2020), and most of these atmospheric conditions favorable for a wet YRV have their origin in relation to tropical ocean conditions (Wang et al., 2000, 2017; Wang and Zhang, 2002; Yang et al.,2007; Xie et al., 2009; Rong et al., 2010; Wen et al.,2015, 2019, 2020; Zhao et al., 2019). It is widely recognized that the years with heavy precipitation in the YRV in the past were mostly during strong El Niño decaying summer, such as 1983, 1998, and 2016 (Kane, 1999;Zhai et al., 2016; Bi et al., 2017; Wang et al., 2017). But El Niño in 2019/2020 was not strong. Why is there such an exceptional rainy season in the YRV in a weak El Niño decaying summer? It is necessary to understand the driving process of this exceptional precipitation and its any potential link to climate warming.
A few studies on the 2020 super-Meiyu have been reported in the paper, but most of them were limited to a qualitative inspection on atmospheric circulation, water vapor transport (Wang et al., 2021), and sea surface temperature (SST). There is a general lack of quantitative assessment of the relevant dynamic and thermodynamic effects on this event. However, a fruitful method of precipitation event attribution is often used to separate the dynamic and thermodynamic contributions (Trenberth et al., 2015; Shepherd, 2016; Oueslati et al., 2019). It is based on the moisture budget analysis to realize the attribution of the precipitation anomalies, as practiced in Chou et al. (2013a) and Oueslati et al. (2019). The moist static energy (MSE) equation is an effective tool for diagnosing vertical velocity and quantifying the influence or contribution of atmospheric humidity, temperature, largescale circulation, and radiation (Neelin, 2007; Chou et al., 2013b; Chen and Bordoni, 2014). It is also widely used in various applications to understand regional climate variation in China for future evolution (Yao et al.,2017), El Niño events (Liu et al., 2021), and paleoclimate (Sun et al., 2016, 2018). Thus, in this study, we use moisture and MSE diagnostic equations to quantify the contribution of dynamic and thermodynamic processes to the exceptional rainfall in the mid–lower reaches of YRV.
The remaining of the paper is organized as follows.Section 2 introduces the observational and reanalysis datasets, and analysis methods. Section 3 presents the dynamic and thermodynamic processes in controlling the budget equations of moisture and MSE, which can help us to understand the underlying physical mechanisms leading to the exceptional rainfall in the mid–lower reaches of YRV in 2020. Section 4 summarizes a few major conclusions and discussion on the potential role of global warming for this case of summer 2020.
2. Data and method
2.1 Data
Multiple datasets are used in this study from June to July 2020. The monthly precipitation data of 160 weather stations are obtained from the National Climate Center,China Meteorological Administration (CMA). The study area is east of 100°E and focuses on the YRV (33 stations included). Monthly variables, including atmospheric wind, temperature, humidity, evaporation, geopotential height, and surface heat fluxes, are from the Japanese 55-yr Reanalysis (JRA-55; Ebita et al., 2011) with a 1.25° ×1.25° horizontal resolution. Anomalies of all variables are obtained after removing their 30-yr means of 1981–2010.
Our analysis methodology is identical to what described in Liu et al. (2021). It is based on the moisture budget equation for diagnosing precipitation anomalies and on the MSE budget equation for diagnosing anomalies in vertical motion.
2.2 Moisture budget analysis
The budget equation controlling the moisture variation for a tropospheric air column, in its vertically-integrated form, can be expressed as:


2.3 Moist static energy budget analysis
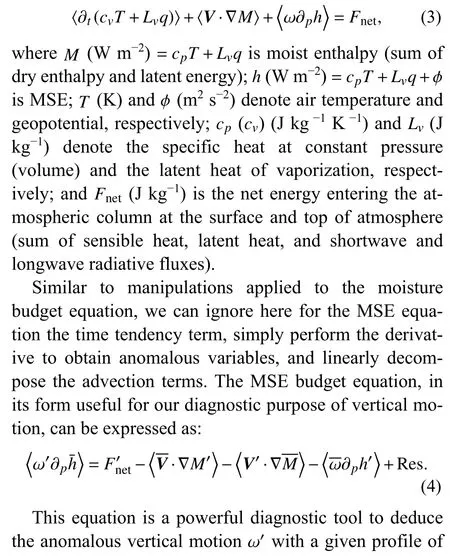
Due to the fact that water vapor decreases rapidly with altitude, creating a remarkable vertical gradient, the vertical advection term in the moisture budget equation is the most important one in controlling changes of precipitation. The conservation of MSE in the atmosphere allows us to have a powerful tool to constrain anomalous vertical motions. The MSE budget equation can be written as:

3. Results
3.1 Moisture budget analysis
Firstly, we assess the different terms of the moisture budget equation [Eq. (2)] to show their anomalies in the mid–lower reaches of YRV in 2020. Our goal is to decompose local changes of precipitation into changes in atmospheric water vapor and changes in atmospheric circulation, and ultimately to assess the physical drivers of this exceptional rainy season. Results from the moisture budget analysis [Eq. (2)] are shown in Fig. 1 for areal averages in the domain 27°–34°N, 107°–122°E and in Fig.2 for geographic distribution. The evaporation term(−0.33 mm day−1) contributes negatively to the anomalous precipitation (3.93 mm day−1). It is an unusual situation that we observe negative local feedback between the evaporation and precipitation, certainly due to the particular conditions in the region with soil moisture already saturated and reduced available solar radiation energy for evaporation (or more precisely, evapotranspiration) to occur with rainfall and cloudiness. It is also to be noted that the residual term, for a value of −1.65 mm day−1, is larger than expected. The explanation resides in the fact that the whole period of June and July 2020 is not a continuous one, but filled with several intra-seasonal oscillatory weather systems (Ding et al., 2021). At the present stage, we believe that the other linearly-decomposed terms are not fundamentally impacted, especially for our purpose of investigating their relative proportionality.
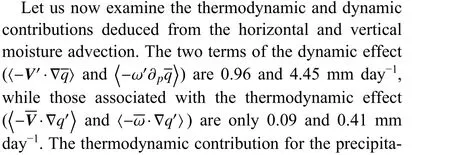

Fig. 1. Monthly-mean anomalies of moisture budget (mm day−1) for June–July 2020 averaged over the YRV (27°–34°N, 107°–122°E) as indicated by the black box in Fig. 2a.


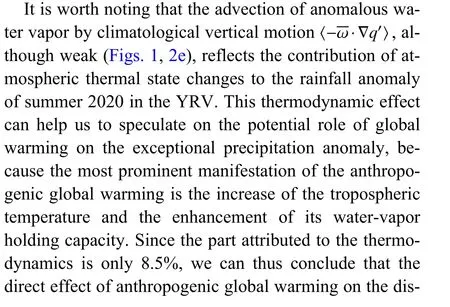

Fig. 2. Spatial distributions of each term (as indicated in the upper-right corner of each panel) of the moisture budget equation during June–July 2020. (a) Precipitation anomalies over East China, (b) evaporation anomaly, (c) horizontal advection of anomalous moisture by climatological wind, (d) horizontal advection of climatological moisture by anomalous wind, and (e) and (f) as in (c) and (d), but for vertical advection.
3.2 MSE budget analysis
It is clear that the advection of mean humidity by anomalous vertical motion is the most important term of dynamic effect leading to rainfall anomaly in the YRV in June–July 2020. As a diagnostic tool, the MSE budget analysis can help to understand how anomalous vertical motion is created and maintained. We can decompose it into a part depending on the thermal state of the atmosphere and another part depending on the atmospheric circulation. The thermodynamic component is a surrogate of the contribution of atmospheric thermal state changes to vertical motion anomalies. Similar to the thermodynamic effect of the water vapor budget analysis, we can use the MSE thermodynamic component to analyze the potential role of global warming to vertical motion anomalies. It can be compared to the dynamic effect related to changes of horizontal wind divergences.
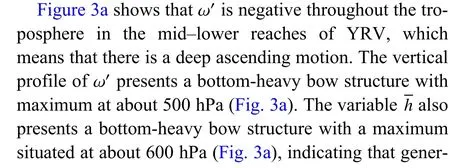

Fig. 3. Vertical profiles of (a) anomalous vertical velocity ω′ (blue line; 10−2 Pa s−1) and climatological MSE h (red line; 103 J kg−1), and (b) climatological vertical velocity ω (blue line; 10−2 Pa s−1), anomalous MSE h' (red solid line; 103 J kg−1), anomalous enthalpy cpT' (red dashed line;103 J kg−1), anomalous latent energy Lvq′ (red short dashed line; 103 J kg−1), and anomalous geopotential gz′ (red dotted line; 103 J kg−1) averaged over the YRV (black rectangle in Fig. 2a) during June–July 2020.


In general, from each term in MSE budget, the circulation anomaly is still a key factor affecting the exceptional rainfall in the YRV during the Meiyu period in 2020.However, the positive contribution of thermodynamic effect cannot be ignored. In other words, feedbacks between the atmospheric dynamics and thermodynamics can exert obvious indirect effects on the exceptional precipitation of 2020 summer in the YRV.
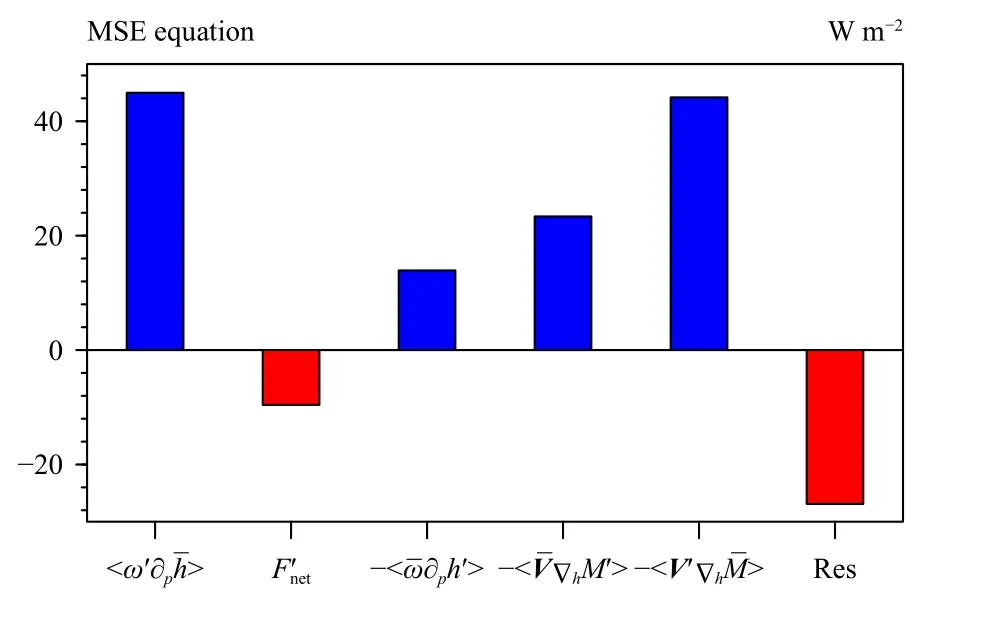
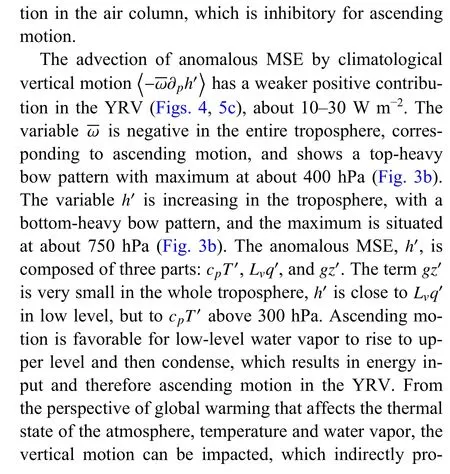
Fig. 4. Different terms of the MSE budget (W m−2) averaged over the YRV.

Fig. 5. Spatial distributions of each term of the MSE budget equation during June–July 2020. Panels (a) and (b) show the anomalous vertical advection decomposed into anomalous vertical motion and anomalous MSE. Panels (c) and (d) are similar to (a) and (b), but for the anomalous horizontal advection (for which moist enthalpy replaces MSE in the calculation). Panel (e) is the net energy flux (at surface and top of atmosphere)into the atmospheric column.
3.2.1Dynamic effect


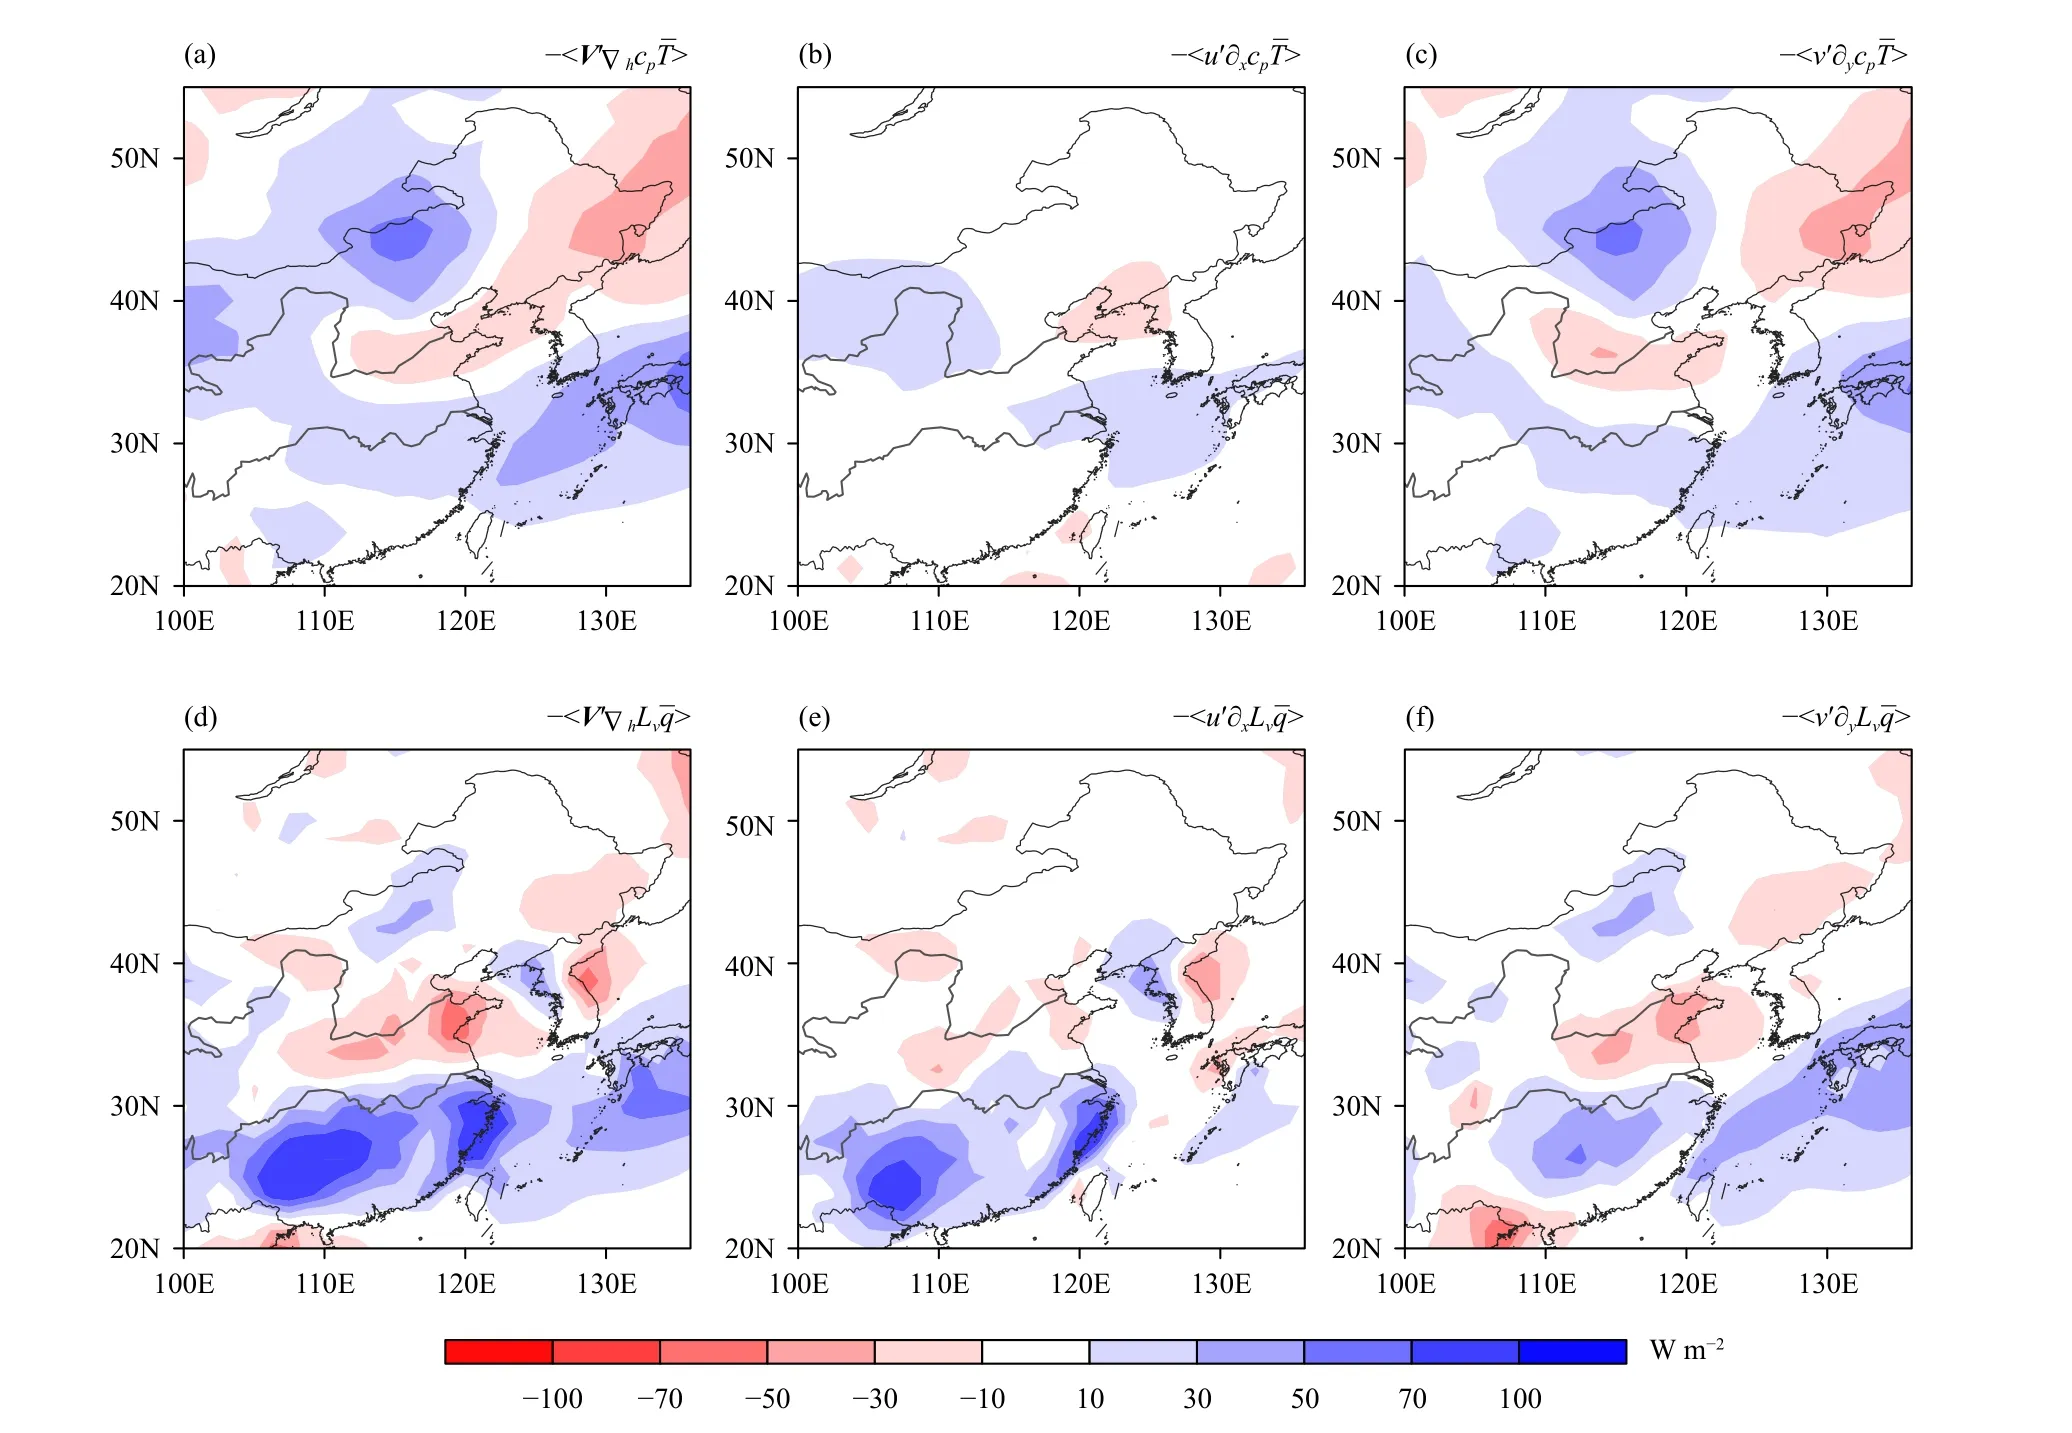
Fig. 6. Horizontal advection of (a–c) climatological dry enthalpy and (d–f) latent energy by anomalous wind, designated as dynamic effect during June–July 2020. (a, d) Total advection, (b, e) zonal component, and (c, f) meridional component.

Fig. 7. As in Fig. 6, but for the thermodynamic effect (horizontal advection of anomalous dry enthalpy and latent energy by climatological wind) during June–July 2020.


Fig. 8. Mean anomalies for June–July 2020 of GPCP (Global Precipitation Climatology Project) precipitation (shading; mm day−1), vertically-integrated (1000–500 hPa) specific humidity (contour; g kg−1),and wind (vector; m s−1).
Figures 7b and 7c show the decomposed zonal and meridional components of the total advection of anomalous dry enthalpy by climatological wind. Both components have weak contributions, with the zonal one slightly larger. The zonal southwest wind transports warmer air to this area, causing energy gain and promoting ascent motion.
In short, the abnormal precipitation over the YRV changes the moisture conditions of its local underlying surface. Through the transport of anomalous water vapor by southwesterly wind, it leads to the net moist enthalpy into the YRV, and as a result it reinforces the original precipitation anomaly. This forms a positive feedback process, which could further amplify the effect of the atmospheric thermal state (water vapor) on the exceptional case of 2020 precipitation in the YRV.
4. Summary and discussion
This study analyzed the dynamic and thermodynamic processes controlling the exceptional rainy season in the mid–lower reaches of YRV in June–July 2020. Our diagnostics explored the budget equation of moisture and MSE. The dynamic processes are those related to changes of atmospheric circulation, while the thermodynamic processes are related to the thermal state (consequently the water vapor content) of the atmosphere.Such a decomposition allows us to have a better understanding of the underlying mechanisms that lead to rainfall anomalies. The thermodynamic effect, in particular,can be used to make a few speculations for the potential role of global warming in the exceptional precipitation anomalies in summer 2020. Actually, the most prominent manifestation of the anthropogenic global warming is the increase of the tropospheric temperature and the enhancement of its water-vapor holding capacity.
From the moisture budget equation analysis, we can conclude that the precipitation anomaly of summer 2020 was mainly controlled by the dynamic term in reference to the advection of climatological water vapor by anomalous vertical motion. However, the positive contribution of the thermodynamic term, which is the advection of abnormal water vapor by climatological vertical motion, was only 8.5% of the total effect. That is, the exceptional 2020 rainy season in the YRV was mainly caused by atmospheric circulation anomalies. It can be hardly explained by the argument in relation to global warming.Our analysis does not fully support the intuitive argument saying that “the global warming enhances water vapor content in the atmosphere, which enhances the amount of rainfall.” Such a statement would be very partial in the case of the exceptional 2020 rainy season,since the direct effect of water vapor enhancement did not exceed 8.5%.
Further MSE analysis indicates that the anomalous vertical motion (mainly responsible for the 2020 event)was almost equally constrained by the dynamic and thermodynamic effects controlling the MSE budget. The dynamic effect was from the advection of warm and humid air by anomalous southwesterly winds. This resulted in an increase of moist static energy over the YRV and therefore ascending motion to balance the energy gain.The abnormal southwesterly winds were associated with an anomalous anticyclone over the Philippine Sea, which is consistent with the conclusions of Zhou et al. (2021)showing that the tropical Indian Ocean warming-induced anticyclone was a major player for the excessive precipitation in the summer of 2020. The thermodynamic effect,which accounts about 45.3% of the total effect (thermodynamic and dynamic effects as a sum), is the advection of anomalous MSE (mainly for latent energy) by mean climatological wind. It is actually the indication of a positive feedback between the atmospheric circulation and the MSE. We believe that the thermodynamic effect could amplify the potential role of global warming in creating vertical motion anomalies.
To further assess the causality of the exceptional precipitation in 2020, we evaluated the similarities and differences between the exceptional precipitation in 2020 and other super El Niño decaying years (such as 1983,1998, and 2016; figures omitted). Similar to the 2020 event, these heavy precipitation events are also mainly attributed to the dynamic effect, related with the advection of warm and humid air by anomalous southwesterlies over South China. They are all associated with the Philippine anticyclone, largely caused by intermediate SST anomalies of the tropical Indian Ocean in the decaying summer of the super El Niño (Chou et al., 2009; Xie et al., 2016). Although the 2020 case is not related to any known super El Niño, it shows some similarities to the El Niño cases in terms of their dynamic processes. It is worthy of noting that the thermodynamic effect has a general positive contribution to precipitation anomalies in all the three super El Niño cases. Furthermore, we also calculate the dynamic and thermodynamic effects, for June and July, separately. It shows a stronger dynamic effect in June, while a stronger thermodynamic effect in July. This seems to echo previous studies (Liu and Ding,2020; Zheng and Wang, 2021) and will be reported in the future.
Acknowledgments.The precipitation data of meteorological stations are available from the National Climate Center/CMA at https://cmdp.ncc-cma.net/. The JRA-55 reanalysis data are available from JMA public datasets at https://jra.kishou.go.jp/JRA-55/.
 Journal of Meteorological Research2022年1期
- Journal of Meteorological Research的其它文章
- A Possible Dynamic Mechanism for Rapid Production of the Extreme Hourly Rainfall in Zhengzhou City on 20 July 2021
- Estimation of Chlorophyll-a Concentration in Lake Taihu from Gaofen-1 Wide-Fieldof-View Data through a Machine Learning Trained Algorithm
- A Case Study on the Rapid Rain-to-Snow Transition in Late Spring 2018 over Northern China: Effects of Return Flows and Topography
- Southwesterly Water Vapor Transport Induced by Tropical Cyclones over the Bay of Bengal during the South Asian Monsoon Transition Period
- Energetics of Boreal Wintertime Blocking Highs around the Ural Mountains
- Potential Impact of Tonga Volcano Eruption on Global Mean Surface Air Temperature