Triton光学相干断层扫描血管成像图像中正常人的中心 凹无血管区的自动测量方法
林艾迪,方丹齐,吴苇杭,容毅标,陈浩宇
(1.汕头大学·香港中文大学联合汕头国际眼科中心眼外伤科,广东 汕头 515041;2.汕头大学电子信息工程系,广东 汕头 515063)
The foveal avascular zone (FAZ) is a highly specialized capillary-free region at the margin of the fovea which is responsible for accurate vision[1].The significant capillary dropout from this region will lead to the FAZ enlargement that may signify macular ischemia and severe visual impairment[2].Therefore,the FAZ metrics are the commonly used indicators for the evaluation of the severity and progression of some vascular retinopathies,such as diabetic retinopathy and retinal vein occlusion[3-4].
Optical coherence tomography angiography (OCTA) is a novel non-invasive imaging technology that allows mapping the retinal and choroidal microvasculature[5].In addition,the high-resolution OCTA images make them available for FAZ quantification[6].The manual FAZ measurement has been proved to be repeatable and reproducible[7-8],but it is time-consuming and labor-intensive.Automated inbuilt algorithms have been equipped in some OCTA devices to make it convenient[9-10].But for Triton OCTA,such embedded algorithms have not been provided,while another automated but customized program named MATLAB has been proposed[11].Although it has proved to be reliable enough,it is expensive and will largely restrict its application in clinical practice.
In this study,we introduced an automated customized program named the Smooth Level Sets macro (SLSM),a free and open-source plugin for ImageJ software (National Institutes of Health,Bethesda,MD) to quantify the FAZ in Triton OCTA,and compared the measurement results by MATLAB and the manual method.
1 Materials and Methods
1.1 Subjects
This study was performed at Joint Shantou International Eye Center of Shantou University and The Chinese University of Hong Kong and was approved by Institutional Review Board.Each enrolled subject followed the tenets of the Declaration of Helsinki,and the willingness to participate in this research was documented.
In this cross-sectional study,participants more than 18 years of age were enrolled.The inclusive criteria were as below:(I) refractive error within ±6 diopters (D);(II) intraocular pressure under 21 mmHg;(III) bestcorrected visual acuity at least 20/20 using the Snellen chart.Those recruited subjects with ocular media opacity or retinal diseases were excluded.
A training dataset composed of 30 randomly selected subjects was used to optimize the parameters of SLSM.In addition,a test dataset was set up to evaluate the performances of different methods.The repeatability analysis was based on the hypothesis that 95% confidence intervals (CI) of within-subject standard deviation (Sw) is estimated within 15% of Sw,1.96 ×=15%×Sw,where n and m represent the sample size and measuring times respectively[12].As we measured four times on each eye,n was calculated to be 28.46.In the agreement analysis,the formula is given asn≥log(1-β)/log(1-α).If the discordance rate (α) was 0.05 and the tolerance probability (β) was 80%,then the sample size (n) was calculated to be more than 32[13].
1.2 OCTA imaging
The OCTA imaging was performed using a sweptsource OCTA device (DRI OCT Triton;Topcon Corporation,Tokyo,Japan) with a central wavelength of 1,050 nm and a speed of 100,000 A-scans per second[14].After the pupil dilation with tropicamide,the right eye of each subject was scanned continuously four times in the test dataset by a single skillful technician while only once in the training dataset.The 3 mm×3 mm (320×320 pixels) OCTA images centered on the fovea were scanned[11].The IMAGEnet6 in Triton OCTA incorporates visualization of angiographic data sets and generates four horizontal depth-resolved slabs[15].The en face images of the superficial capillary plexus (SCP) were obtained for quantification,and those with signal strength less than 60 were excluded.We did not consider the analyses of deep capillary plexus as shadowgraphic projection artifacts existed[16].
1.3 FAZ quantification
Manual and automated methods including the SLSM and MATLAB were used for the FAZ quantification (area,perimeter and circularity) on Triton OCTA images.The FAZ area was defined as the total pixels of the segmented region while the FAZ perimeter was measured based on the length of the outlined contour.The FAZ circularity was an index indicating the regularity of a shape:the closer its value is to 1,the more similar the shape is to a perfect circle[17].The unit of pixel for all parameters was then converted to millimeters.
1.4 Manual method
The en face images of SCP were duplicated into two copies and sent to two independent observers for the FAZ quantification,the sequence of which was randomized to avoid contextual bias.The Triton OCTA images of 3 mm×3 mm slabs were imported with the original resolution of 320×320 pixels in ImageJ software.Then the FAZ boundary was outlined using Freehand Selection Tool.The FAZ metrics (area,perimeter and circularity) were measured.The manual measurement result was the average of those measured by two observers.
1.5 MATLAB program
The en face OCTA images in grayscale were imported into an automated customized program named MATLAB that has been introduced by Tanget al.[11].The nonlocal means (NLM) denoising filter and the phansalkar adaptive local thresholding method were respectively applied in the image denoising and binarization.Then the FAZ was segmented by using the region growing method which started from a seed point.Finally,the FAZ area,perimeter and circularity were measured[18].
1.6 SLSM
After being imported into ImageJ in 8-bit grayscale (Figure 1A),the OCTA images were processed by the Smooth method (Figure 1B),to blur the background noise but still preserve the boundary features.An initial seed (Figure 1C) located inside the FAZ is necessary to start the Level Sets,a modern image segmentation technique by use of the theory of partial differential equations (PDE) (available at https://imagej.net/Level_Sets).The advanced active contour algorithm is more preferred than the more basic fast marching to make it less sensitive to leaking.The contour will automatically progress like a rubber band (Figure 1D),in which the parameter of curvature provides the strength of the leaking,while the parameter of convergence acts as a criterion for converging.Once it hits the border,the contour will stop and the FAZ is segmented (Figure 1E).Then the measurement results were automatically output (area,perimeter and circularity).
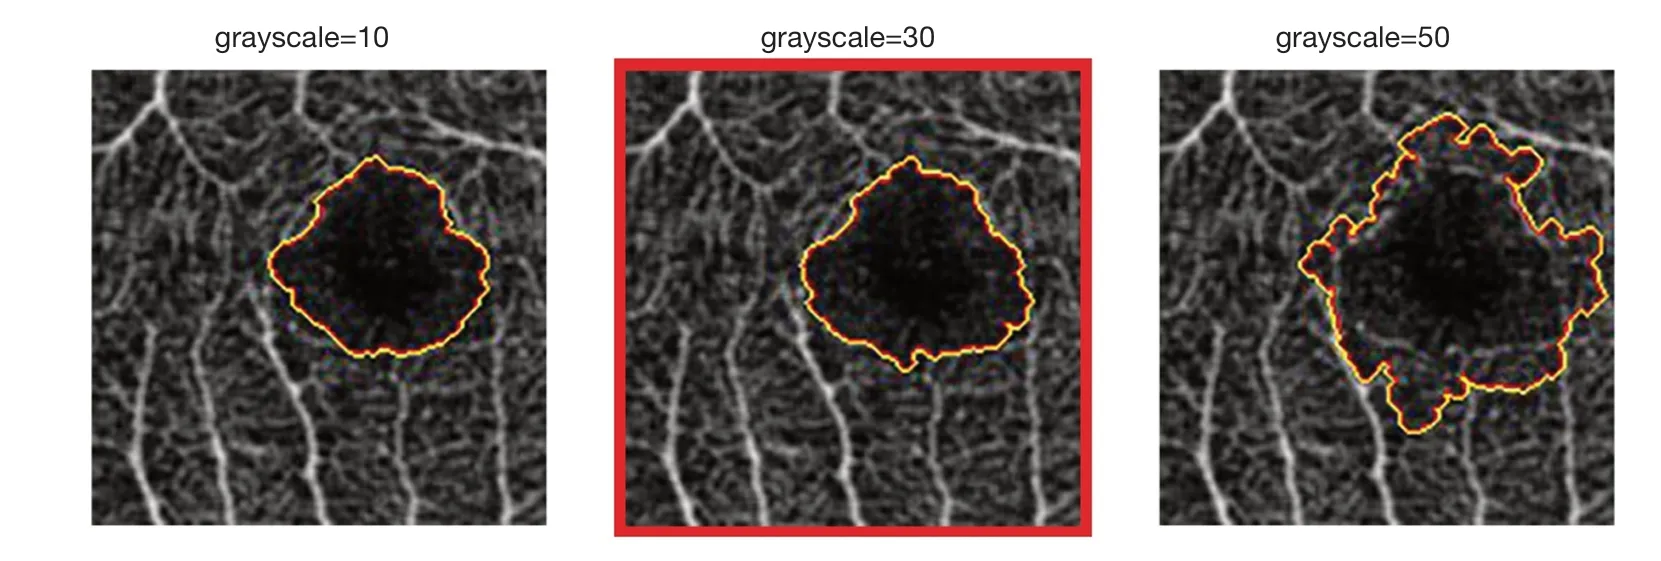
The method of optimizing the parameters has been described in our previous study[19].We tried different combinations of curvature and convergence in the training dataset and evaluated the performance by analyzing the accuracy and direct visualization.The curvature=1.5 and convergence=0.0015 presented the best performance,with an average accuracy of 0.9960 and Dice coefficient of 0.9443,respectively (Figure 2,Table 1).Different values of grayscale were also tried and presented the various segmentation results especially when the noise exists near the FAZ border,which will be easily mistaken for the vessel signals.It showed that the grayscale of 30 (Dice coefficient,0.9443) performed better than the grayscale of 10 (Dice coefficient,0.9310) and 50 (Dice coefficient,0.8965) (Figure 3).The macro script of the SLSM can be found in Figure 4.

Figure 3 Segmentation by the SLSM using different grayscale values.The segmentation (grayscale=30) appears more reliable.SLSM,Smooth level sets macro.

Figure 4 Smooth level sets macro script.

Table 1 Performance comparisons of different representative settings by the SLSM program

Figure 1 The procedure of the FAZ segmentation by the SLSM program.The original image is imported into ImageJ in 8-bit grayscale (A).The image is processed by the Smooth method (B).An initial“seed point”located at the center of the FAZ is required (C).After running the Level Sets,the active contour advances and progresses automatically (D).Once it hits the boundary,the FAZ segmentation is finished (E).FAZ,foveal avascular zone;SLSM,Smooth Level Sets macro.

Figure 2 Segmentation by the SLSM using different representative settings.The combination (curvature=1.5 and convergence=0.0015) appears more reliable.SLSM,Smooth level sets macro.
1.7 Evaluation of the segmentation performance
The segmentation results of the first observer were served as the ground truth and compared with those performed by the second observer and the automated methods.The accuracy (ACC),sensitivity (SEN),specificity (SPE)[20],and Dice coefficient[21]were used to evaluate the segmentation performance and calculated based on the following formulas:ACC=(TP+TN)/(FN+FP+TP+TN),SEN=TP/(TP+FN),SPE=TN/(TN+FP),Dice=2TP/(2TP+FP+FN),where TP=true positive,TN=true negative,FP=false positive,and FN=false negative.The values of the Dice coefficient among three different methods were compared using the oneway ANOVA/Kruskal-Wallis test.
1.8 Statistical analysis
The within-subject standard deviation (Sw) was the square root of the within-subject variance.In the repeatability analyses,coefficient of variation (CoV) was calculated as (Sw/average of the measurements)×100%,the value of which less than 10% indicated good repeatability[22].In the agreement analyses,the first measurements of each subject for all methods were analyzed using the pairedt-test,linear agreement,and Bland-Altman plots,wherePless than 0.05 was statistically significant.Intraclass correlation coefficient (ICC) was also calculated both in the repeatability and agreement analyses,using the single-measurement,absolute-agreement,two-way mixed-effects model.The classification of ICC was:poor (ICC <0.50),moderate (0.50≤ ICC <0.75),good (0.75≤ ICC <0.90),or excellent (ICC ≥0.90).The analyses were performed using SPSS Statistics 19 (IBM,Armonk,NY) and GraphPad Prism 5.01 (GraphPad Software,San Diego,CA,USA).
2 Results
In our study,35 eyes of 35 healthy subjects were included,with the mean ages of 24.69±2.52 years (range,20 to 35 years) and mean spherical equivalent of −2.25±1.93 D (range,−5.50 to 0.75 D).A total of 140 OCTA images were analyzed in the test dataset,with the mean signal strengths of 72.41±3.11 (range,60 to 79).
2.1 Performance of the FAZ segmentation
Table 2 showed the segmentation performance comparisons of the manual and automated methods.Among all methods,manual segmentation by the second observer had the highest accuracy (0.9967),and the highest value of Dice coefficient (0.9568) also proved the best performance.The performance of the SLSM was better than MATLAB,with a higher value of accuracy (SLSM:0.9964;MATLAB:0.9962) and Dice coefficient (SLSM:0.9506;MATLAB:0.9483).The values of the Dice coefficient among these three methods were statistically different (P=0.004),while the comparison of the manual methods with SLSM (P<0.001) or MATLAB (P<0.001) was also different.
2.2 Repeatability analysis
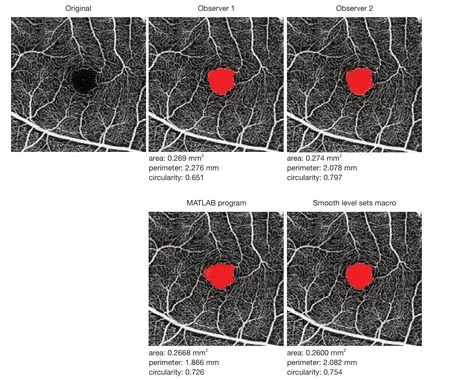
The representative OCTA images segmented by the manual and automated methods were shown in Figure 5.The segmentation results by the SLSM and MATLAB were quite comparable with those by the manual methods.Table 3 presented the repeatability of the FAZ metrics measurement by all methods.The mean ± standard deviation (SD) of the FAZ area measured by one observer was 0.369±0.112 mm2;for the other observer,it was 0.375±0.115 mm2.FAZ area manually measured (0.372±0.113 mm2) was larger than those measured by the SLSM and MATLAB (0.349±0.110 mm2and 0.352±0.111 mm2,respectively).For the FAZ area,the manual methods (ICC,0.994;CoV,2.385%),SLSM (ICC,0.987;CoV,3.935%) and MATLAB (ICC,0.983;CoV,4.165%) had excellent repeatability;for the FAZ perimeter,the repeatability of the manual methods (ICC,0.954;CoV,3.134%) and SLSM (ICC,0.958;CoV,3.406%) was both excellent,while that of MATLAB (ICC,0.883;CoV,5.881%) was only good;for the FAZ circularity,the manual methods (ICC,0.881;CoV,4.785%) presented good repeatability,while both SLSM (ICC,0.638;CoV,4.484%) and MATLAB (ICC,0.670;CoV,7.580%) only showed moderate repeatability.
2.3 Agreement analysis
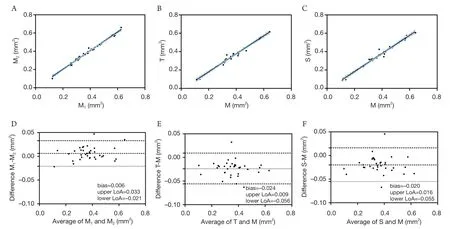
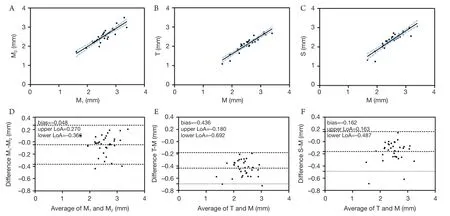
The agreement analyses between automated and manual methods were shown (Table 4,Figures 6-8).For the FAZ area,although there was a statistical difference in the measurement results of two observers (P=0.013),the interobserver agreement was excellent (ICC=0.992).Both MATLAB (ICC=0.968) and SLSM ((ICC=0.973) showed excellent agreement with the manual methods.For the FAZ area,Bland-Altman Plots showed agreement ranging from −0.021 to 0.033 for the manual method,ranging from −0.056 to 0.009 for MATLAB,−0.055 to 0.016 for SLSM.For the FAZ perimeter,the interobserver agreement was excellent (ICC=0.904).The agreement of SLSM with manual methods was good (ICC=0.837) while that of MATLAB was only moderate (ICC=0.554).For the FAZ circularity,all methods showed moderate agreement with manual methods (manual,ICC=0.716;SLSM,ICC=0.520;MATLAB,ICC=0.737).

Figure 6 Agreement (A-C) with 95% CI (blue lines) and Bland-Altman plots (D-F) of the foveal avascular zone area measured manually (M1,M2:two observers;M:average) and automatically (T:MATLAB;S:Smooth Level Sets macro).

Figure 7 Agreement (A-C) with 95% CI (blue lines) and Bland-Altman plots (D-F) of the foveal avascular zone perimeter measured manually (M1,M2:two observers;M:average) and automatically (T:MATLAB;S:Smooth Level Sets macro).

Figure 8 Agreement (A-C) with 95% CI (blue lines) and Bland-Altman plots (D-F) of the foveal avascular zone circularity measured manually (M1,M2:two observers;M:average) and automatically (T:MATLAB;S:Smooth Level Sets macro).

Table 3 Repeatability of FAZ metrics measurement by various methods

Table 4 Agreement of FAZ metrics measurements by the various methods

Figure 5 Segmentation and quantitative measurements of the foveal avascular zone by the manual methods (observer 1 and 2) and automated methods (MATLAB and SLSM program).

Table 2 Segmentation performance comparisons of the manual and automated methods
3 Discussion
In our study,we investigated the feasibility of the SLSM,a free and open-source plugin used for the automated FAZ metrics on Triton OCTA images in healthy subjects.The SLSM showed excellent repeatability and agreement with the manual methods and performed better with a higher Dice coefficient than than MATLAB did.
Previous studies have investigated the manual methods used for the FAZ metrics in kinds of OCTA devices.In Shiiharaet al.’s study[23],the intraobserver repeatability of superficial FAZ-area in normal subjects was excellent in three different OCTA instruments:Triton (Topcon),RS3000 (Nidek),and Cirrus (Zeiss),in which the ICC value for Triton OCTA was 0.987 and comparable with our study’s results.Our previous study[9]has reported the good repeatability of FAZ area and perimeter but moderate repeatability of circularity in healthy eyes on Cirrus 5000 OCTA images (ICC ≥0.600,CoV <13.48%).Buffolinoet al.[24]have shown that the repeatability of FAZ measurement was excellent (ICC >0.95) for both plexus layers in pathologic eyes on Optovue OCTA.Leeet al.[25]have proved that manual measurement of the FAZ area in superficial layer obtained from a Spectralis OCT2 device had excellent repeatability (ICC=0.965) in patients with retinal vein occlusion (RVO) without macular edema.In another study[26]of reliability analysis in eyes with RVO,the macular scan size of OCTA images obtained from Triton OCTA was 6 mm×6 mm,and the ICC for intrarater reliability was good to excellent (ICC:ranged from 0.88 to 0.96).Consistent with these studies,the current study found that manual measurements had excellent repeatability for the FAZ area and perimeter,and good repeatability for the FAZ circularity on Triton OCTA images.
Although manual methods have demonstrated excellent repeatability and reproducibility in various OCTA devices,they will waste a lot of time and labor.In this case,automated FAZ metrics will fit our need especially when a large number of images need to be analyzed,but the validation of reliability is required before being applied into the clinical practice.Lindermanet al.[27]have segmented the FAZ on Optovue OCTA using the AngioVue semiautomatic nonflow measurement tool in healthy eyes.Their study showed that the reliability of all area measurements was excellent (ICC=0.994 manual,0.969 semiautomatic),while manual segmentation had better repeatability (0.020 mm2) than semiautomatic did (0.043 mm2).Limet al.[28]have evaluated the inbuilt algorithm in the Zeiss Cirrus 5000 (AngioPlex™OCTA software) and showed good repeatability with the value of ICC more than 0.75 for automated FAZ metrics.But the agreement with manual measurements has not been given in this study.Our prior study also assessed the reliability of this embedded algorithm in Cirrus 5000 OCTA.Using a systematic way,we found that the Cirrus inbuilt algorithm outlined the border of FAZ wrongly in 22.9% of cases,and the agreement with manual measurements was poor for all FAZ metrics[9].Besides,some customized algorithms used for the automated FAZ metrics have been reported.Ishiiet al.[29]have introduced a macro-based method named the Kanno-Saitama macro (KSM) for the FAZ area measurement in the Zeiss PLEX Elite 9000,proving that it was feasible and yielded results comparable to those obtained by manual measurement.Díazet al.[30]have investigated a fully automated system used in Triton OCTA images,which provided accurate results both for healthy and diabetic eyes.But they only reported the agreement with the manual measurements,but not for the repeatability.
Tanget al.[11]have proposed a customized automated program named MATLAB for the superficial capillary network quantification on Triton OCTA images in diabetic eyes.They evaluated the repeatability of MATLAB and reported a lower ICC value of FAZ area (ICC=0.976) than our study’s (ICC=0.983),while that of FAZ circularity (ICC=0.751) was higher than ours (ICC=0.670).Fanget al.[31]have investigated MATLAB in the healthy eyes and found that the repeatability of MATLAB for the FAZ area and perimeter measurements both in the left and right eyes was excellent,while for the FAZ circularity measurement was good (ICC,ranged from 0.969 to 0.996).But they have not reported the agreement between the automated and manual methods.MATLAB was also used for the FAZ quantification in glaucoma patients,though the reliability analyses were not performed in these studies[32-33].In our study,the SLSM showed better repeatability than MATLAB for all FAZ metrics with higher ICC values.The agreement of the SLSM with manual methods for the FAZ area and perimeter was also better than MATLAB.Though MATLAB was proved to be feasible in Triton OCTA images of both healthy and pathologic eyes,it is not a free and open-source program,thus making it difficult for us to obtain.
Our previous study[19]has introduced the Level Sets macro (LSM) in the FAZ quantification on the Zeiss Cirrus HD-OCT 5000 system,which provided results comparable to those for manual measurement.Different from Cirrus 5000 OCTA images,the background noise in Triton OCTA images was apparent and will affect the detection of the FAZ boundary[34].MATLAB utilized a non-local means (NLM) denoising filter on the grayscale images to reduce the background noise and improve the signal-to-noise ratio[11].In our study,the OCTA images were only processed by the Smooth method,which will blur the background noise but the boundary features are still preserved.It can also be written in the macro language and automatically run in the SLSM program,which is more convenient and efficient than MATLAB.
There exists some limitations in our study.First,the reliability of the SLSM has not been evaluated in those eyes with ocular diseases.Secondly,we only investigated the 3 mm×3 mm macular scanning mode,and other scanning modes have not been accessed yet.Thirdly,the feasibility of this program in other OCTA systems needs further investigation.
In conclusion,the SLSM exhibits better accuracy than MATLAB did and shows excellent repeatability and agreement with manual measurement.This free and open-source program may be a feasible and accessible option for automated FAZ quantification of Triton OCTA images.
Footnote
Ethical Statement:The authors are accountable for all aspects of the work in ensuring that questions related to the accuracy or integrity of any part of the work are appropriately investigated and resolved.
Open Access Statement:This is an Open Access article distributed in accordance with the Creative Commons Attribution-NonCommercial-NoDerivs 4.0 International License (CCBY-NC-ND 4.0),which permits the noncommercial replication and distribution of the article with the strict proviso that no changes or edits are made and the original work is properly cited (including links to both the formal publication through the relevant DOI and the license).See:https://creativecommons.org/licenses/by-ncnd/4.0/.

