Rock Strength Estimation Using Several Tree-Based ML Techniques
Zida Liu,Danial Jahed Armaghani,Pouyan Fakharian,Diyuan Li,Dmitrii Vladimirovich Ulrikh,Natalia Nikolaevna Orekhova and Khaled Mohamed Khedher
1School of Resources and Safety Engineering,Central South University,Changsha,410083,China
2Department of Urban Planning,Engineering Networks and Systems,Institute of Architecture and Construction,South Ural State University,Chelyabinsk,454080,Russia
3Faculty of Civil Engineering,Semnan University,Semnan,35131-19111,Iran
4School of Resources and Safety Engineering,Central South University,Changsha,410083,China
5Department of Urban Planning,Engineering Networks and Systems,Institute of Architecture and Construction,South Ural State University,Chelyabinsk,454080,Russia
6Department of Geology,Mine Surveying and Mineral Processing,Nosov Magnitogorsk State Technical University,Magnitogorsk,455000,Russia
7Department of Civil Engineering,College of Engineering,King Khalid University,Abha,61421,Saudi Arabia
8Department of Civil Engineering,High Institute of Technological Studies,Mrezgua University Campus,Nabeul,8000,Tunisia
ABSTRACT The uniaxial compressive strength (UCS) of rock is an essential property of rock material in different relevant applications,such as rock slope,tunnel construction,and foundation.It takes enormous time and effort to obtain the UCS values directly in the laboratory.Accordingly, an indirect determination of UCS through conducting several rock index tests that are easy and fast to carry out is of interest and importance.This study presents powerful boosting trees evaluation framework,i.e.,adaptive boosting machine,extreme gradient boosting machine(XGBoost), and category gradient boosting machine, for estimating the UCS of sandstone.Schmidt hammer rebound number,P-wave velocity,and point load index were chosen as considered factors to forecast UCS values of sandstone samples.Taylor diagrams and five regression metrics,including coefficient of determination(R2),root mean square error,mean absolute error,variance account for,and A-20 index,were used to evaluate and compare the performance of these boosting trees.The results showed that the proposed boosting trees are able to provide a high level of prediction capacity for the prepared database.In particular,it was worth noting that XGBoost is the best model to predict sandstone strength and it achieved 0.999 training R2 and 0.958 testing R2.The proposed model had more outstanding capability than neural network with optimization techniques during training and testing phases.The performed variable importance analysis reveals that the point load index has a significant influence on predicting UCS of sandstone.
KEYWORDS Uniaxial compressive strength;rock index tests;machine learning techniques;boosting tree
1 Introduction
The uniaxial compressive strength (UCS) of rock is the maximum compressive stress that rock can bear before failure under uniaxial compressive load [1].It is one of the most basic mechanical parameters of rock mass in engineering investigation [2,3].UCS has been widely recognized in rock foundation design [4], tunnel surrounding rock classification [5], rock mass quality evaluation [6],etc.The direct way to obtain the UCS of rock needs to be in accord with the suggestions by the international society for rock mechanics(ISRM)[1],and it is needed to make rock blocks into standard specimens and carry out rock tests in the laboratory.However,this measurement process is restricted by many conditions.For example,rock samples are required to be complete and should not contain joints and fissures.Furthermore,rock sampling and specimen processing and transportation have strict restrictions,and it is challenging to obtain the ideal rock core in highly fractured,weak,and weathered rock masses.Not only that,conducting the rock tests to obtain UCS is time-consuming and expensive[3,7,8].Accordingly,it is requisite to find an economical and easy method to estimate the UCS of rock accurately[9].
Aladejare et al.[10] summarized the empirical prediction methodologies of UCS in rock.Some empirical equations for predicting UCS are listed in Table 1.The empirical estimation methods adopt the simple regression analysis to fit the correlation between the single or multiple physical or other mechanical parameters and UCS in rock.The physical parameters include Equotip hardness number[11], Schmidt Hammer rebound number (N) [12], Shore hardness [13], density (ρ) [14], porosity (n)[15],P-wave velocity(VP)[16],S-wave velocity(Vs)[17],unit weight(γ)[18],and slake durability index(SDI) [19].The mechanical parameters used to predict the UCS are easier to obtain than the UCS,and they are comprised of block punch index (BPI) [12], Young’s modulus (E) [20], poisson ratio(v),Brazilian tensile strength(BTS)[14],point load strength(Is(50))[14,15],and other properties.The empirical prediction equations are simple and effortless to use on-site.Nevertheless, they are only effective for certain rock and geological conditions[10].
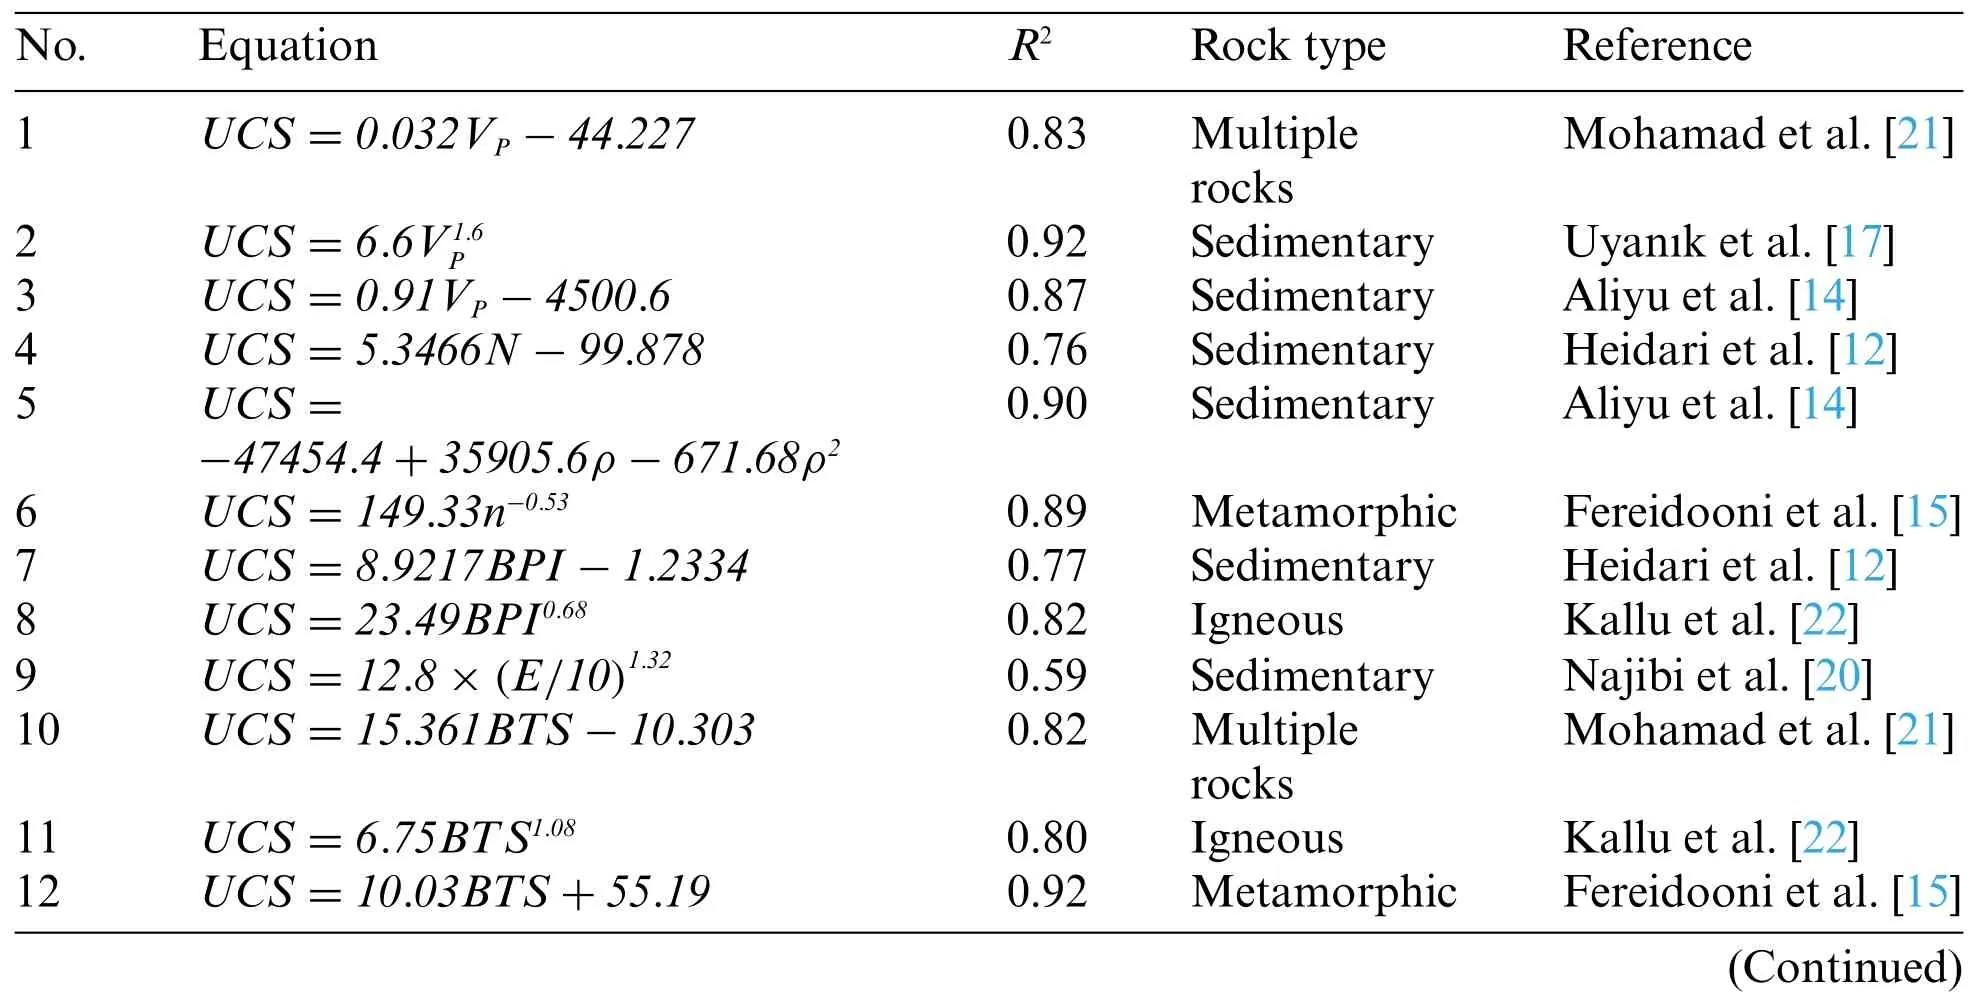
Table 1: Simple empirical equations for estimation of UCS

Table 1 (continued)
Apart from empirical equations, multiple regression analyses and their results have been widely suggested in the literature,as shown in Table 2.Jalali et al.[24]appliedN,BPI,Is(50),andVPto establish the multiple linear regression (MLR) for predicting the UCS of sedimentary.Armaghan et al.[25]fitted an empirical equation consideringρ, SDI, and BTS.Uyanık et al.[17] built an equation to estimate the UCS of sedimentary based onVPandVS.Teymen et al.[26] developed nine empirical equations adopting nine groups input parameters to foretell the UCS of multiple rocks.The multiple regression analyses consider the effect of multiple variables and are better than empirical equations only adopting one variable.Nevertheless, multiple regression analyses cannot get perfect results for complex problems[26].
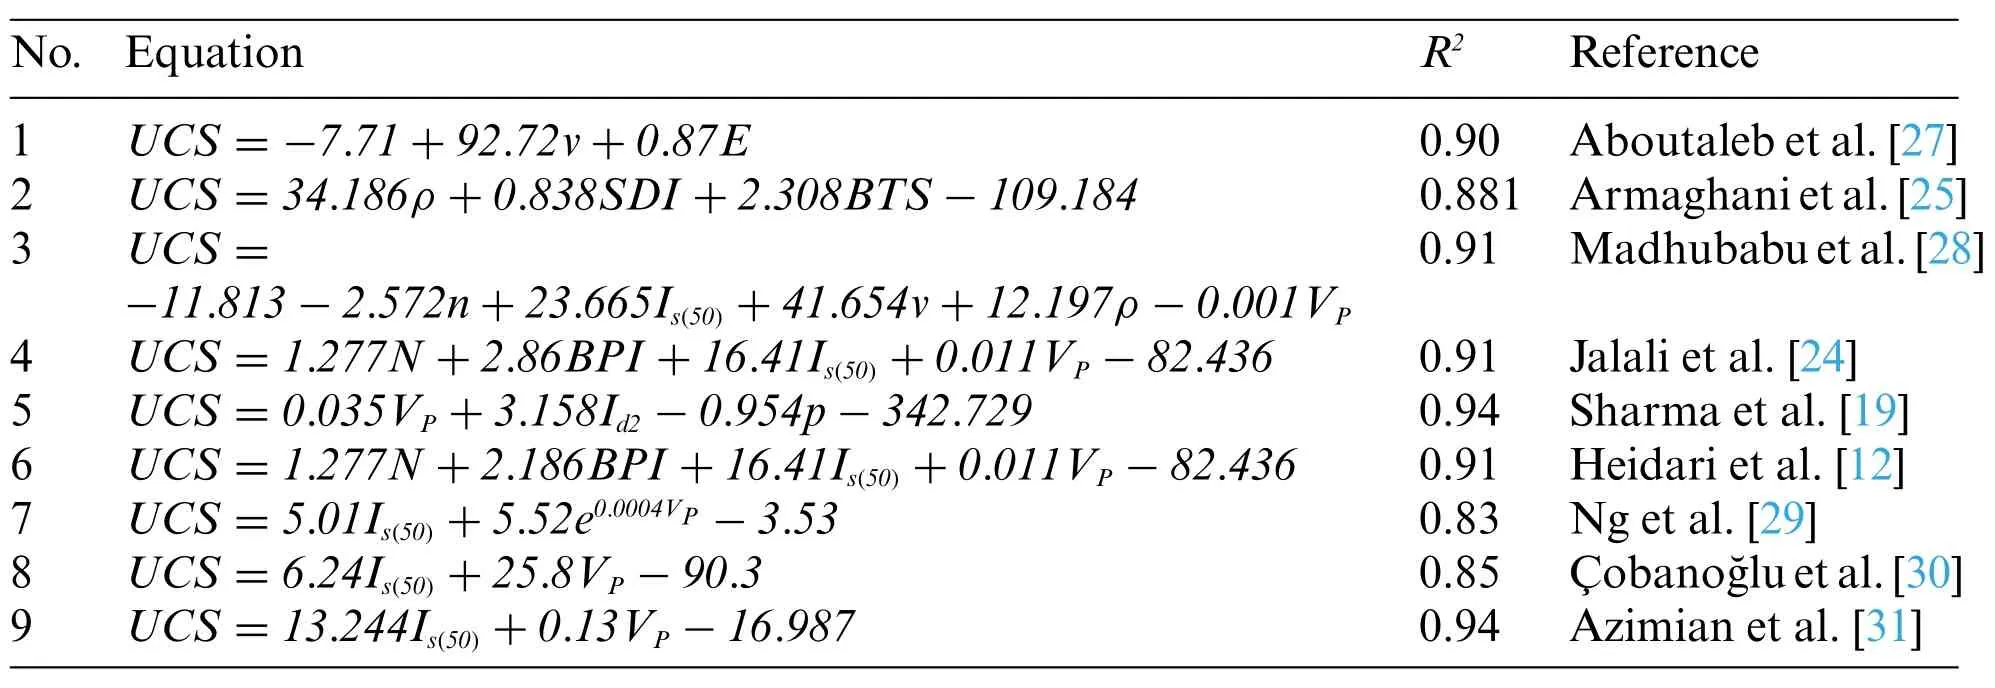
Table 2: Some multiple regression equations for estimating UCS of rock
With the development of artificial intelligence, intelligent techniques have been widely used to solve problems in science and engineering[32-41].In civil engineering[42-44],they have been used in different fields such as the estimation of the sidewall displacement of the underground caverns [45],the prediction of water inflow into drill and blast tunnels[46],evaluation of disc cutters life of tunnel boring machine[47],and so on.Additionally,artificial intelligence and machine learning(ML)were highlighted by researchers as effective and relatively accurate in predicting rock mass and material properties[48-52].Fuzzy inference systems(FIS)is a fuzzy information processing system based on fuzzy set theory and fuzzy inference.The fuzzy logic can reduce the uncertainty caused by unknown and variation and promote the application of FIS in rock mechanics [53].The FIS widely used to predict the UCS can be divided into the Sugeno FIS [12,54], Mamdani FIS [54-56], and adaptive neuro-fuzzy inference system (ANFIS) [57-59].FIS is simple in structure and is very effective in uncertain environments.However, the prediction results of FIS are likely to be based on uncertain assumptions,which leads to the inaccuracy of the prediction results under some conditions.
Genetic programming (GP) and gene expression programming (GEP) are parts of evolutionary computation, and they are based on the genetic algorithm (GA).GEP and GP adopt a generalized hierarchical computer program to describe a problem.Individual formation requires terminal and function symbols, which are different from GA.Wang et al.[60] adopted the GEP to build the relationship betweenNand UCS, and the obtained equation is validated in practical engineering.nce et al.[61]employed GEP to build the model based onIs(50),n,andρfor estimating the UCS,and the results showed that the GEP was preferable to predict the UCS of rock.Özdemir et al.[62]utilized GP to foretell the UCS of rock with the input parameters ofVP,n, andN, and GP can generate a satisfactory equation for predicting the UCS.GEP and GP can give a explicit relationship between input variables and UCS, but the optimal model cannot be obtained if their parameters, such as mutation rate and population number,are improper.
ML is the leading method to implement artificial intelligence,and it can be divided into supervised learning and unsupervised learning.Based on statistics,ML builds the nonlinear mappings of input and output variables by analyzing complex internal relationships behind data.The supervised learning models are frequently used to predict the UCS of rock, and they include artificial neural network(ANN),support vector machine(SVM),k-nearest neighbor(KNN),Gaussian regression,regression tree, and ensemble models.ML has a strong ability to extract information from data, and it has increasingly applied in the prediction of UCS of rock recently.For instance,Rahman et al.[63]adopted the neutral network to fit the relationship betweenVPand UCS in different rock types.Cao et al.[64]applied the extreme gradient boosting machine(XGBoost)to predict the UCS of granite based on the physical parameters and minerals percentage,and XGBoost has better estimation results than SVM and ANN.Gowida et al.[65] implemented the SVM to foretell the UCS of rock in time based on the six drilling mechanical parameters.Mahmoodzadeh et al.[66] utilized the Gaussian process to evaluate UCS of rock based onn,N,VP,andIs(50),and the Gaussian process performed better than other models.ML techiniques have the powerful ability to extract the relationship behind datasets,but their capacities rely on the quality of datasets and hyperparameters.
As the crucial part of ML,the boosting tree models have been increasingly used in geotechnical engineering, such as rockburst prediction [67-71], tunnel boring machine advance prediction [72],blast-induced ground vibration [73], and so on.Boosting trees have more outstanding performance than other models,such as ANN,SVM,etc.[69,74].However,there are no studies about applying and comparing the application of boosting trees in predicting UCS of rock.To fill this gap,in this paper,three boosting trees models,adaptive boosting machine(AdaBoost),XGBoost,and category gradient boosting machine(CatBoost),are introduced to build the intelligent models for predicting the UCS of sandstone.The three models are developed and evaluated to compare their performance and choose an optimal model for estimating UCS of sandstone.
2 Tree-Based Models
2.1 AdaBoost
Boosting is a strategy to build ensemble models, and it trains multiple weak learners according to the training set and combines these weak learners into a strong model.AdaBoost was proposed by Freund et al.[75],which is suitable for regression and classification and can improve the capability of the tree.In this study,there is a detailed introduction about AdaBoost for regression.
As shown in Fig.1,before performing the regression task,there is needed to determine the number of trees(i.e.,the number of iterations).Firstly,the weight of each sample in the training set is initialized.If the number of total samples ism,the initial weight of each sample is 1/m.Then,the weak regression trees are built.The maximum and relative errors in the samples are calculated, the relative error is used to determine the learning rate,and the learning rate is adopted to calculate the weight coefficient of weak learners.The distribution of training samples is updated according to the weight coefficient.Finally,these weak regression trees are combined.The weight coefficients of the weak regressors are sorted,and the last strong regression model is chosen according to the median value.
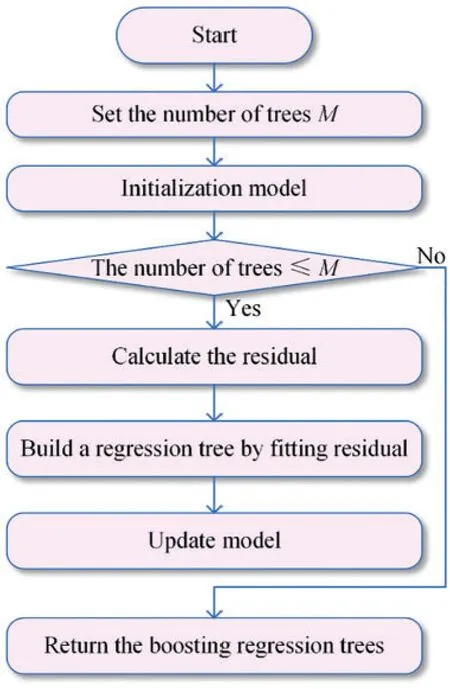
Figure 1:The flowchart to build AdaBoost models
2.2 XGBoost
Gradient boosting[76]is the enhancement of AdaBoost,which is applicable to any differentiable loss functions.The negative gradient of the loss function in the current model is used to train a new weak learner,and then the trained weak learner is added to the existing model.
XGBoost is the development of gradient boosting [77], and it employs the Taylor second-order expansion of the loss function and adds the regularization term to control the complexity of the model.Fig.2 shows the steps to build XGBoost.The loss function in XGBoost can be expressed as Eq.(1).
whererepresents the loss function in thetiteration,yidepicts the actual value of theisample,is the predicted value of the model at thet- 1 iteration,l(·)is the loss function,Ω(fi)is the regularization term,andCis a constant value.
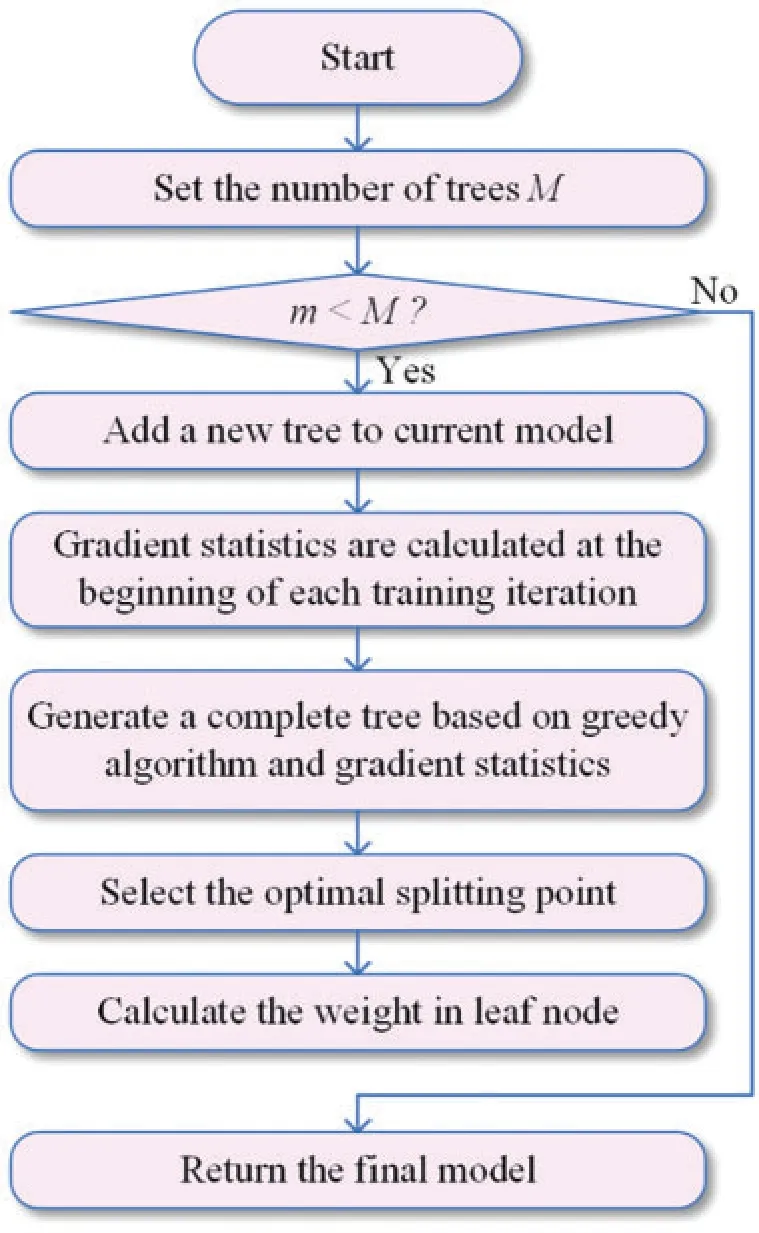
Figure 2:The flowchart to develop XGBoost models
2.3 CatBoost
CatBoost was proposed by Yandex in 2017[78],and it is based on gradient boosting and can deal with the category data.CatBoost converts category data to numeric data to prevent overfitting[79].CatBoost can effectively process the category data after performing random permutations.By training different base learners with multiple permutations, CatBoost can obtain the unbiased estimation of gradients to reduce the impact of gradient bias and improve the robustness.
Fig.3 displays the flowchart to construct CatBoost.The oblivious trees are chosen as the base learners in CatBoost, and in the trees, the judgment conditions for each node in each layer are the same.The oblivious trees are relatively simple and can improve the prediction speed when fitting the model.CatBoost has fewer hyperparameters and better robustness,and it is easy to use.
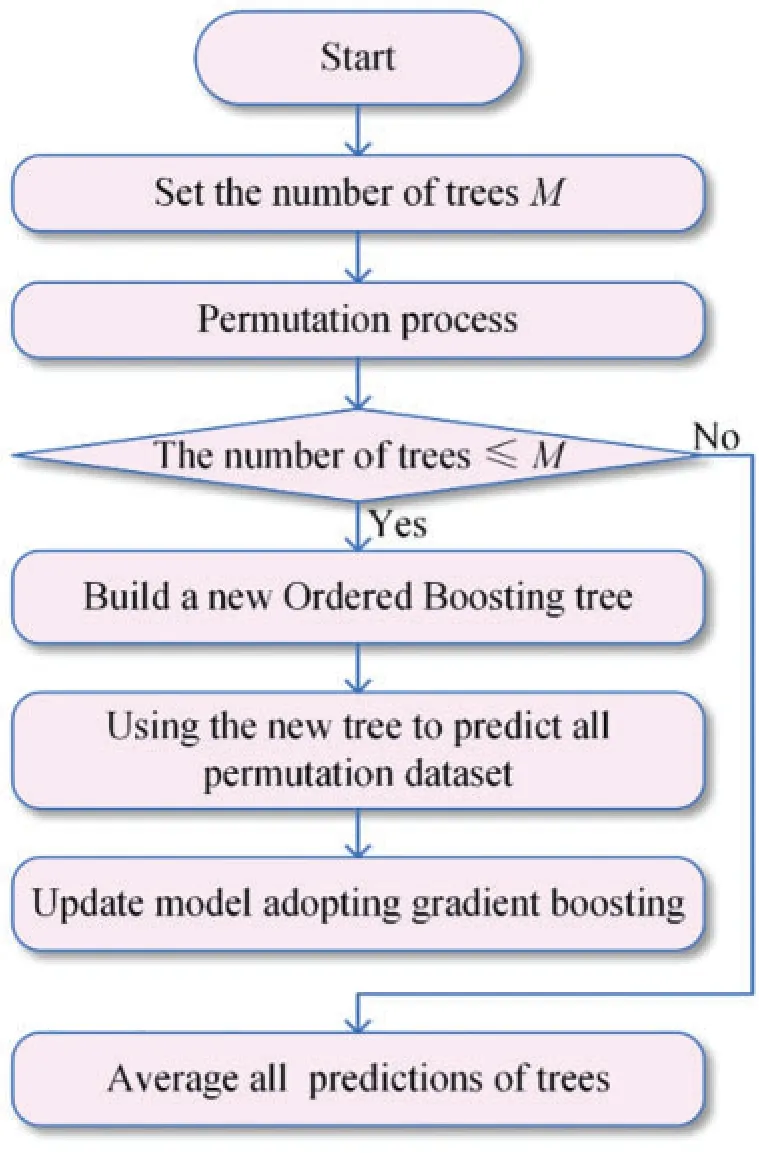
Figure 3:The flowchart to construct CatBoost models
3 Database
3.1 Data Source
The data used in this study is the same data applied by Armaghani et al.[80].The data was collected from Dengkil,Selangor,Malaysia.The sandstone composed of 85%mineral quartz and 15%clay is the primary rock in this area.To develop boosting trees,108 sandstone blocks were sampled in the field,and these blocks were cored and processed into the standard samples according to the suggestions by the ISRM[1].The prepared samples were subjected to rock mechanics testing in the laboratory.108 samples withN,VP,Is(50),and UCS were obtained to build the database.N,VPandIs(50)are the input parameters for predicting the UCS.
3.2 Data Description
The database is statistically analyzed,and Table 3 lists the statistical information of the collected database,and the range of variables,mean value,standard deviation,and quantile are listed.UCS is between 23.2 and 66.8 MPa,and the rock belongs to low to medium strength according to ISRM,as shown in Fig.4.The skew in input and output variables is not zero,indicating that the data distribution is asymmetrical.The kurtosis is less than zero, demonstrating that the database is dispersive.The scatter distributions between any two variables are displayed in Fig.5.Fig.6 shows the box plots of four parameters.The mean values of the four variables are greater than the median, and the box plots are right-skewed distributions.Eq.(2)is applied to calculate the correlation coefficient among all parameters.Fig.7 exhibits the heatmap of the calculation results.In the heatmap, darker colors indicate higher correlations.It can be seen that four parameters are positively correlated.UCS has a strong correlation withVPandIs(50).
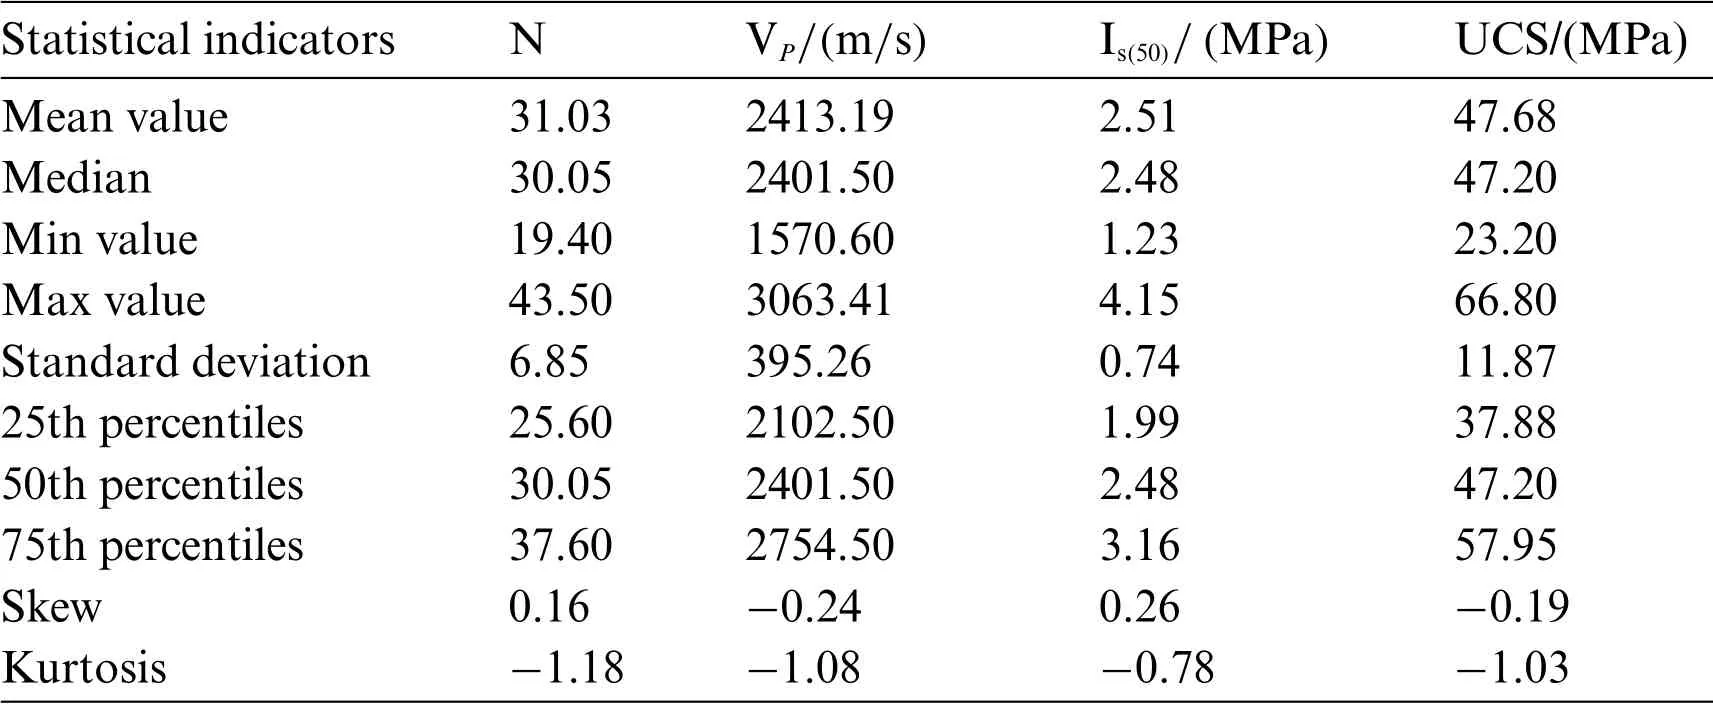
Table 3: The statistical information of the collected database

Figure 4:The rock classification based on UCS suggested by ISRM[81]
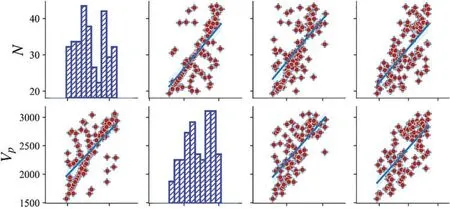
Figure 5: (Continued)
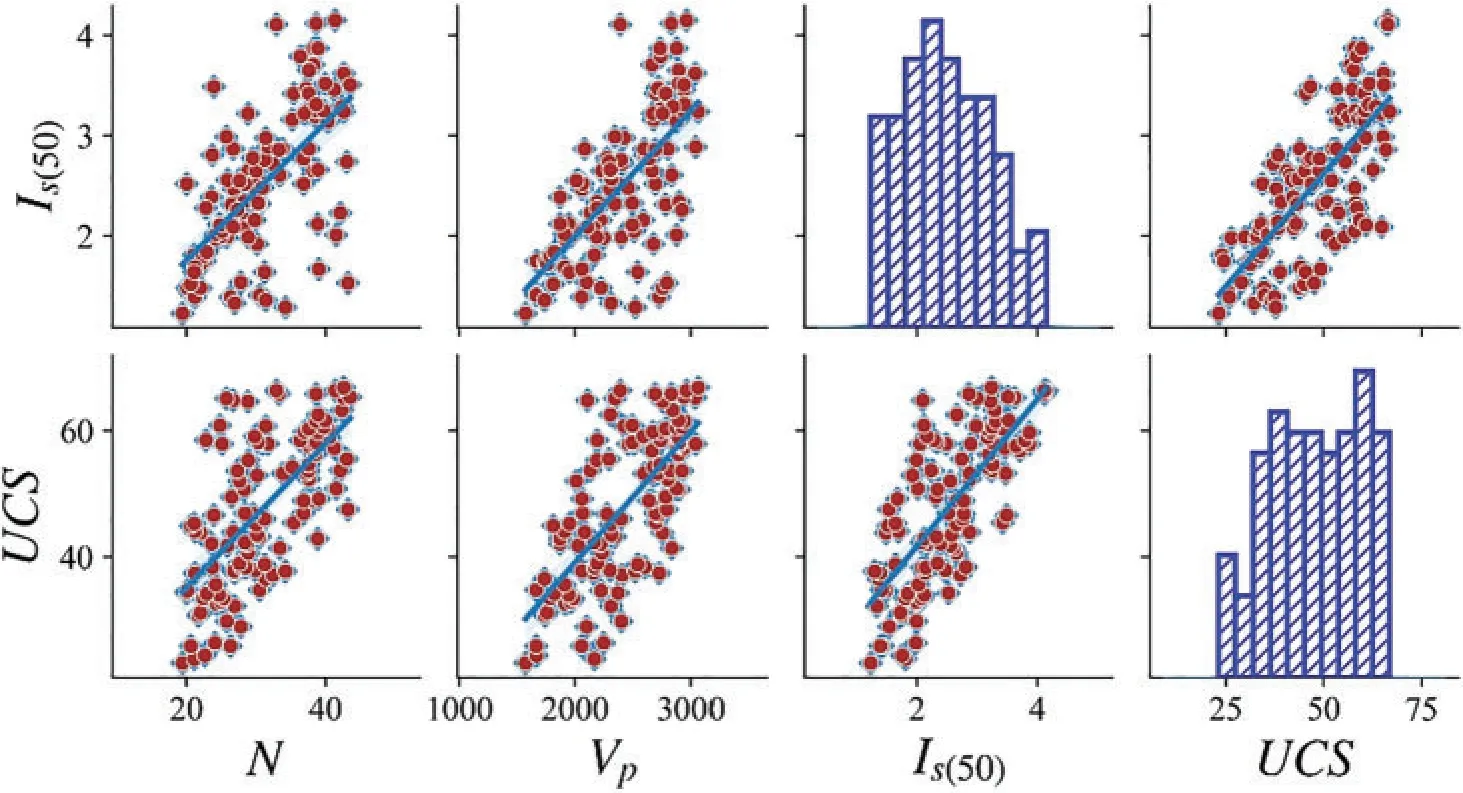
Figure 5:The scatter and histogram distributions of the database

Figure 6:The box plots of four variables
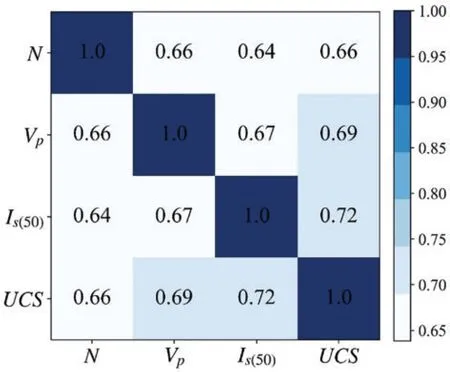
Figure 7:The heatmap of the correlation coefficients between variables
3.3 Step-by-Step Study Flowchart
The database was established to construct the tree-base models for foretelling the UCS of sandstone.According to Fig.8,the database is randomly split into two portions,one portion accounted for 80%of the database is adopted to train the tree-based models,and another portion accounted for 20%is utilized to evaluate the capabilities of models.The regression trees are developed,and three different boosting strategies are implemented to combine these trees for obtaining the final ensemble models.A ranking system composed of five regression metrics is introduced to evaluate the performance of three models during the training and testing stages.AdaBoost, XGBoost, and CatBoost are ranked and compared according to the ranking system.Finally,the relative importance of input parameters in the three models is calculated based on the principles of trees growth.
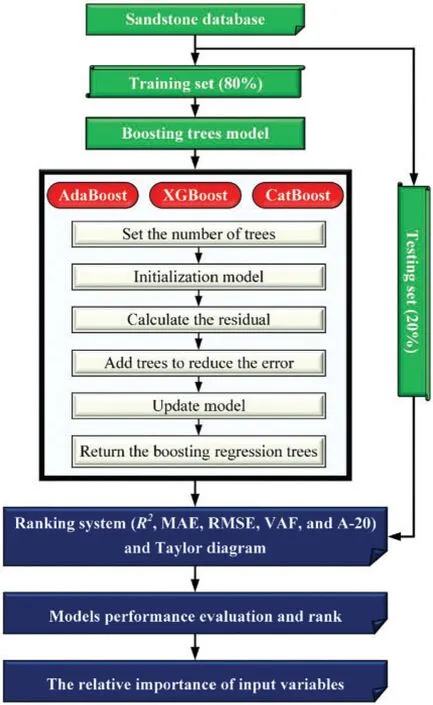
Figure 8:The technique flowchart to build tree-based models for predicting UCS in sandstone
4 Modeling
For developing the tree-based models,the database is divided into the training parts(80%)and the testing parts(20%).The training parts include 86 datasets and are used to train AdaBoost,XGBoost,and CatBoost.Eq.(3)is adopted to process the input data.ThreePythonlibraries,Scikit-learn[82],XGBoost[78],andCatBoost[77],are applied to develop AdaBoost,XGBoost,and CatBoost models,respectively.
whereXis the original input parameter,Xmaxrepresents the maximum value of input parameter,Xminstands for the minimum value of input parameter,andXnormdepicts the normalized parameter.
The regression trees are the base learners in the three models, and the number of trees controls the potential and complexity of the model.The number of trees needs to be reasonably determined to prevent overfitting, and for simplicity, other hyperparameters utilize the default value inPythonlibraries.In AdaBoost, the distribution of 86 training datasets is initialized, and the first tree is developed.Then,the linear loss function is used to evaluate the error between the predicted and actual UCS.The learning rate is set to 1,indicating no shrinkage when updating the model.Afterward,the tree is added to the AdaBoost to minimize the error continuously.Fig.9 shows theR2variation with the increase of trees.When the number of trees reaches 95,AdaBoost has the highestR2and lowest error.Accordingly,the number of trees in AdaBoost is set to 95.Table 4 lists the primary hyperparameters of AdaBoost in this study.After building all the trees,AdaBoost combines the outcomes of 95 trees as the final output.
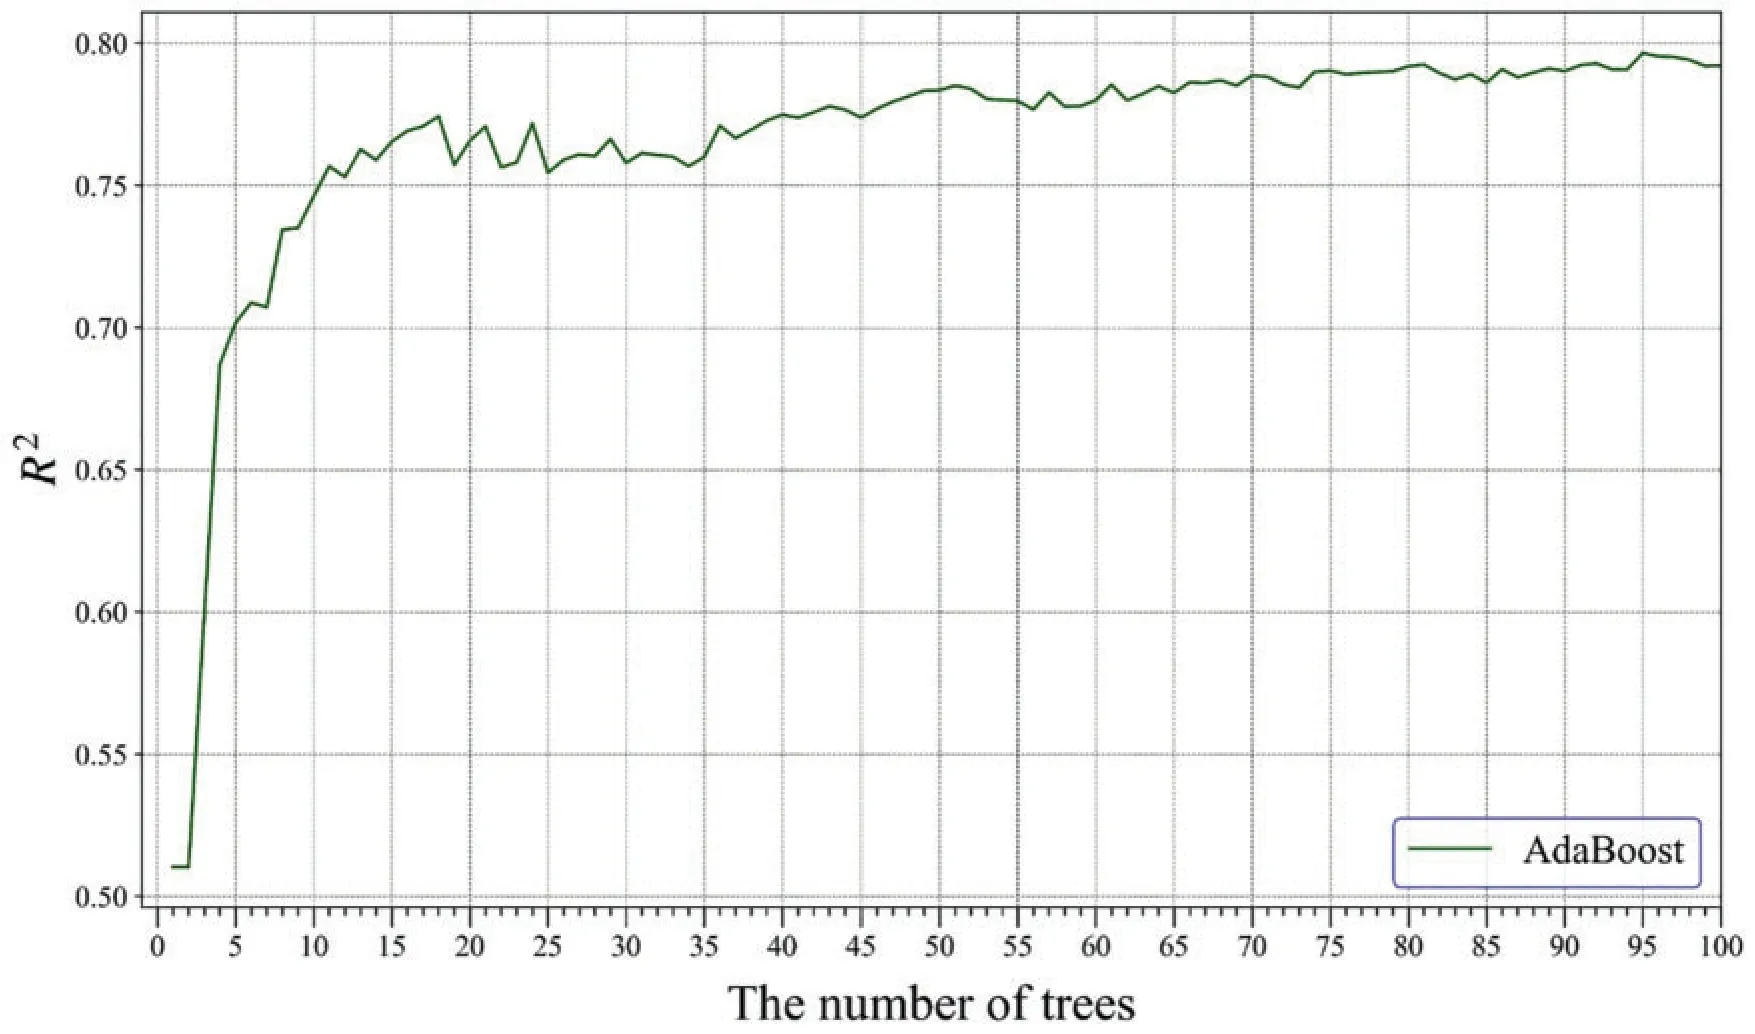
Figure 9:The R2 variation with the increasing of trees during the training process in AdaBoost
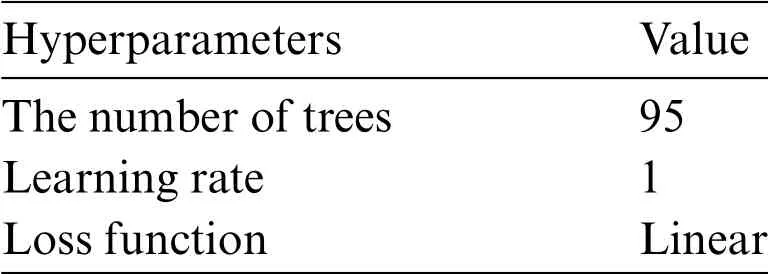
Table 4: The hyperparameters in AdaBoost
The training process of XGBoost is similar to AdaBoost by appending trees in sequence to reduce the error.The learning rate is 0.3, which specifies the shrunk step size when updating the model.The maximum depth in trees controls the complexity,and it is set to 6.Additionally,XGBoost increases regularization terms to prevent overfitting for improving the potential.Table 5 presents these parameters values.From 0 to 100,the tree is added to XGBoost in turn.Fig.10 shows theR2variation,and the curve is smooth.After the number of trees gets to 35,trainingR2does not vary.Therefore,the number of trees is 35.
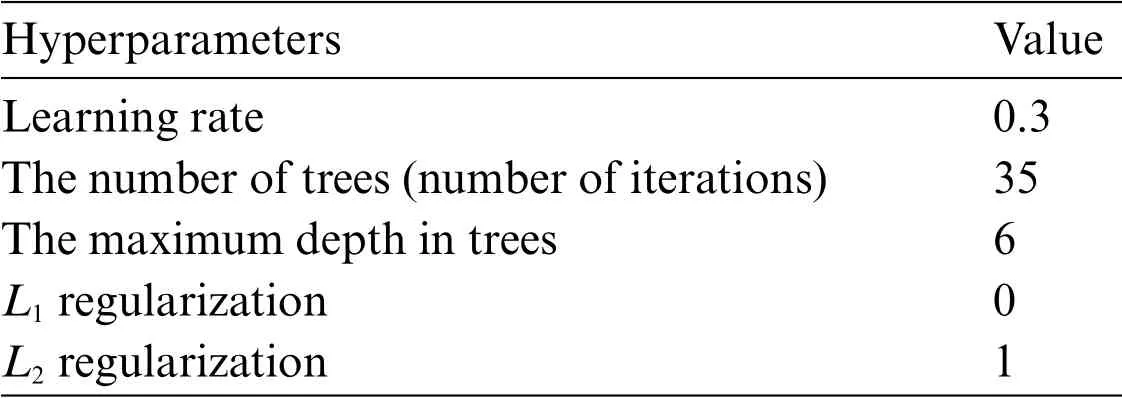
Table 5: The hyperparameters in XGBoost
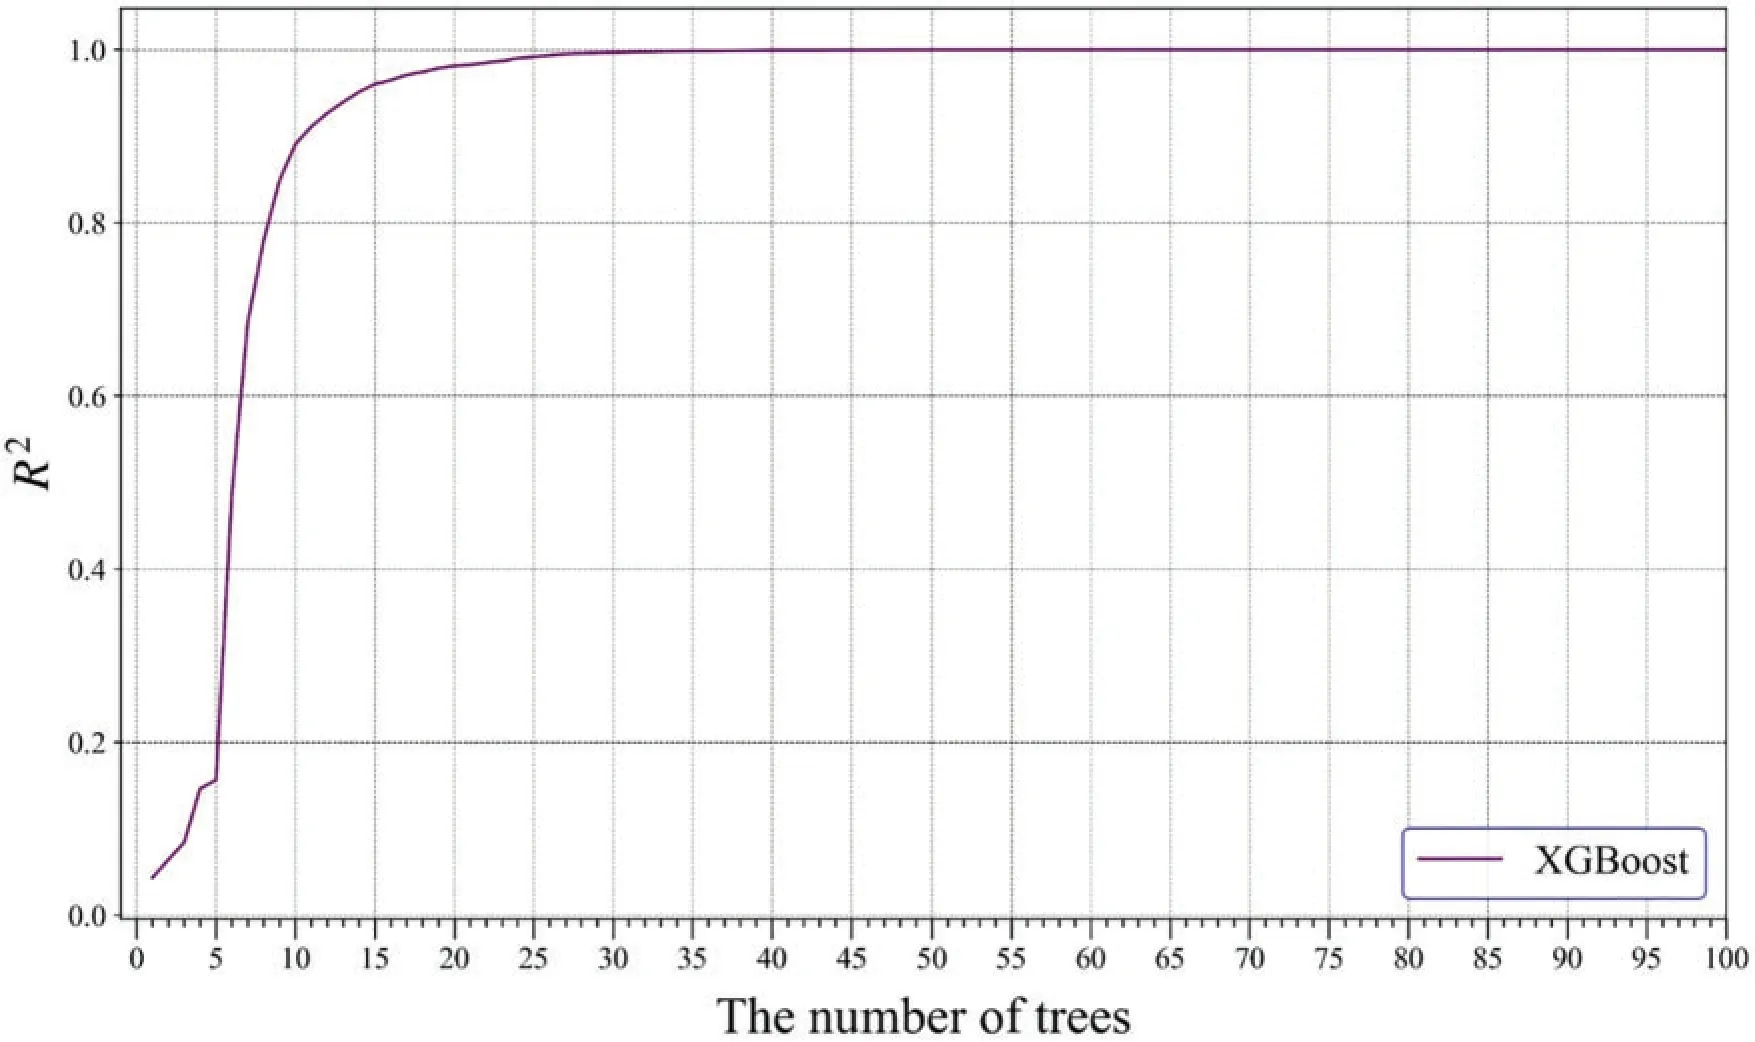
Figure 10:The R2 variation with the increasing of trees during the training process in XGBoost
Compared to XGBoost and AdaBoost,CatBoost can automatically determine the learning rate according to the training set and iteration number, and the automatically determined value is close to the optimal.Additionally,the oblivious tree is adopted as the base learners,and its depth is set to 6.CatBoost also adds random strength,which is used to avoid overfitting.The default iterations are 1000 in thePython CatBoostlibrary.To find an appropriate iterations number,the iterations increases from 10 to 1000 in steps of 10.Fig.11 depicts theR2variation during the training process in CatBoost.When the iterations reach 1000,theR2is the maximum.Accordingly,the number of iterations is set to 1000,and the automatically determined learning rate is 0.25.Table 6 lists the primary parameters to develop the CatBoost model for predicting UCS in sandstone.
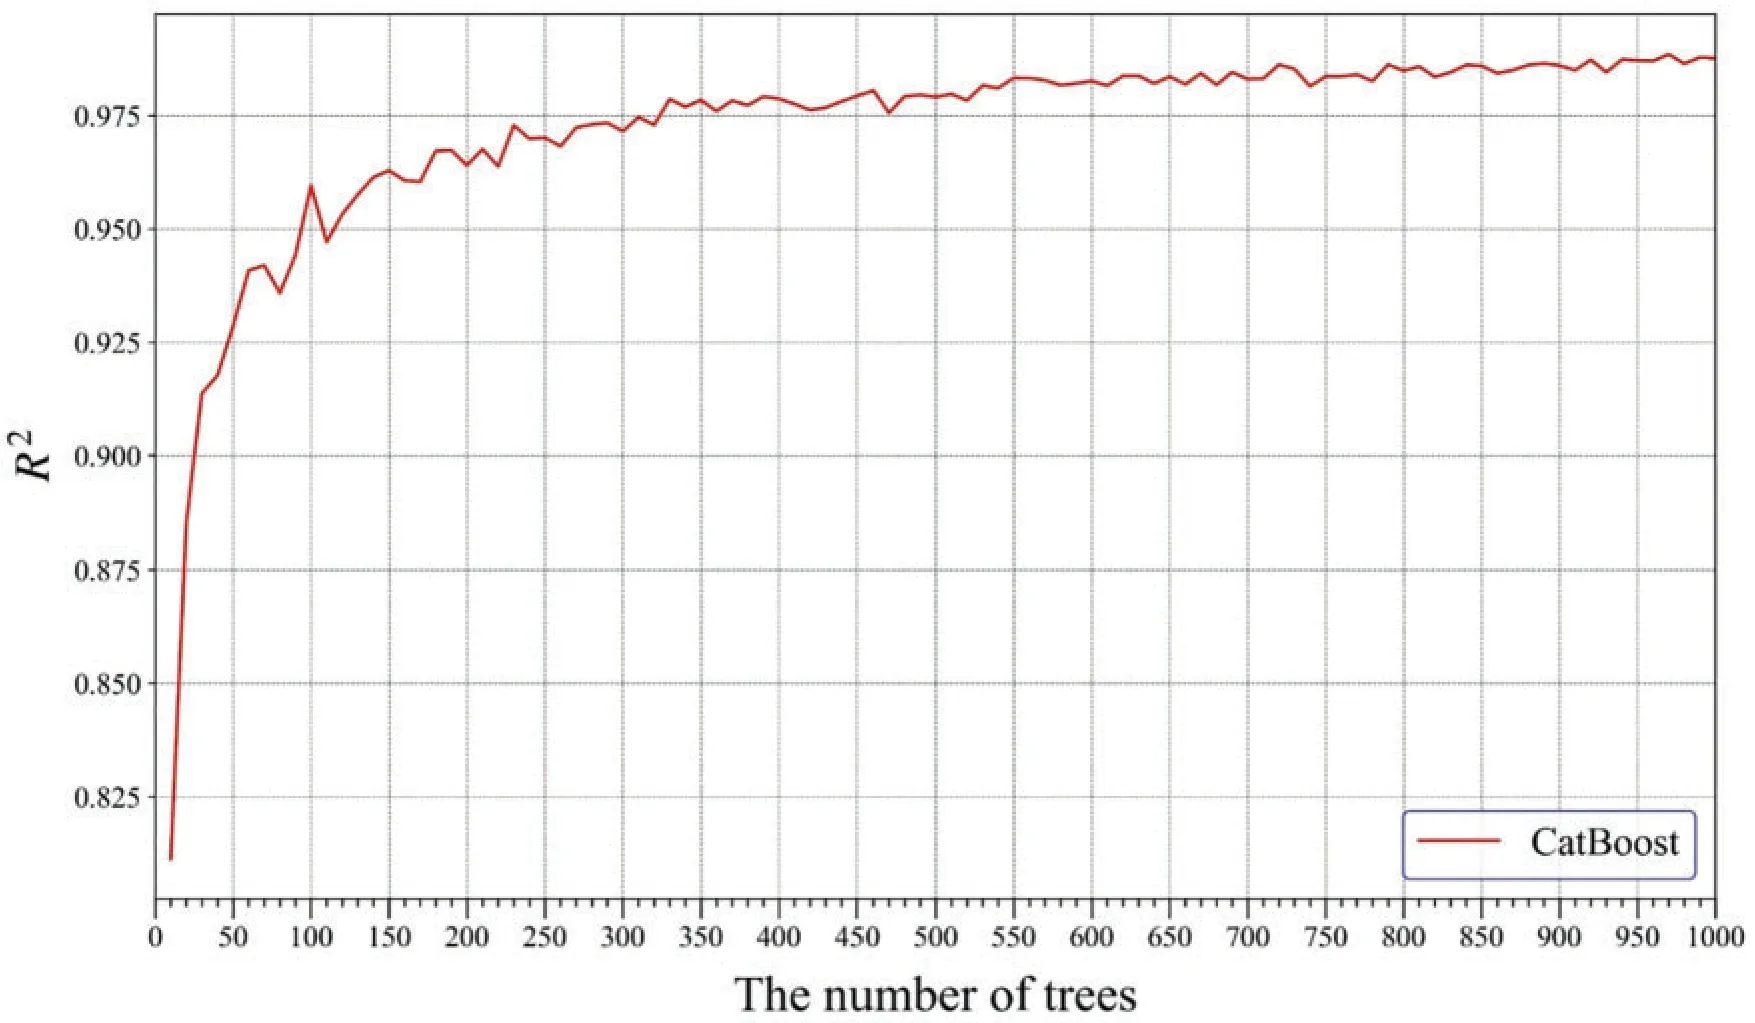
Figure 11:The R2 variation with the increasing of trees during the training process in CatBoost
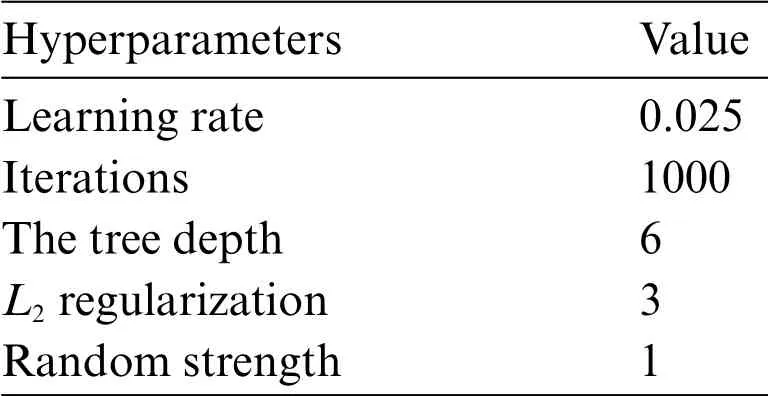
Table 6: The hyperparameters in CatBoost
5 Results and Discussion
5.1 Model Performance Evaluation
AdaBoost, XGBoost, and CatBoost are built according to the 86 training samples and their corresponding parameters.The remaining 22 testing samples are utilized to evaluate the performance of the three models.R2, root mean square error (RMSE), mean absolute error (MAE), variance account for (VAF), and A-20 index are calculated according to the predicted and measured UCS.These five indicators are widely recognized as the regression evaluation index [83-87].Eqs.(4)-(7)show the equations for computing the RMSE,MAE,VAF,and A-20 index,respectively.
wherevar(·)means the variance,andm20 is the number of samples with a ratio of the predicted value to the actual value in the range(0.8,1.2).ForR2,VAF,and A-20 index,the larger values are accompanied by better prediction performance.For RMSE and MAE,their values are closer to 0,and the model can get the superior capability.When the predicted values are totally equal to the actual,R2and A-20 are 1,RMSE and MAR are 0,and VAF is 100%.
Figs.12-14 exhibit the training and testing results in AdaBoost, XGBoost, and CatBoost,respectively.In these figures,the horizontal axis represents the actual UCS,and the vertical axis means the predicted UCS.When the predicted value is equal to the actual,the corresponding point falls in the red line.The points are closer to the red line, and the model has better estimation performance.The points representing XGBoost are closest to the red line,and XGBoost has the optimal capability.Additionally,the points between two purple dotted lines mean their predicted values are graters than 0.8 times the actual values and less than 1.2 times the actual values.Only the points predicted by Adaboost are outside the two purple dotted lines,and its performance is worst.
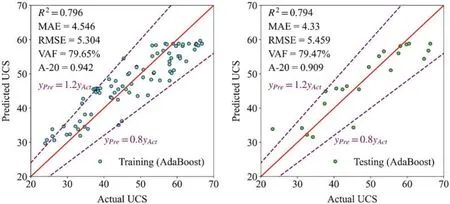
Figure 12:The training and testing results in AdaBoost
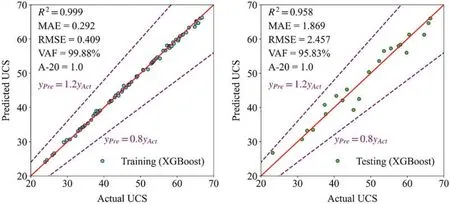
Figure 13:The training and testing results in XGBoost
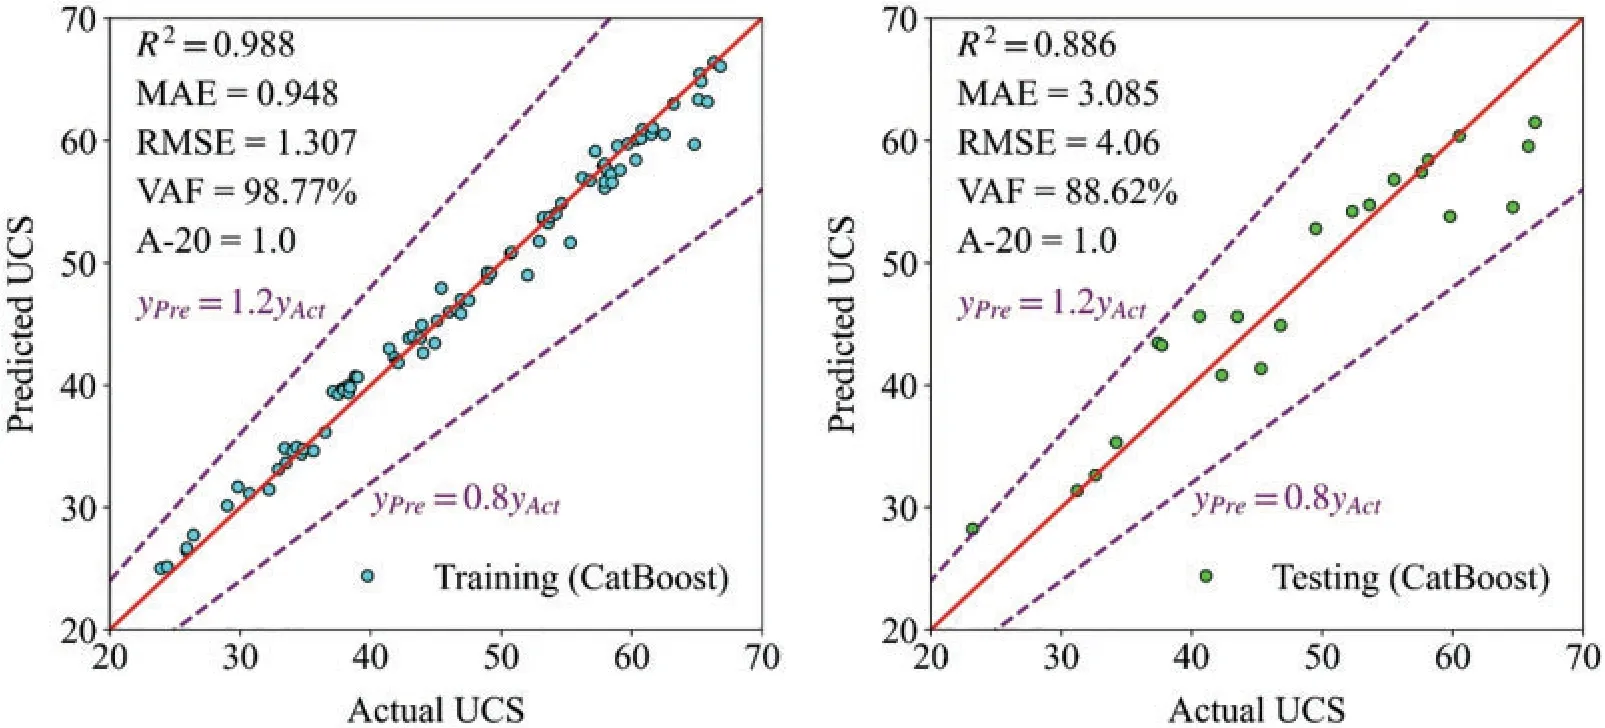
Figure 14:The training and testing results in CatBoost
The Taylor diagrams [88] are introduced to analyze the training and testing results of three models, as shown in Fig.15.Taylor diagrams combine the correlation coefficient, centered RMSE,and standard deviation into one polar diagram according to their cosine relationship (Eq.(8)).In Fig.15, the distance from the origin means the standard deviation, and the angle from clockwise represents the correlation coefficient.It can be seen that the standard deviations of predicted UCS by three models are lower than that of actual UCS.Furthermore,the reference point with pentastar shape reflects the actual UCS, and other points nearer to the reference indicate that their predicted values have lower centered RMSE and their corresponding models have the superior capability.In the training and testing stages,XGBoost performs best,followed by CatBoost,and finally AdaBoost.
whereE'means the centered RMSE,σpis the variance of predicted values,σais the variance of actual values,and theRis the correlation coefficient.
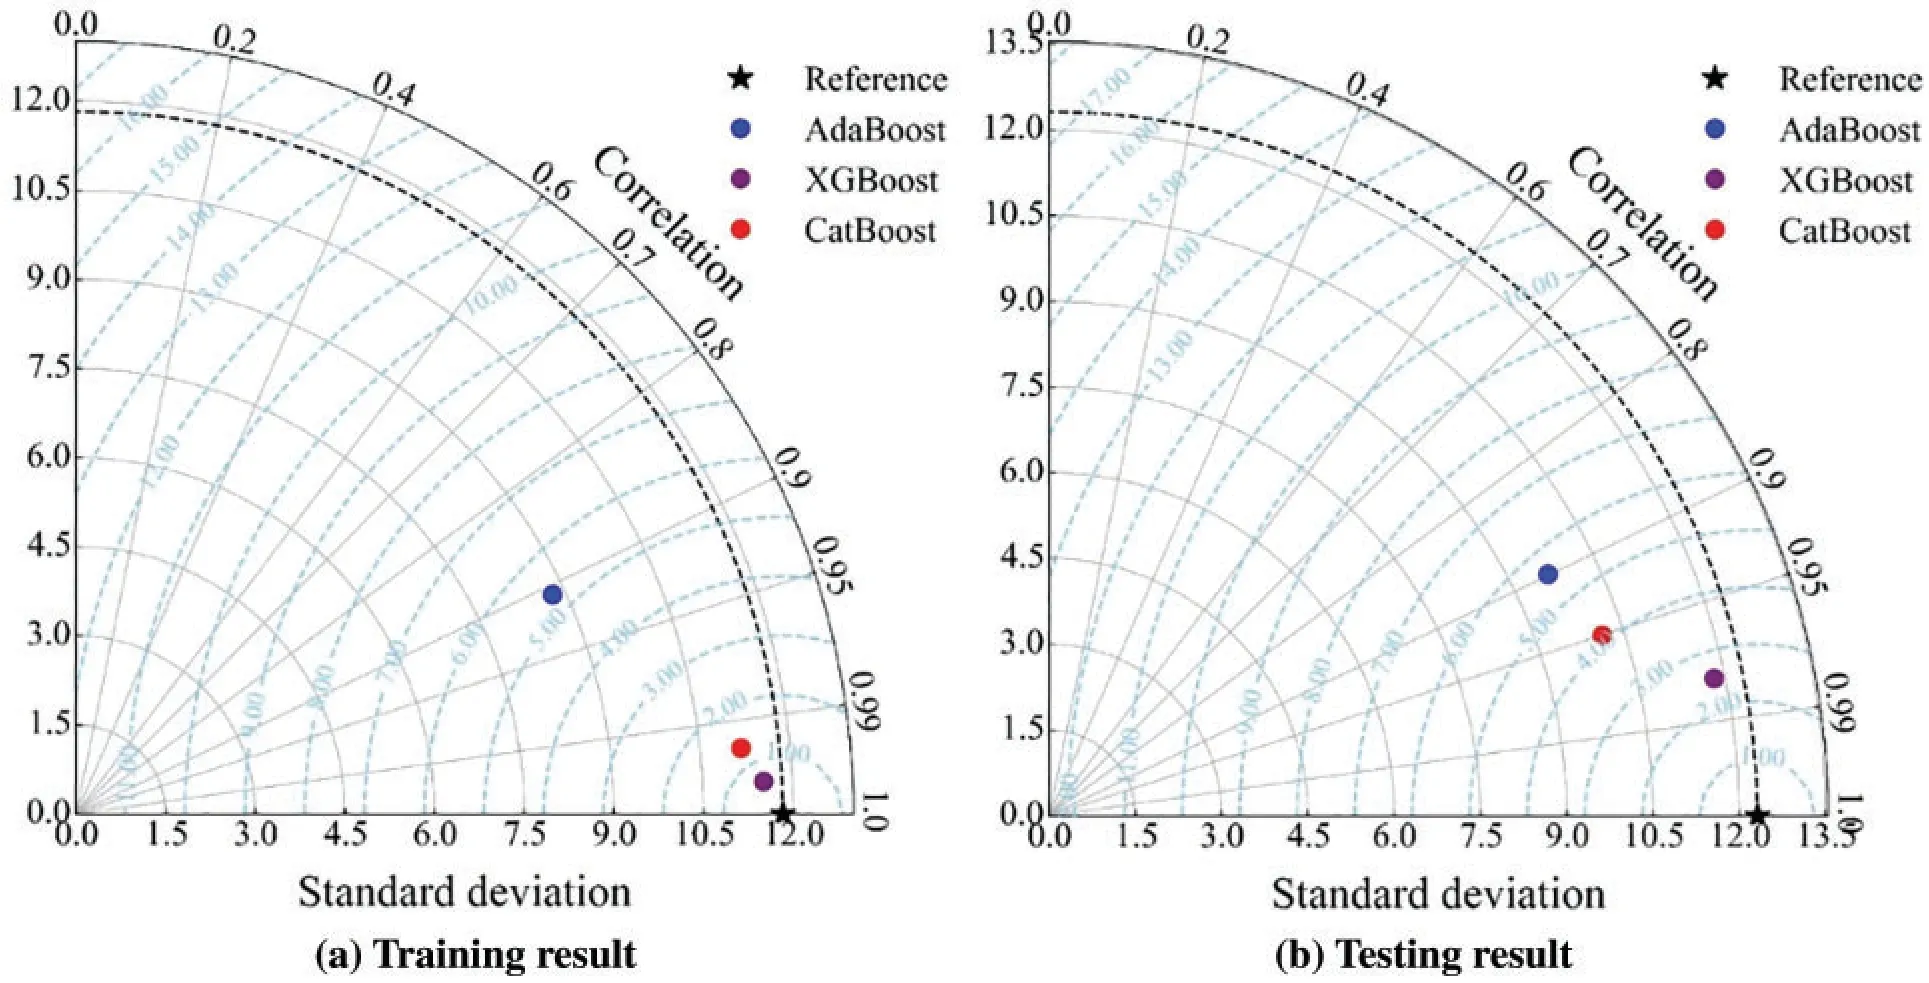
Figure 15:The Taylor diagrams of training and testing results
A ranking system comprised ofR2,RMSE,MAE,VAF,and A-20 index is implemented to rank the three models comprehensively,considering the performance in the training and testing processes.Table 7 presents the ranking system.There are three models,the score is from 3 to 1,and the model with better performance can get a higher score.For training or testing datasets,the total score is the sum of scores in five metrics.The final score of a model is the sum of scores in training and testing sets.The model with a higher final score has a preferable potential in both training and testing samples.The comprehensive performance ranking is:XGBoost>CatBoost>AdaBoost.
5.2 Model Comparison
In the previous section, XGBoost was selected as the most accurate model in this research to predict sandstone strength.In this section, XGBoost is compared with the best model proposed by Armaghani et al.[80],as shown in Table 8.In terms ofR2,RMSE,and VAF in training and testing sets,XGBoost can perform better than the imperialist competitive algorithm(ICA)-ANN.Not only that,ICA-ANN utilized the ICA to tune the weights and biases of ANN and had better ability than ANN,but the optimization process done by Armaghani et al.[80],was complicated and time-consuming.By contrast,XGBoost has fewer parameters to tune and is easy to use,and it has more strength to predict the UCS of sandstone samples.It is important to note that the ultimate aim of a predictive model for rock strength is to develop a model which should have several features,i.e.,be accurate enough,easy to apply as well as applicable in practice.Additionally, the performance of XGBoost for predicting UCS of rock is compared with other models proposed by other scholars recently,as shown in Table 9.XGBoost has more powerful ability to predict UCS than other models.

Table 7: The ranking system in three models

Table 8: Results of the models by Armaghani et al.[80]to predict rock strength
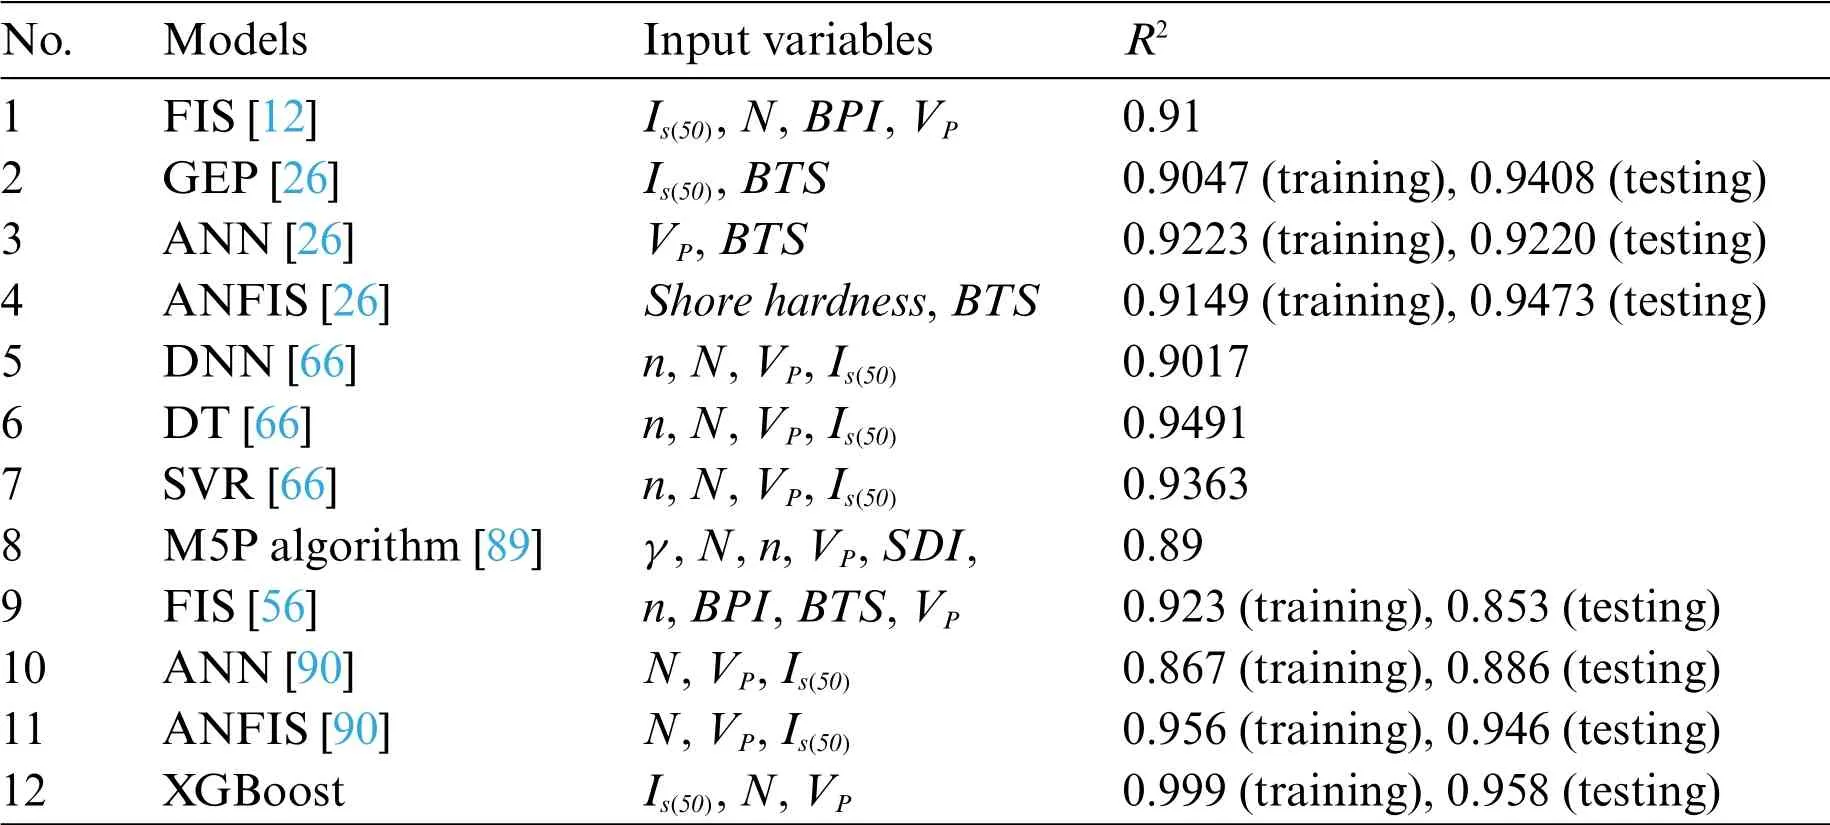
Table 9: Some models to predict UCS developed by other scholars
6 Model Validation
To validate the application of the proposed boosting trees,14 sandstone blocks were processed into standard specimens,andN,VP,Is(50),and UCS were measured.Nis range 13.3 to 34.7,VPis range 2030 to 2960 m/s,Is(50)is range 1 to 3.7 MPa, and UCS ranges 23 to 52 MPa.N,VP, andIs(50)were input to the developed XGBoost model.The predicted UCS ranges 30.2 to 62.8 MPa.Fig.16 compares the predicted and measured UCS.When the developed XGBoost is applied to the new datasets from other sandstone blocks,it achievesR2of 0.801 and RMSE of 9.2833.The ratio of the measured UCS to the predicted UCS is between 0.67 and 1.02, and the predicted UCS of the model is larger than the real UCS.The obtained results show that the proposed model has great engineering applications.The proposed model in this study is able to predict UCS of rock samples with an acceptable level of accuracy if a new set of input parameters (within the range of inputs used in this research) will be available.
7 The Relative Importance of Input Parameters
The relative importance of input features can be calculated during the growth of the tree [91].The significant parameters have a crucial impact on the performance of the model.Obtaining the relative importance of input parameters is beneficial to understanding the development principle behind the model.Fig.17a shows the relative importance ofN,VPandIs(50)in AdaBoost,XGBoost,and CatBoost.Although the importance ranking of input parameters is different in the three models,Is(50)is always the most vital variable.To determine the principal parameters affecting the UCS in sandstone, the importance score of each variable in three models is averaged.TheIs(50)is the most essential,with a 0.47 importance score,followed by 0.30,and 0.24 scores forVPandN,respectively,as shown in Fig.17b.Individual conditional expectation (ICE) plot is introduced to determine the influence of variables on the predicted UCS of XGBoost, as shown in Fig.18.Each line shows the predicted UCS of a sample varying when a variable of interest changes and other variables are fixed.The purple line is the average of all lines, which shows the mean relationship between the variables and predicted UCS.WhenVPandNare fixed,predicted UCS of XGBoost rises with the increasing ofIs(50).Similarly,the predicted UCS of XGBoost has a growing trend with the increase ofVPandN.
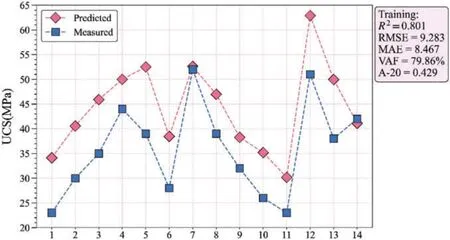
Figure 16:The predicted results of 14 validation datasets
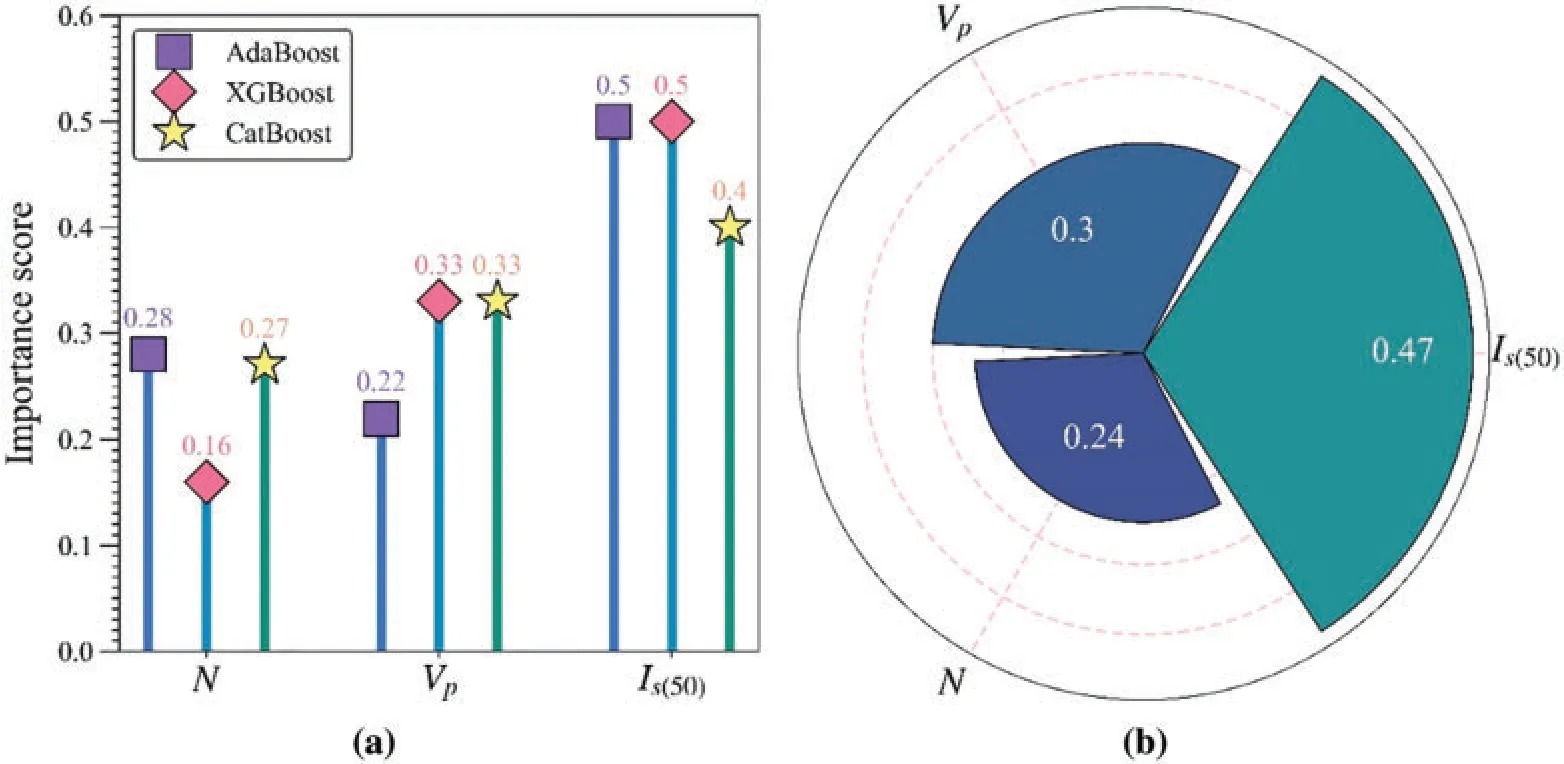
Figure 17:The relative importance of input parameters:(a)The variable importance in three models;(b)The mean importance of variables
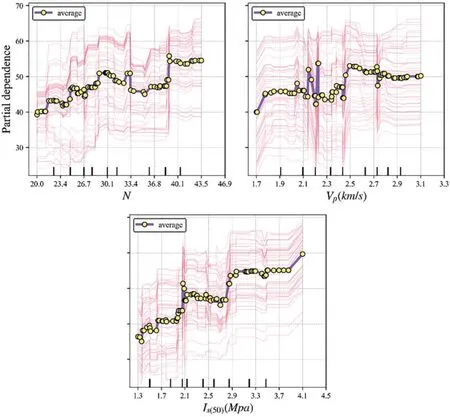
Figure 18:The ICE plot to analyze the dependence of variables on UCS
8 Conclusion
In this research, 108 samples were used to investigate physical and mechanical properties in sandstone.Tree-based models are implemented to build intelligent models for predicting UCS of sandstone based on the established database.Considering the training and testing performance by Taylor diagrams and ranking system, XGBoost is the outstanding tree model to predict UCS in sandstone.The proposed XGBoost model has more strong learning ability to build the relationship between considered factors and UCS than other models developed by other researchers.Additionally,XGBoost has fewer parameters to tune than other models,such as ANN and GEP,and it is simple to use.The developed boosting trees solution is suitable for practical engineering,such as mine,quarry,tunnel, etc., which need to evaluate the UCS of rock with non-destructive methods accurately and timely.However,the considered variables are limited,and only three parameters are applied to foretell UCS.Besides,the combination of XGBoost and optimization techniques can improve the capacity to estimate UCS.
Funding Statement:The research was funded by Act 211 Government of the Russian Federation,Contract No.02.A03.21.0011.
Conflicts of Interest:The author declare that they have no conflicts of interest to report regarding the present study.
 Computer Modeling In Engineering&Sciences2022年12期
- Computer Modeling In Engineering&Sciences的其它文章
- A New Childhood Pneumonia Diagnosis Method Based on Fine-Grained Convolutional Neural Network
- Explainable Artificial Intelligence-A New Step towards the Trust in Medical Diagnosis with AI Frameworks:A Review
- Some Properties of Degenerate r-Dowling Polynomials and Numbers of the Second Kind
- Static Analysis of Doubly-Curved Shell Structures of Smart Materials and Arbitrary Shape Subjected to General Loads Employing Higher Order Theories and Generalized Differential Quadrature Method
- Regarding Deeper Properties of the Fractional Order Kundu-Eckhaus Equation and Massive Thirring Model
- A Dynamic Management Scheme for Internet of Things(IoT)Environments:Simulation and Performance Evaluation
