通过模拟声发射研究增材制造零件中的损伤特性
2022-01-08 06:54:12朱祎楠姚欣悦CHIUWingkong
湖南师范大学自然科学学报 2021年6期
朱祎楠,姚欣悦,CHIU Wing-kong
(蒙纳什大学机械与航天工程学院,澳大利亚 墨尔本 VIC3168)
As one of the most promising technologies in the field of non-destructive testing and structural health monitoring,AE has been successfully applied in many engineering settings,such as material damage detection[1]and building structure health monitoring[2].In mechanical manufacturing,AE technology plays an important role in areas such as tool wear monitoring[3],rotating machinery defect inspection[4],and failure monitoring in the machining process[5]etc.,indicating that AE has the advantages of high sensitivity,rich information and wide applicability.
Defect and failure in additive manufactured parts also show elastic wave characteristics,which is closely related to the phenomenon of AE.Hence,AE signal analysis can be implemented to assess damage in additive manufacturing (AM).For example,in-process monitoring of laser powder bed fusion manufacturing can provide an early alert if the process exceeds preset limits of the parameters by acoustic emission technology[6].Meanwhile,addition,acoustic signals from a real powder-bed fusion AM process can be collected for investigating porosity contents inside the workpiece[7].Therefore,the AE method is an efficient choice for studying the damage in 3D printed parts and printing conditions.
As a relatively common problemin AM,the porosity problem will impose negative effects on the mechanical properties of 3D printed parts.Some previous researches make use of the AE inspection method for detecting this problem.For example,Shevchik et al.[7]utilise AE signals to achieve real-time process quality control by comparing three different porosity contents:0.07%,0.3% and 1.42%.Most of the works focused on investigating the effect of porosity content percentages on wave propagation,but porosity position will also have a crucial influence on AE signals.So further studying wave propagation characteristics associated with different porosity positions can help people find cavity or hole locations in a real application.
To investigate wave propagation characteristics of two additive manufactured aluminium plates with different cavity positions under a uniaxial tensile loading test,this paper project will conduct finite element analysis for obtaining desired data and apply signal analysing strategies,including Fast Fourier Transform (FFT)and 2D-FFT.Each of these two plates has only one cavity,but the position of the cavity is different (one with 50% position,another with 75% position).The crack growing along the cavity has already occurred to simulate what will happen under the tensile test.And a transient loading will be exerted on the crack surface to excite elastic wave in the plate to simulate acoustic emission scenario.Finite element analysis (FEA)can show the advantage in this project because such a model is difficult to achieve through actual 3D printing,because porosity will randomly occur and distribute.
This work will start with a brief description of methodology.Then,the data will be collected from nodes with different distances from the source (crack)and carry out four types of data analyses:waveform analysis,AE parameter analysis,frequency domain analysis and wavenumber-frequency domain analysis.Discussions and conclusions will be based on what different wave propagation characteristics are reflected from the two plate models through these four analyses.
1 Methodology
Since the plate is symmetric,just half of the plate can be simulated for simplification.Figure 1 and 2 illustrate the half of the two plate samples which will be applied in FEA,and the coordinate (X,Y,Z)is labeled in Figure 1.One of the plates has a cavity in the middle and another plate has a cavity located at the position with 75% of the total thickness distance (10 mm)from the top surface.For simplification,these two models are named as 50% position sample and 75% position sample.The distance from the centre of the cavity to one end of the plate is 120 mm.
According to the definition of acoustic emission,it is the spontaneous release of local stress energy in the form of transient elastic waves when a material undergoes irreversible changes in its internal structure.Hence,a transient loading will be applied along tensile direction on the crack surface to simulate the acoustic emission scenario.The crack surface is extremely small,so it can be assumed that this area is the crack front and load can be applied on this surface.Figure 2 illustrates how the simplified loading and boundary condition is applied on the models.
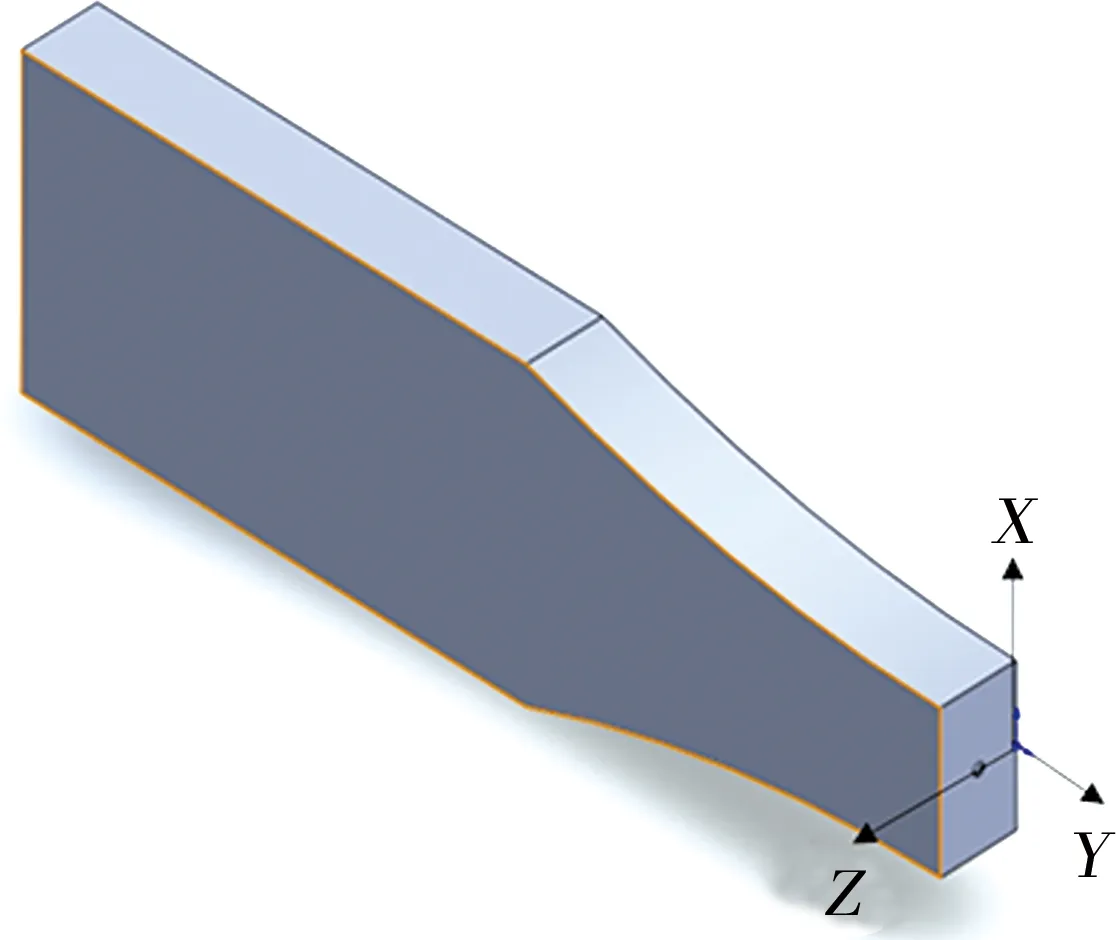
Fig. 1 Half of the aluminium plate model
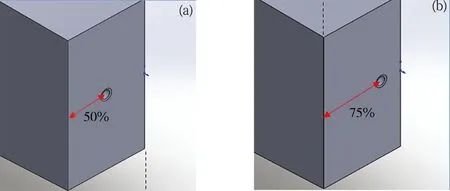
(a)50% position model;(b)75% position modelFig. 2 Illustration of two models with different defect positions
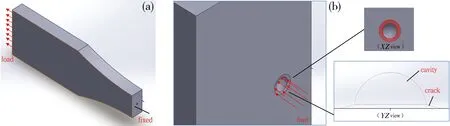
(a)Loading and boundary condition for the classic uniaxial loading test(b)Transient loading on the crack surface along tensile direction and the fixed boundary conditionFig. 3 Comparison of the classic uniaxial tensile test and the simplified scenario
Since it is subjected to uniaxial tensile loading,the classic loading and boundary condition setting is illustrated in Figure 3(a).Tension will be applied at one end surface,and a fixed boundary condition will be applied on the other end surface.However,one of the most important features in this sample is the cavity with its crack,so that this is a discontinuity problem.The classic finite element method for this kind of tensile loading test on the discontinuity model cannot give accurate results.An improved finite element method,called the extended element method.is introduced to solve this situation.The extended finite element method (XFEM)is a numerical technique based on the generalised finite element method (GFEM)and the partition of unity method (PUM).XFEM extends the classical finite element method (FEM)approach by enriching the solution space for solutions to differential equations with discontinuous function.XFEM should be implemented by inserting relating codes into commercial finite element software,so it is more complex than the classic finite element method.Therefore,for simplification,FEM inserted in the commercial software ABAQUS is applied for simulation in this research.A transient loading is applied along tensile direction on the crack surface to simulate the acoustic emission scenario,so that the direction of the wave propagation will be along the tensile direction (i.e.,negativeYdirection).The crack surface is extremely small,and it can be assumed that this area is the crack front.Meanwhile,the fixed boundary condition will be applied on the same surface as the classic uniaxial tensile test.Figure 2(b)illustrates how the simplified loading and boundary condition are applied on the model.The shape of the cavity and crack are presented from bothX,ZandY,Zview in Figure 3(b).The radius of the cavity is 0.5 mm (the cavity is treated as a hollow sphere),and the angle between the crack side and the horizontal line is inYZview 20°.
One commonly used signal analysis method is Fast Fourier Transform (FFT).Fourier analysis converts a signal from its original domain (often time or space)to a representation in the frequency domain and vice versa.And two-dimensional Fast Fourier transform (2D-FFT)can convert the time and spatial data to the wavenumber and frequency domain.In this project,FFT and 2D-FFT are applied for frequency domain analysis and wavenumber-frequency domain analysis,respectively.
2 Results
2.1 Waveform Analysis
Waveform analysis is focused on comparing the wave shape of the 50% position sample and 75% position sample (Figure 4).Waveform plots of displacement and time are extracted at five nodes,which are located at 10,20,30,40 and 50 mm from the loading source on the top surface (the coordinates of these five detected nodes are [0,-10,10],[0,-20,10],[0,-30,10] ,[0,-40,10] and [0,-50,10]),to see the effect of distances on the wave shape.

Fig. 4 Waveform plots of 50% position vs 75% position in-plane displacement at top surface
From these waveform plots (Figure 4),the wave shape changes gradually with time.The waveform plot of 50% position sample shows that the waveforms of 50% position sample are oscillating up and down around the equilibrium position.However,waveforms of the 75% position sample are irregular.The reason for this phenomenon is due to a highly dominant low frequency in the 75% position sample,which will be filtered out for next analyses.
Therefore,comparing the two samples by directly observing the shape of the wave,it is obvious that there is an obvious difference between them.This can be used as an important feature to distinguish different cavity positions.And the reason for the wave shape change with time is that in a thin plate,since different frequencies propagate at different phase velocities,the propagation is dispersive.
2.2 AE Parameter Analysis
In this analysis,three fundamental AE parameters are extracted based on the previous waveform plots.These AE features including peak amplitude,rise time and RA,were associated with irreversible processes in the material.
It should be noticed from Figure 5 that the peak amplitude is normalized to the value at 10 mm.Obviously,the peak amplitude of both two plates experiences strong decreases with distance,and it finally reduces to 50% or even less of the corresponding value measured at the first node (10 mm).By comparison,the peak amplitude of 50% position sample drops more significantly than the 75% position sample.
The second parameter is the rise time,which is defined as the delay between the onset and the time of peak amplitude.As showh in Figure 6,the rise time grows with distance though there are some fluctuations.In addition,it can be found that the rise time starts at a very low value for the near-by node,approximately below 5 μs.And it increases as the wave propagates away and becomes roughly over three times longer for the furthest node at 50 mm.
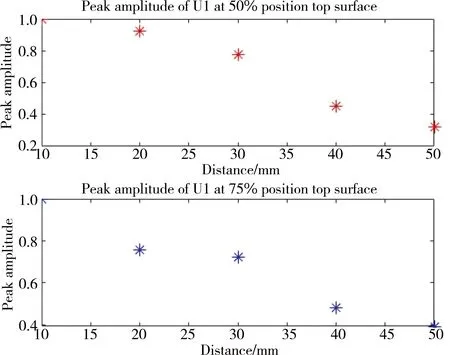
Fig. 5 Peak amplitude of 50% position VS 75% position in-plane displacement at top surface
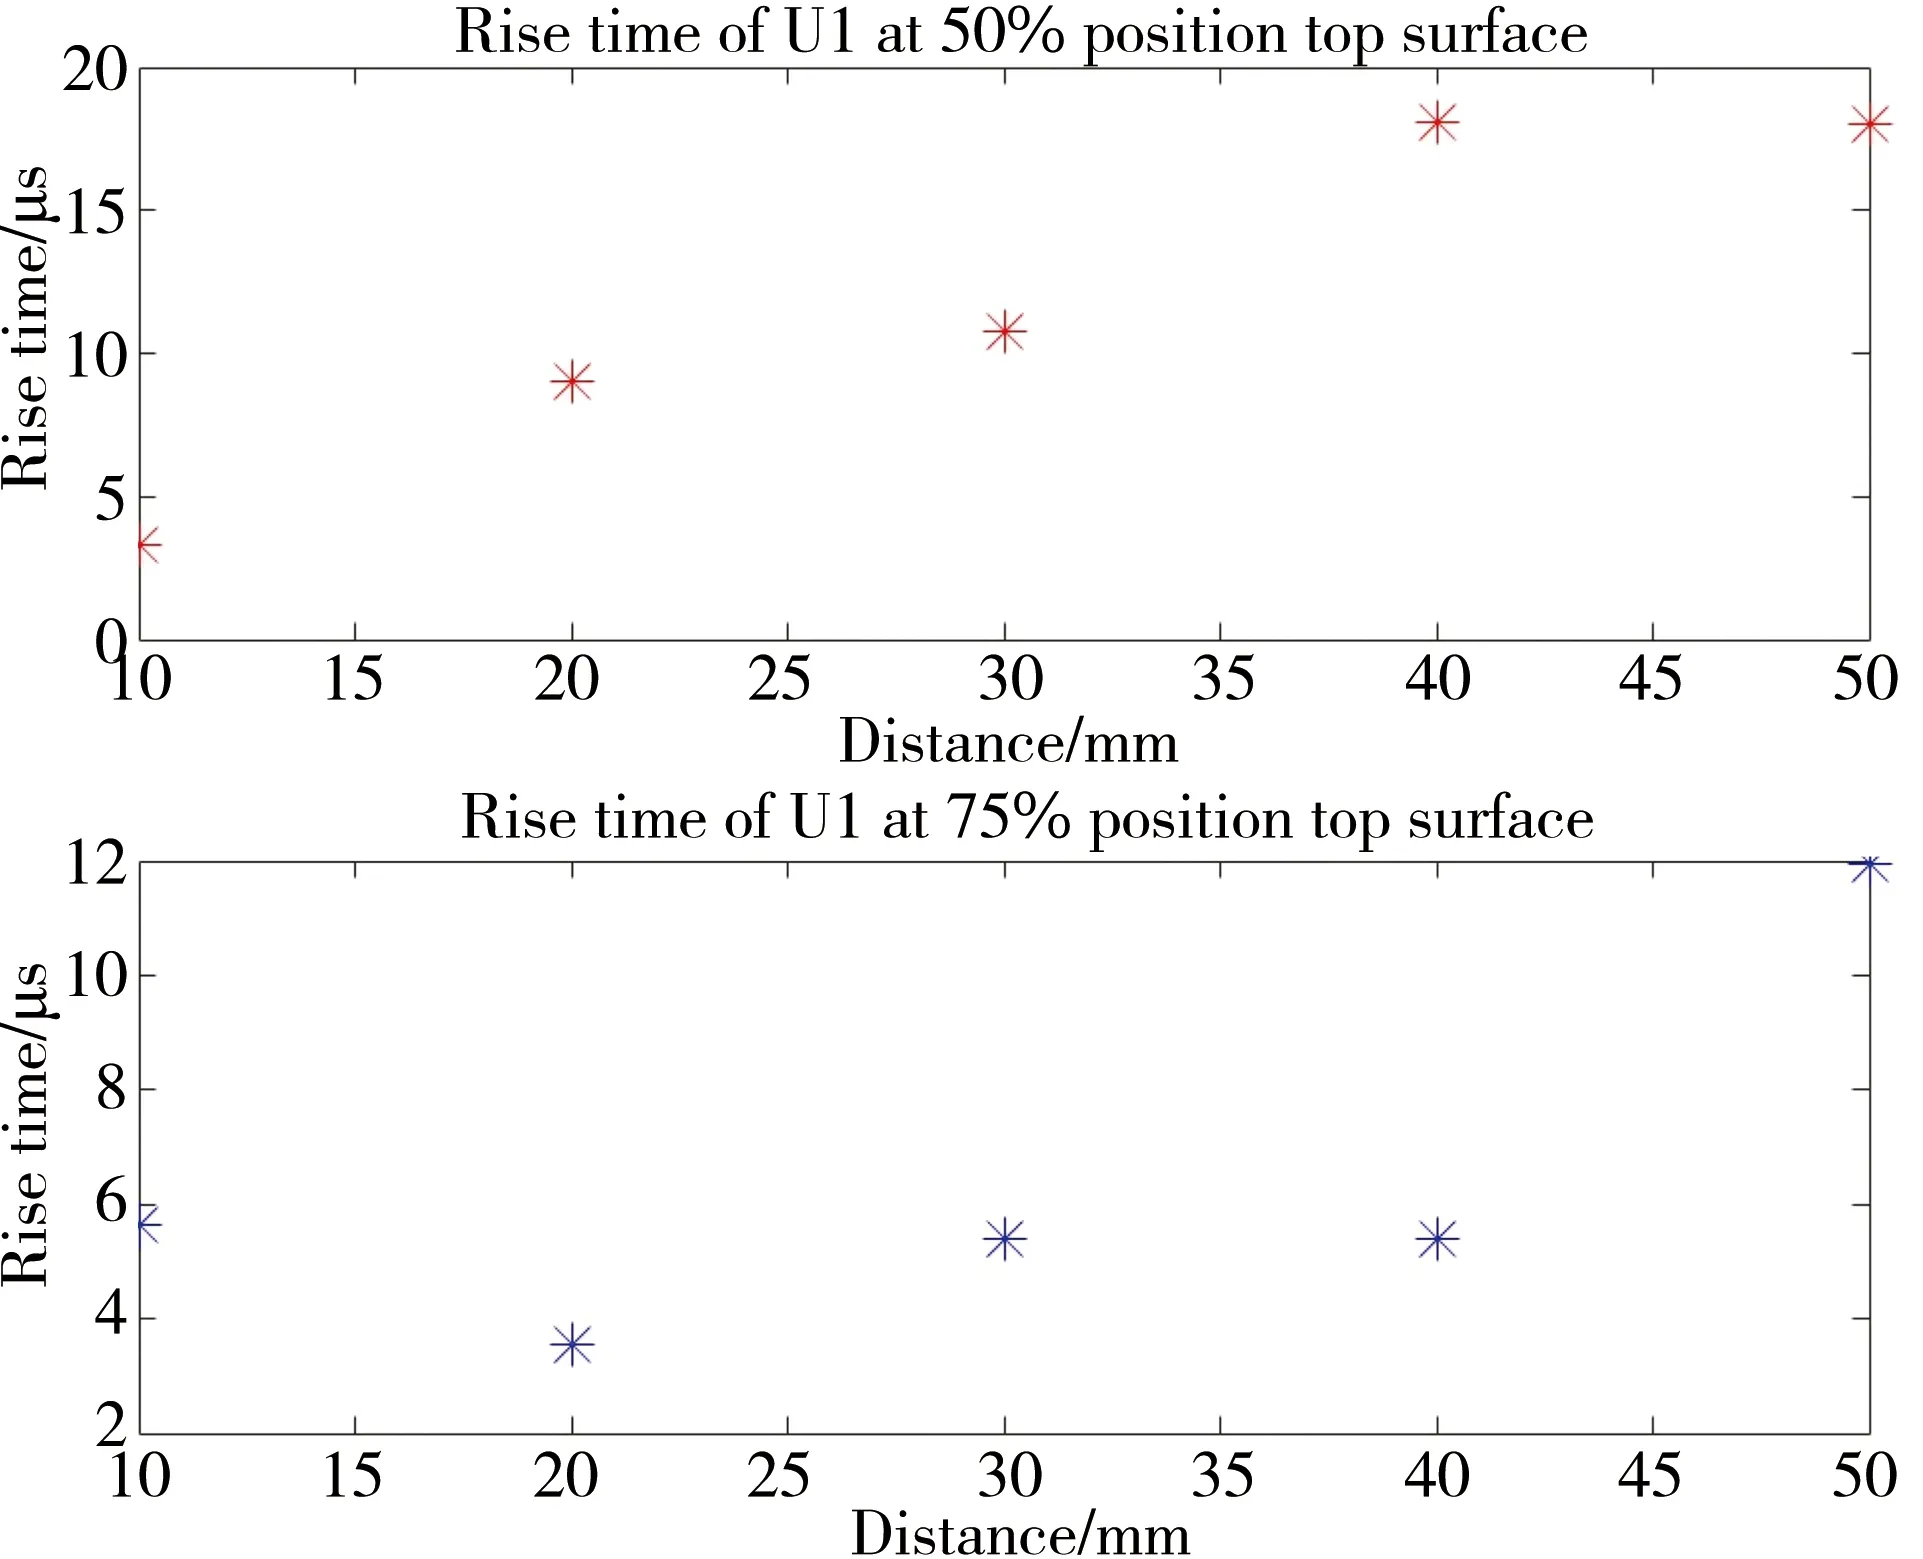
Fig. 6 Rise time of 50% position VS 75% position in-plane displacement at top surface
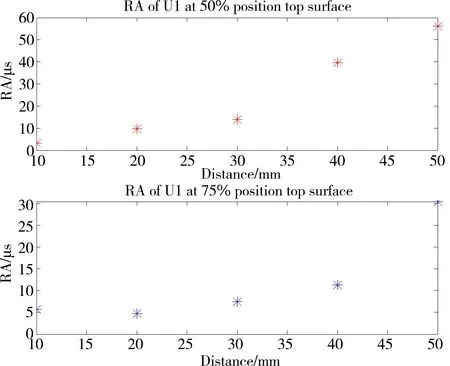
Fig. 7 RA of 50% position vs 75% position in-plane displacement at top surface
The ratio of rise time divided by peak amplitude is symbolised by RA.Since rise time will increase and peak amplitude will decrease,it is projected that RA will show a rising trend with distance.Figure 7 verifies the prediction and show a stronger increasing trend.The RA value of the 50 mm node increases to about nearly 30 times larger than that the start node.
2.3 Frequency Domain Analysis
In this analysis,Fast Fourier Transform is applied to convert the data from time domain to frequency domain.The data from time domain is extracted from the five distances that are the same as the previous analysis.Central frequency and peak frequency are two important parameters that will be focused on.
The central frequency in Figure 8 is normalized to the corresponding value at 10 mm.Central frequency does not exhibit significant changes with distance.It only fluctuates slightly within about 15%,without showing an obvious relationship with distance.Since there is no clear difference between 50% and 75% position samples,it is hard to distinguish these two samples by only central frequency.
Also,the peak frequency in Figure 9 is normalized to the value at 10mm.It is indicative that this frequency experiences more significant fluctuations than central frequency,and it fluctuates approximately within the 60% range.By comparison,the 50% position samples has more violent oscillation than 75% position samples,because a predominantly low frequency has been filtered out to obtain normal waveform of 75% position sample.
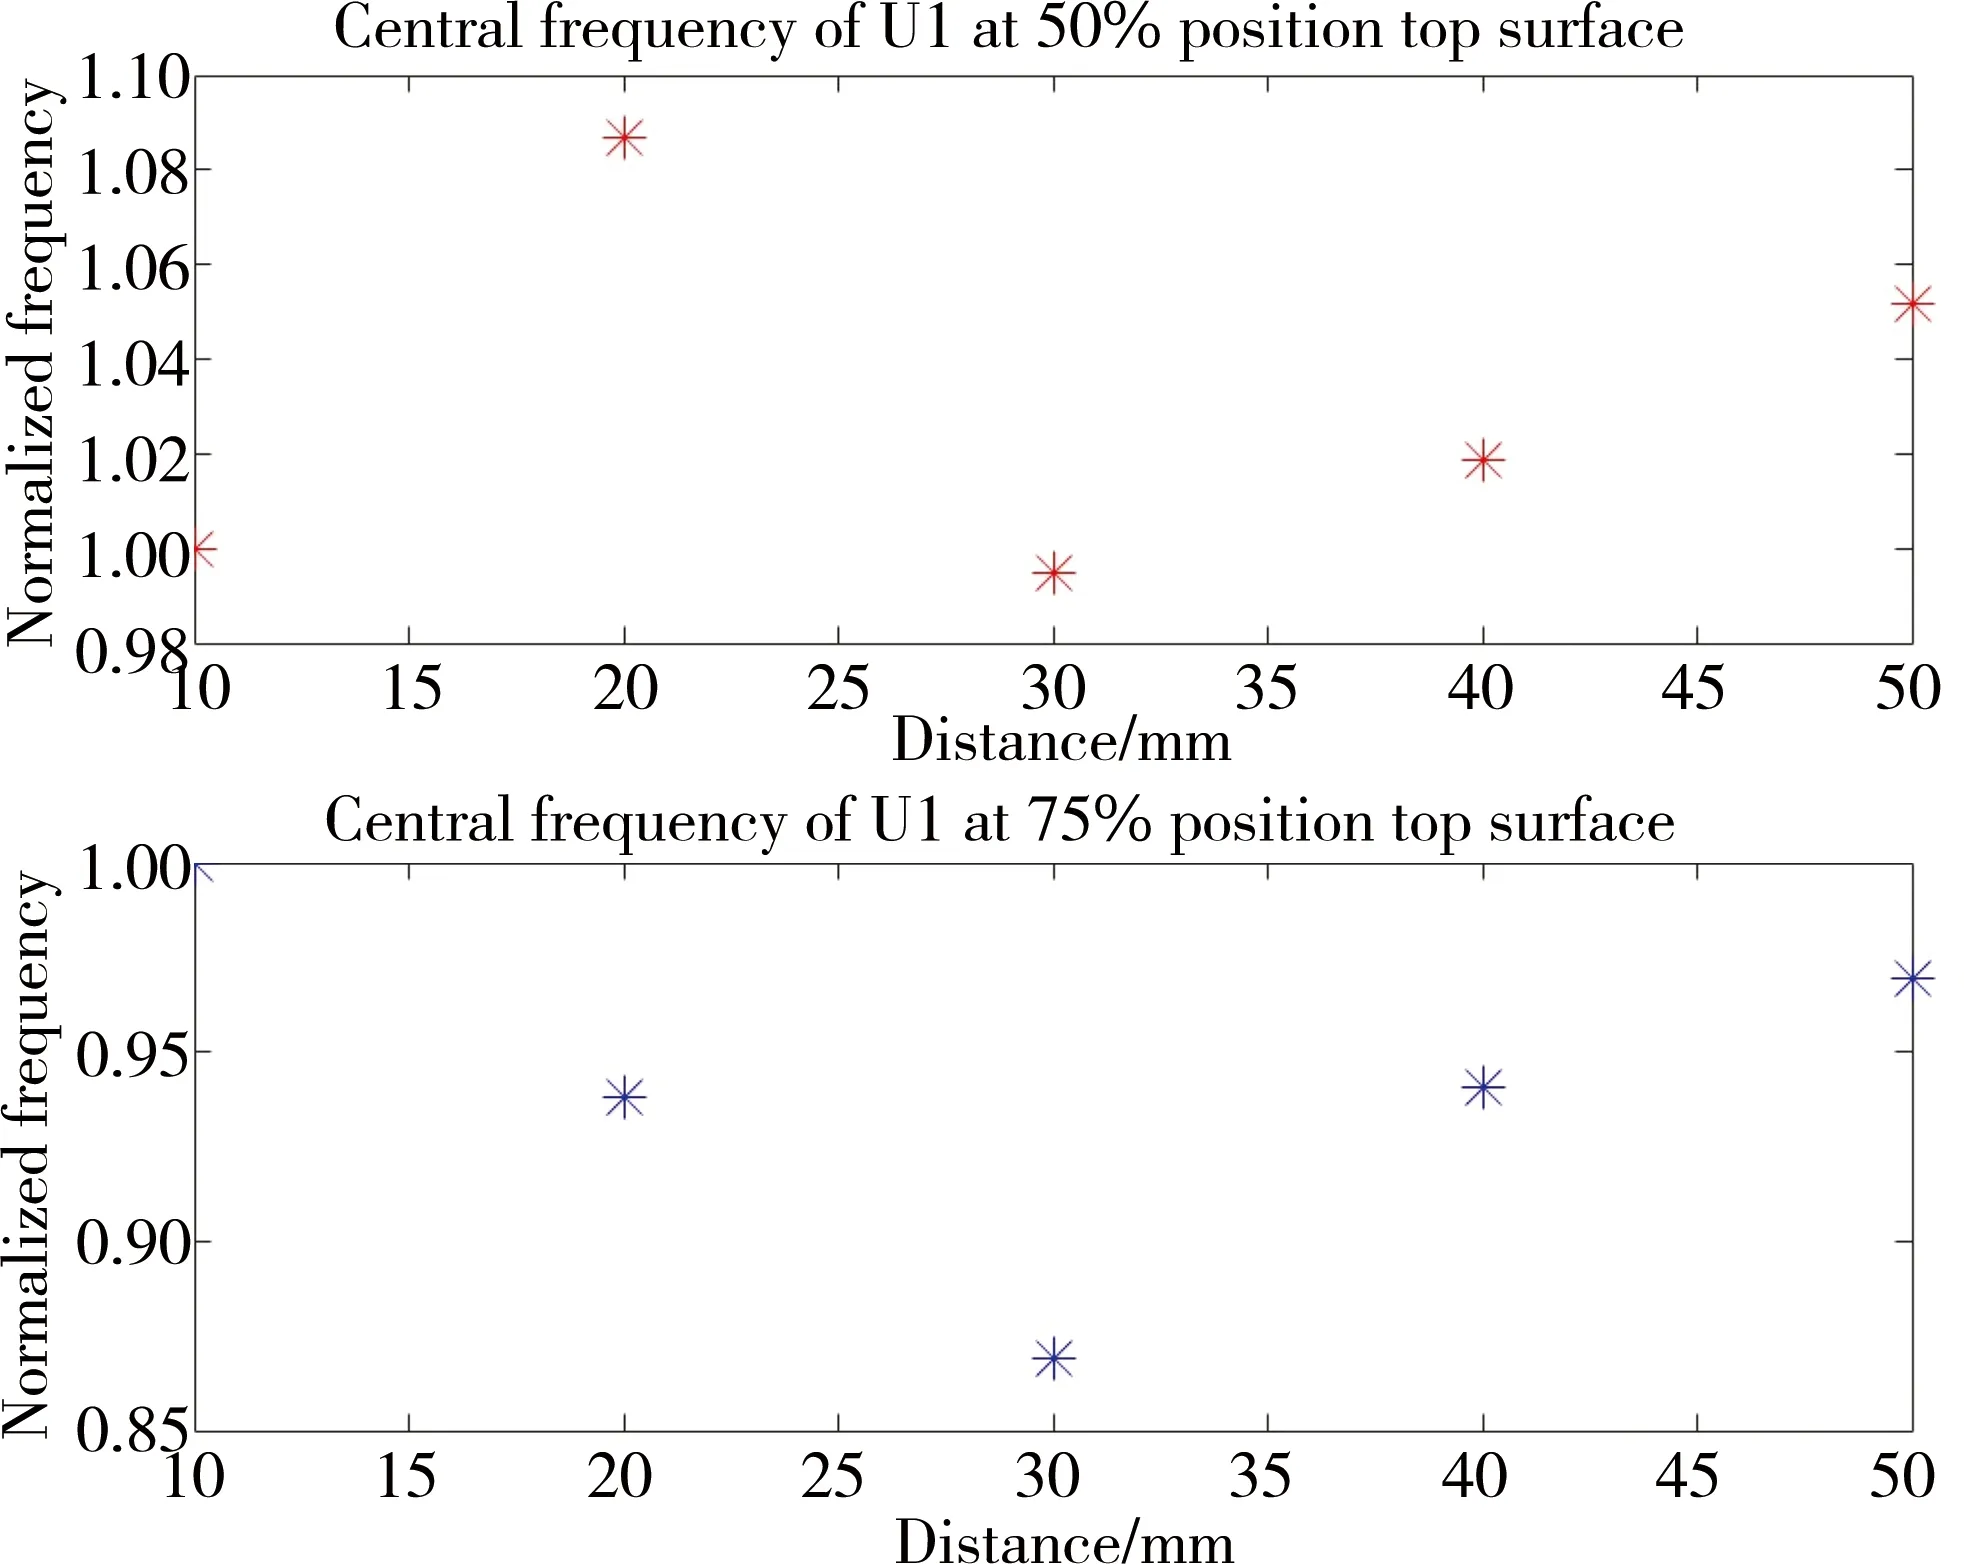
Fig. 8 Central frequency of 50% position vs 75% position in-plane displacement at top surface
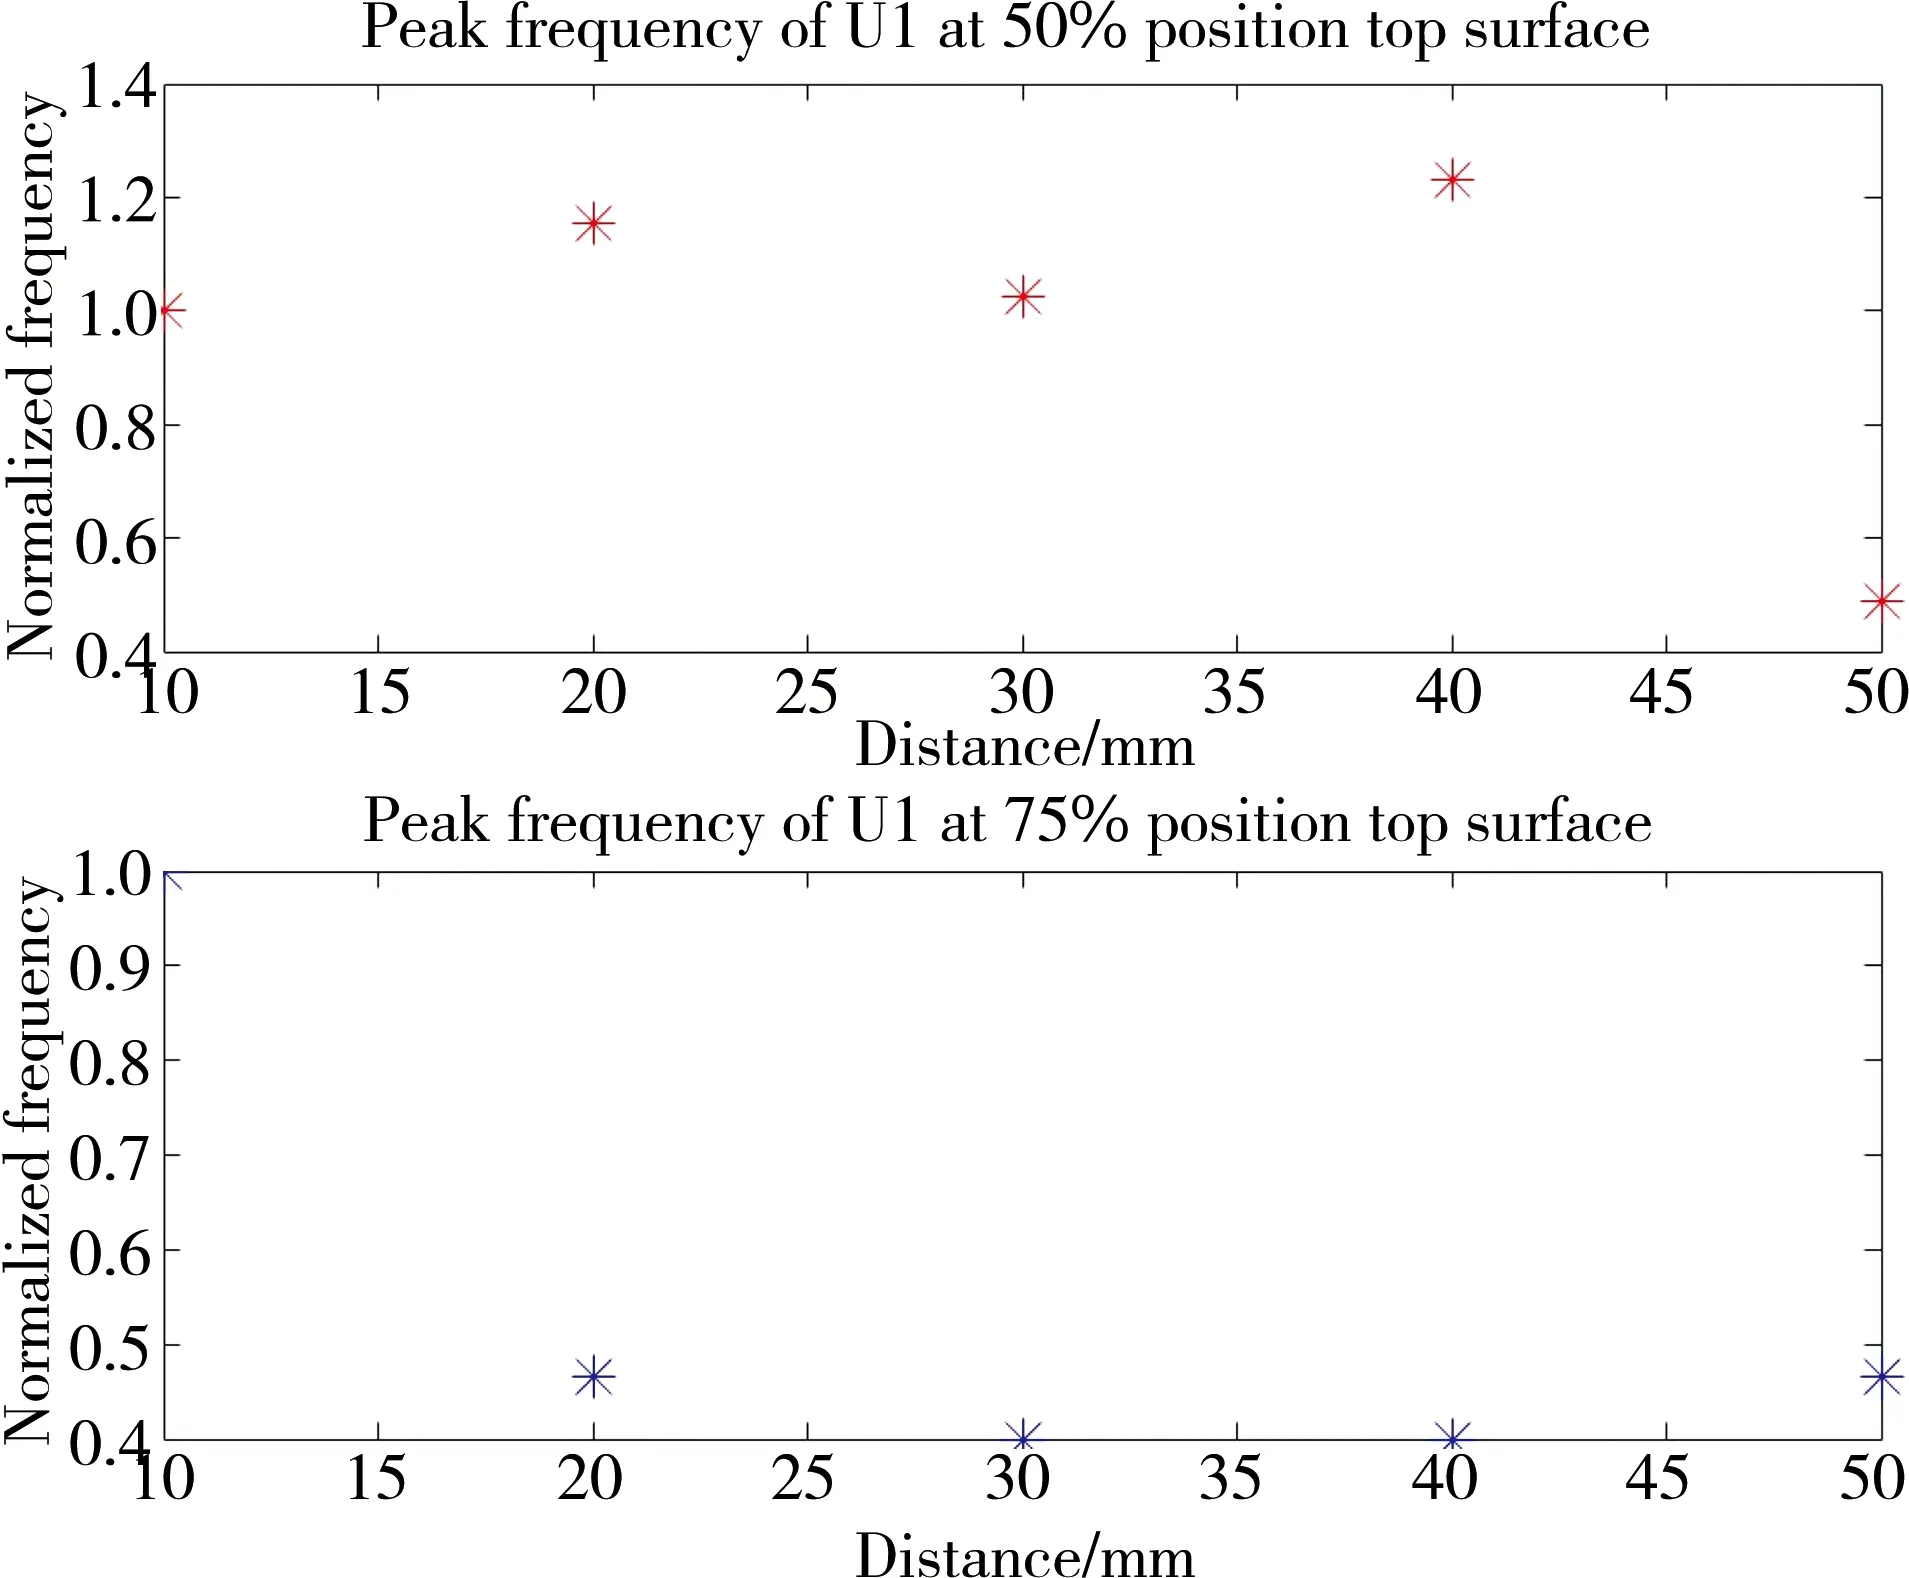
Fig. 9 Peak frequency of 50% position vs 75% position in-plane displacement at top surface
2.4 Wavenumber-Frequency Domain Analysis
In a thin plate structure,the AE signal produced by the defect within the structure can be decomposed into various Lamb wave modes.Therefore,investigating Lamb wave characteristics can help assess the state of the defect and inversely use these features to inspect the damage.The Lamb wave has high research significance due to the fact that it can propagate over long distances in the form of wave packets without significant attenuation[8,9].Lamb waves have two main characteristics:dispersive and multimodal.The dispersion is because the velocity of a propagating wave varies with the frequency,which increases the wave packet duration and attenuates the amplitude.“Multimodal”means the Lamb wave consists of several symmetric and antisymmetric modes.These two main characteristics can be clearly reflected from the Figure 10 of Lamb wave dispersive curves,and four conclusions can be drawn from the dispersion curve plots:
1)There are at least two modes,S0 and A0,for each frequency.
2)Except for the S0 and A0 modes,all modes have threshold frequency,and the Lamb wave of this mode can not be excited under the condition of lower than the threshold frequency of this mode.
3)The number of modes increases with frequency increasing.
4)The dispersion phenomenon occurs in every mode.
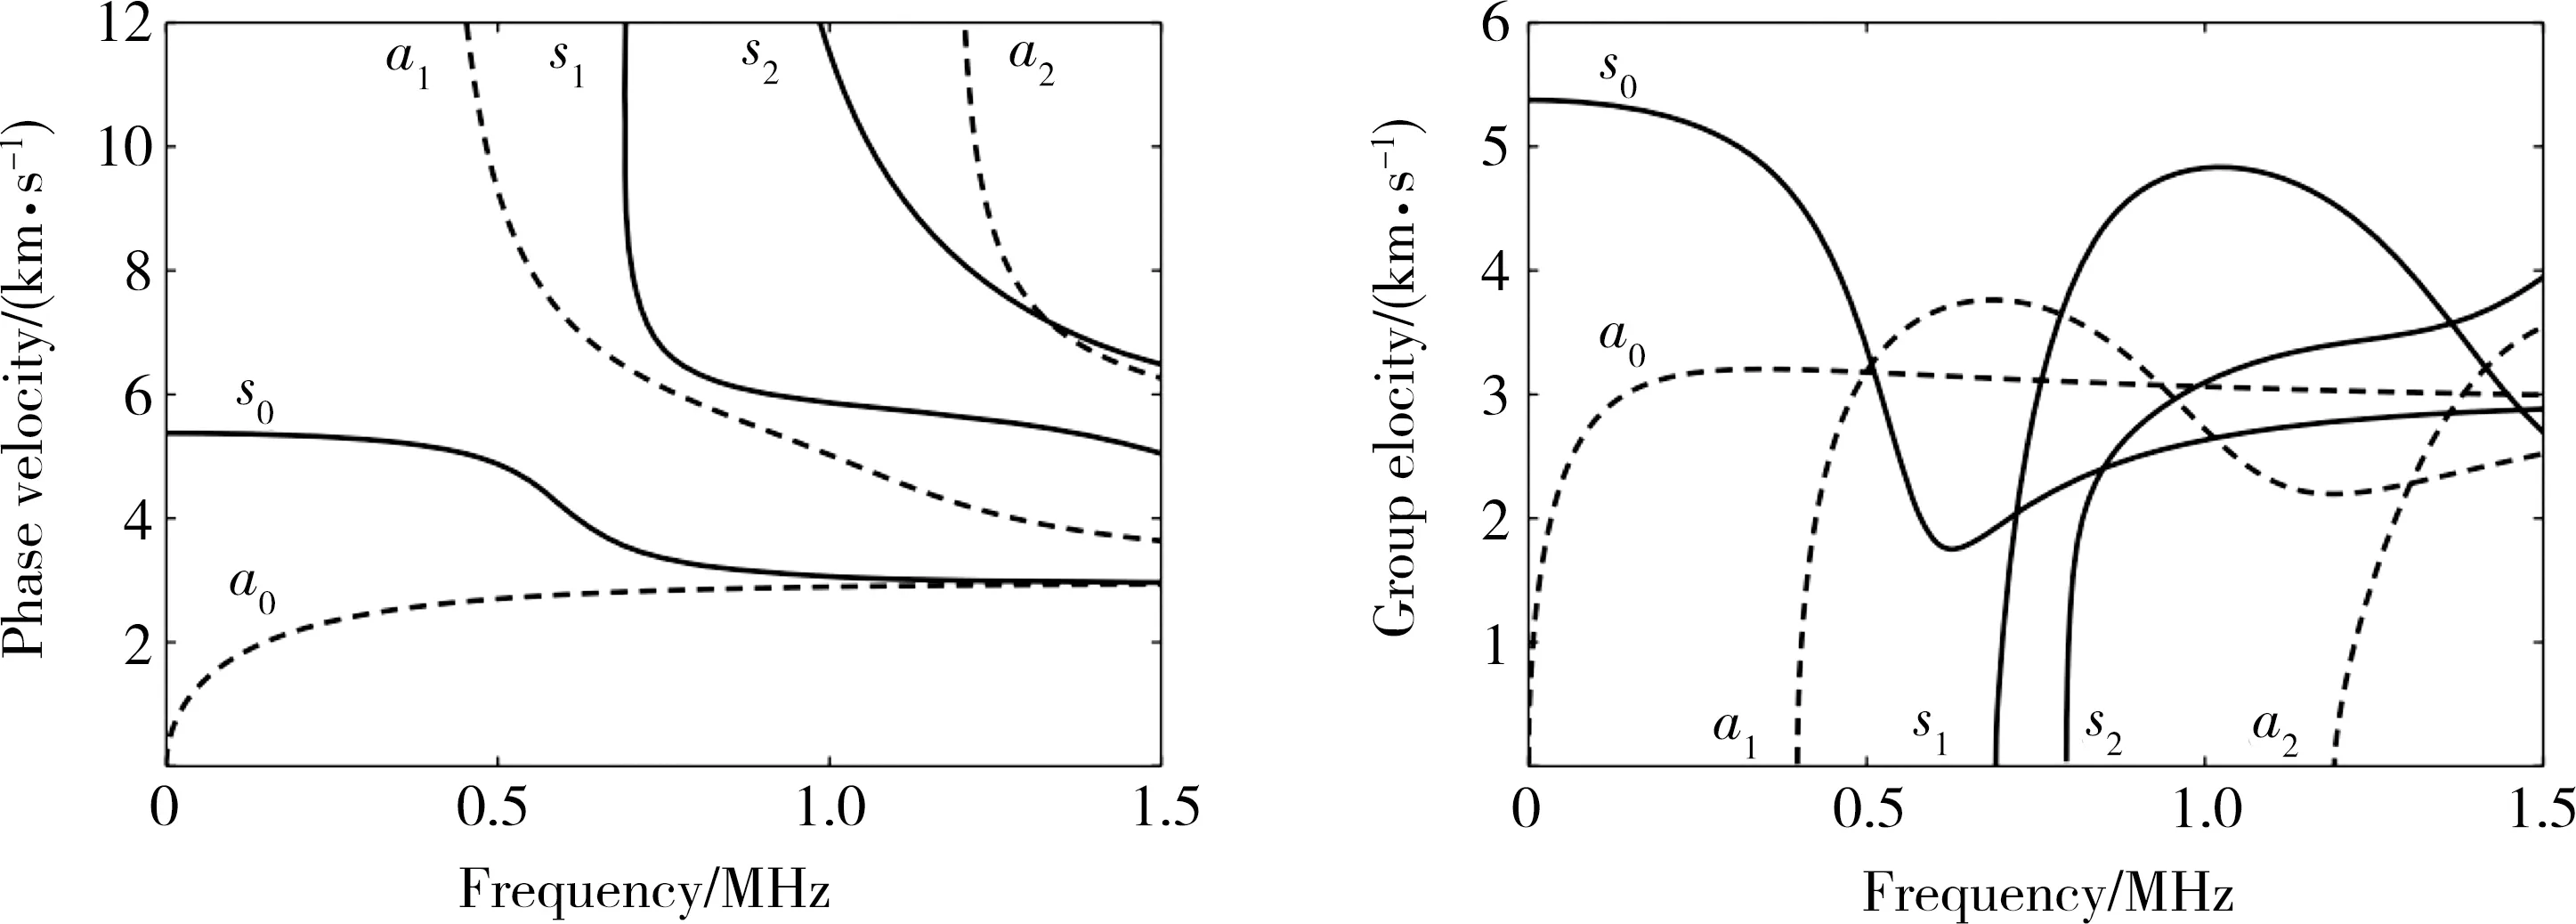
Fig. 10 Dispersion curves of phase velocity and group velocity[10]
Different wave packets or Lamb wave modes overlap each other in the time domain.Thus,the dispersion reduces the spatial resolution and makes the interpretation of the signal challenging.To solve this problem,2D-FFT as a promising tool can convert data from the time-space domain to the wavenumber-frequency domain,achieving mode separation.The 2D recorded data are equally measured both in time and space.Then Lamb wave modes can be separated in wavenumber-frequency spectrum via 2D-FFT.For higher resolution,data are extracted from 20 equally spaced nodes instead of 5 nodes for previous analysis.
In Figure 11 of time-space domain data,the closer to the yellow,the greater the displacement it is.It is obvious that in the red rectangle region,the wave is propagating away from the crack.
For the spectrum of the 50% position sample (Figure 12),the yellow region is mainly located at S1 and A1 modes,which means that S1 and A1 modes have the maximum energy.Hence,A1 and S1 modes are predominant among all the Lamb wave modes for 50% position sample.
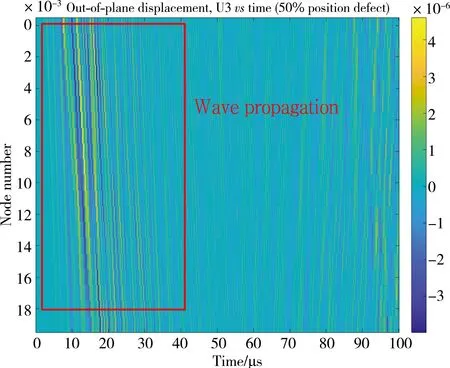
Fig. 11 11 Data in time-space domain
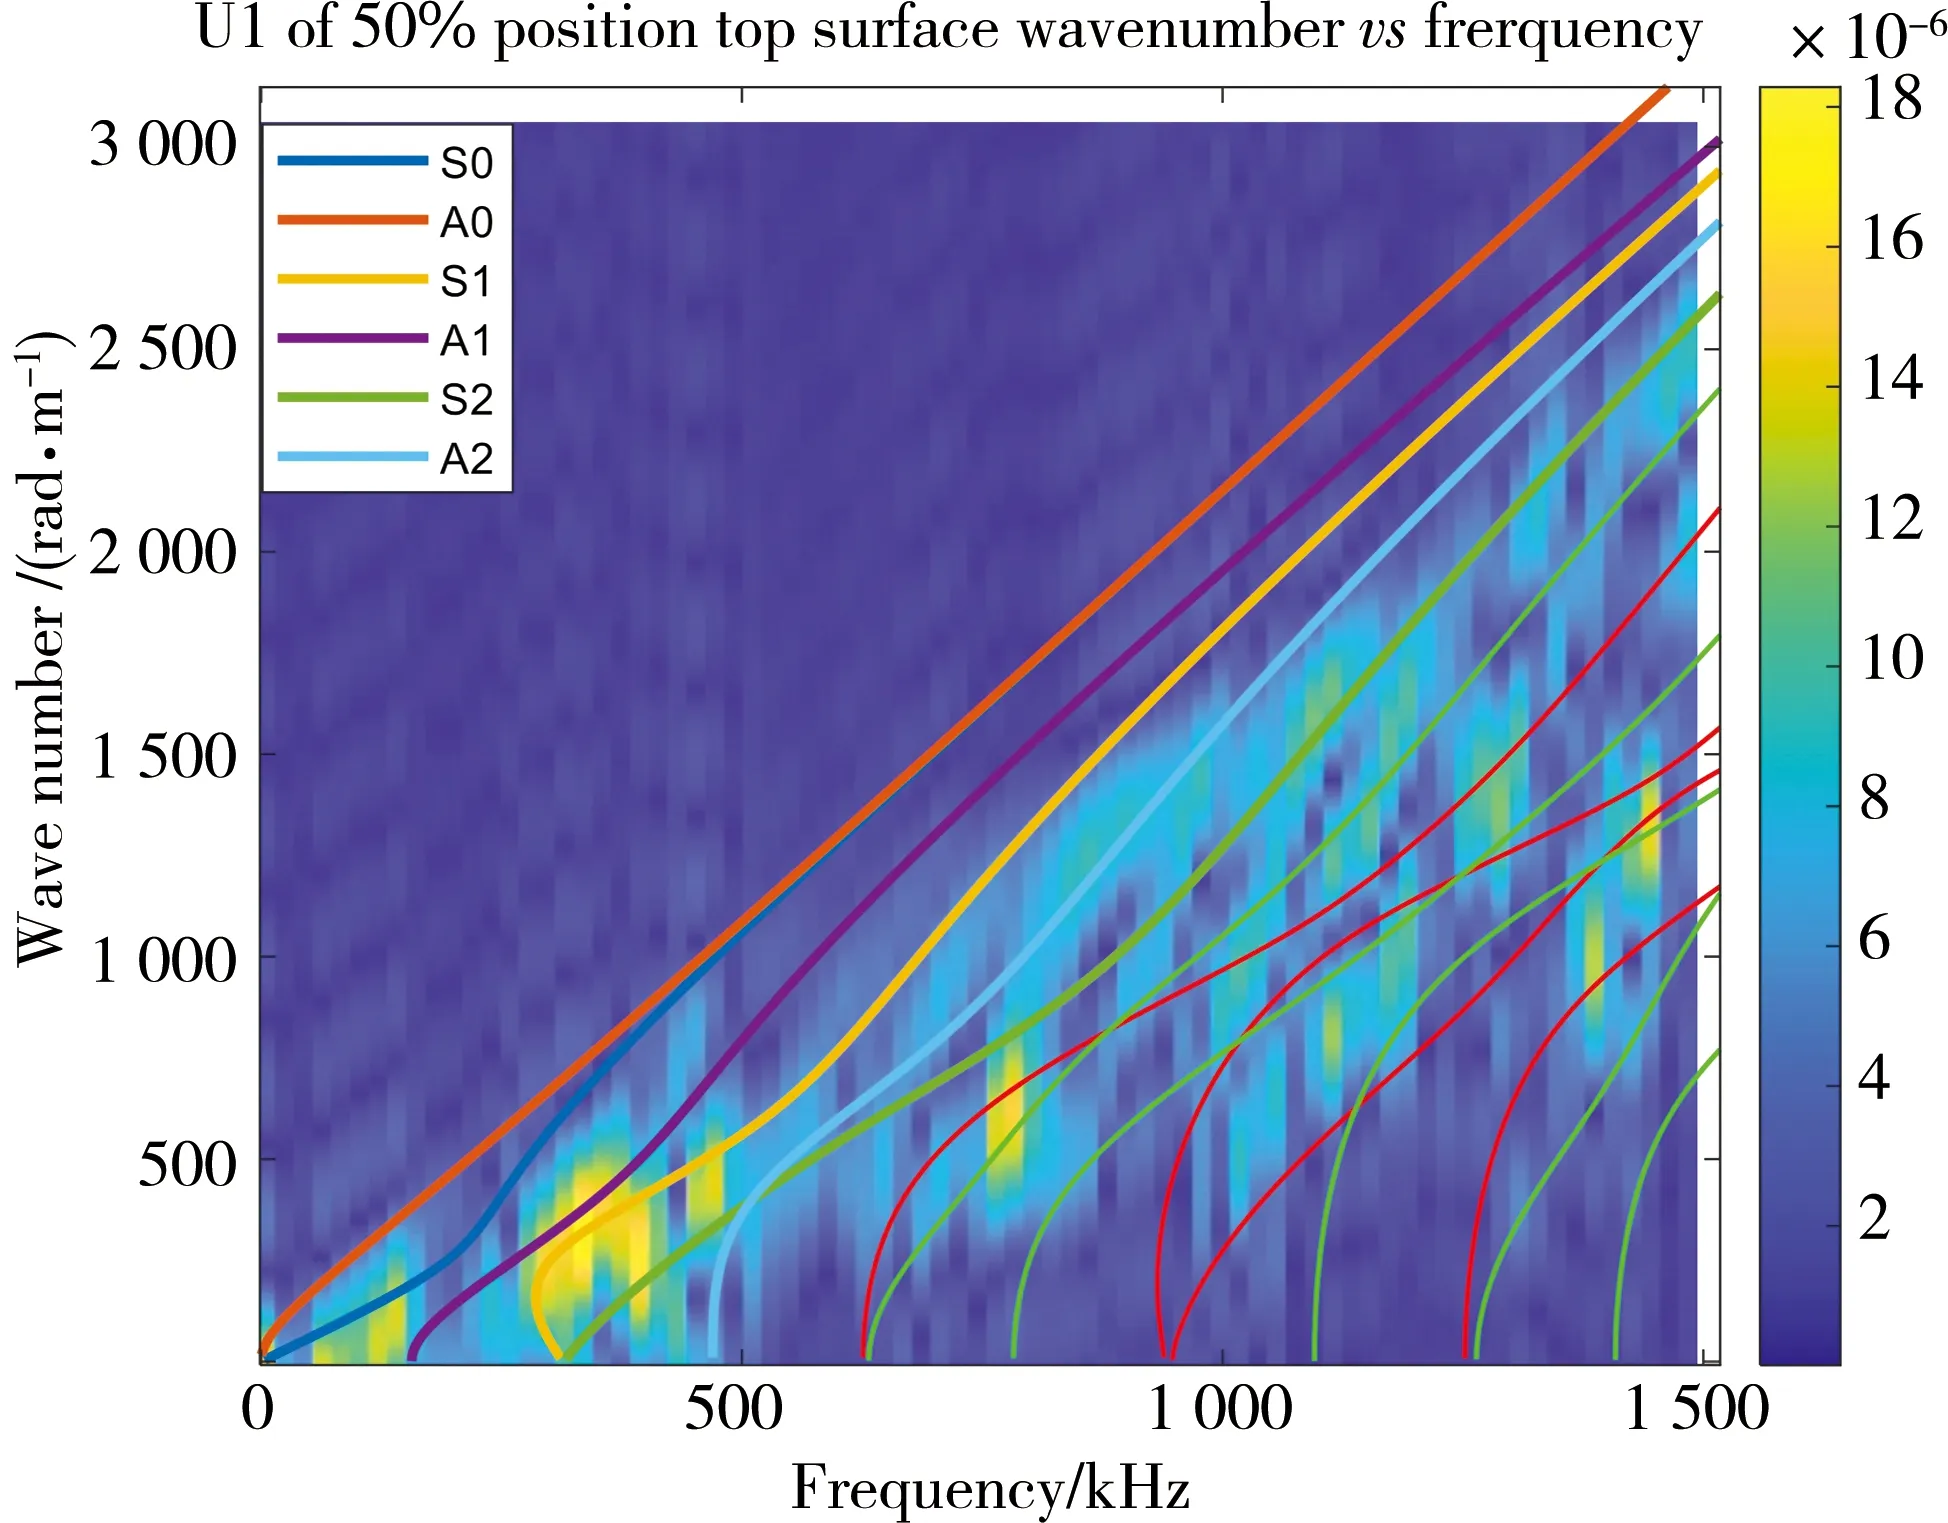
Fig. 12 Wavenumber-frequency spectrum of 50% position in-plane displacement at top surface
In contrast,for 75% position sample,the dominant mode is dependent on whether it focuses on in-plane or out-of-plane displacement.For Figure 13(a),S0,S1 and A1 share the maximum energy.For Figure 13(b),it shows remarkable characteristics of A0 mode,and S1 and A1 modes are also strong.
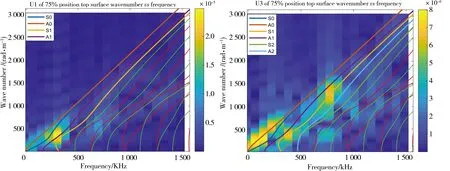
(a)Wavenumber-frequency spectrum of 75% position in-plane displacement at top surface;(b)Wavenumber-frequency spectrum of 75% position out-of-plane displacement at top surfaceFig. 13 Wavenumber-frequency spectrum of 75% position model
By comparing the simulated data with theoretical data,it shows which lamb wave mode is most dominant or shares the highest energy.The colour maps have obvious differences between 50% position samples and 75% position samples.But one thing the two plates have in common is that there are high-energy Lamb wave patterns around 300 kHz in both plates.
3 Conclusion
This study presents a numerical study of wave propagation in two aluminium additive manufactured plates.The novelty of this work is to conduct four types of analyses to comprehensively see the effect of distance on waveform parameters and frequency,as well as the dominance of different Lamb wave modes in each plate,from an acoustic emission point of view.
As for waveform analysis,the wave shape has a great difference between the two plates,so directly observing waveform can be an effective way to distinguish the two plates.The erratic wave shape of 75% position plate can be explained by a predominantly low frequency from the frequency domain.To quantify the waveform change,AE parameter analysis focuses on investigating the effect of wave propagation distance on fundamental AE parameters,including peak amplitude,rise time and RA.Peak amplitude shows a strong decreasing trend,while rise time and RA decreases with the distance.These are all consistent with the waveform.According to frequency domain analysis,neither central frequency nor peak frequency shows monotonical relation with distance.Instead,peak frequency presents more significant fluctuations than central frequency.Furthermore,in order to separate different Lamb wave modes,2D-FFT is applied to transform initial data to the wavenumber-frequency domain.The 50% position plate has the strongest energy in S1 and A1 modes,while the dominant Lamb wave mode in 75% position plate is dependent on whether it focuses on in-plane or out-of-plane displacement.
猜你喜欢
石材(2022年4期)2022-06-15 08:55:02
锦绣·中旬刊(2021年3期)2021-07-14 22:43:08
锦绣·中旬刊(2021年8期)2021-03-15 07:43:30
现代装饰(2019年11期)2019-12-20 07:06:00
制造技术与机床(2019年6期)2019-06-25 10:17:38
表面工程与再制造(2019年1期)2019-05-11 08:51:28
英语文摘(2019年1期)2019-03-21 07:44:44
海峡姐妹(2016年7期)2016-02-27 15:21:22
焊接(2016年4期)2016-02-27 13:02:12
当代体育·扣篮(2010年13期)2010-07-12 08:29:50