Ab initio study of dynamical properties of U–Nb alloy melt∗
Yong-Peng Shi(时永鹏) Ming-Feng Liu(刘鸣凤) Yun Chen(陈云) Wen-Lin Mo(莫文林) Dian-Zhong Li(李殿中)Tao Fa(法涛) Bin Bai(白彬) Xiao-Lin Wang(汪小琳) and Xing-Qiu Chen(陈星秋)
1Shenyang National Laboratory for Materials Science,Institute of Metal Research,Chinese Academy of Sciences,Shenyang 110016,China 2School of Materials Science and Engineering,University of Science and Technology of China,Shenyang 110016,China
3Institute of Materials,China Academy of Engineering Physics,Jiangyou 621907,China
Keywords: U–Nb alloy melt,dynamical properties,ab initio study
1. Introduction
The dynamical properties of metallic melt,including density, diffusivity, and viscosity, which have a crucial effect on the solidification behavior,solidified microstructure,and their final properties, are indispensably applied to the design of the high-performance materials.[1–4]The density, as one of the fundamental properties for metallic melt, is mainly used to describe the thermal expansion behavior of metallic melt.Change in density will lead the convection and composition uniformity of metallic melt to change, thereby affecting the other dynamical properties. Hence, the first step in studying the dynamical properties of metallic melt should be to determine variations of its density with surrounding factors, such as temperature,composition,and external pressure. The analyses of diffusivity and viscosity can reflect the transport characterization of atoms in the metallic melt. Previous research has proved that the change of diffusion coefficient in metallic melt will directly result in the change of solidified microstructure and chemical composition distribution. The diffusivity plays an important role in the solidification process of metallic melt and thus is considered to be the key kinetic parameter that affects the nucleation and growth of crystal.[2]Whereas the viscosity is a sensitive parameter to local structures,which is usually introduced to characterize the tiny changes of local structures. Through the above description,we can see that except for the processing technology, the dynamical properties play a decisive role in solidifying the metallic melt.[1]Hence,in order to reveal the effects of dynamical properties of metallic melt on the microstructure and chemical composition distribution of its solid and finally achieve the preparation of high-performance materials, it is necessary to fundamentally understand the dynamical properties of metallic melt.
However,it is still challenging to experimentally characterize the dynamical properties of metallic melt,in particular,it will be extremely difficult for the metals to possess higher melting point and active chemical properties. It is not only because of the brash operation environment at high temperature but also due to the intense high-temperature oxidation. In addition, the influence of temperature instability and impurities on the precision of experimental measurements are also unavoidable. Hence, so far, there appear largish errors in the experimental measurements. The existing experimental difficulties have seriously hindered the research of metallic melts.Whereas the rapid development of the computational material sciences provides us with a chance to achieve theoretical studies of metallic melts. Recently, theab initiomolecular dynamics (AIMD) simulations have been widely used to study the amorphous materials. The computations provide in-depth knowledge of their structures and properties, which are remarkably consistent with experimental data.[5–8]And,in previous work, we have studied the evolution of local atomic structure during solidification[9]and Nb distribution[10]in U–Nb alloy melt by AIMD simulations,and constructed the equations of diffusion coefficients, and viscosities for U116Nb12melt.[9]Based on this, in this work, we further systematically investigate the dynamical properties of the U–Nb alloy melt and establish the corresponding mathematical models to achieve the rapid calculations of densities, diffusion coefficients,viscosities,and their activation energy in the whole U–Nb liquid region. These results are useful to facilitate the construction of the nuclear material database as well as to provide a new idea for investigating the dynamical properties of binary alloy melts and promoting the development of melt research.
2. Computational details
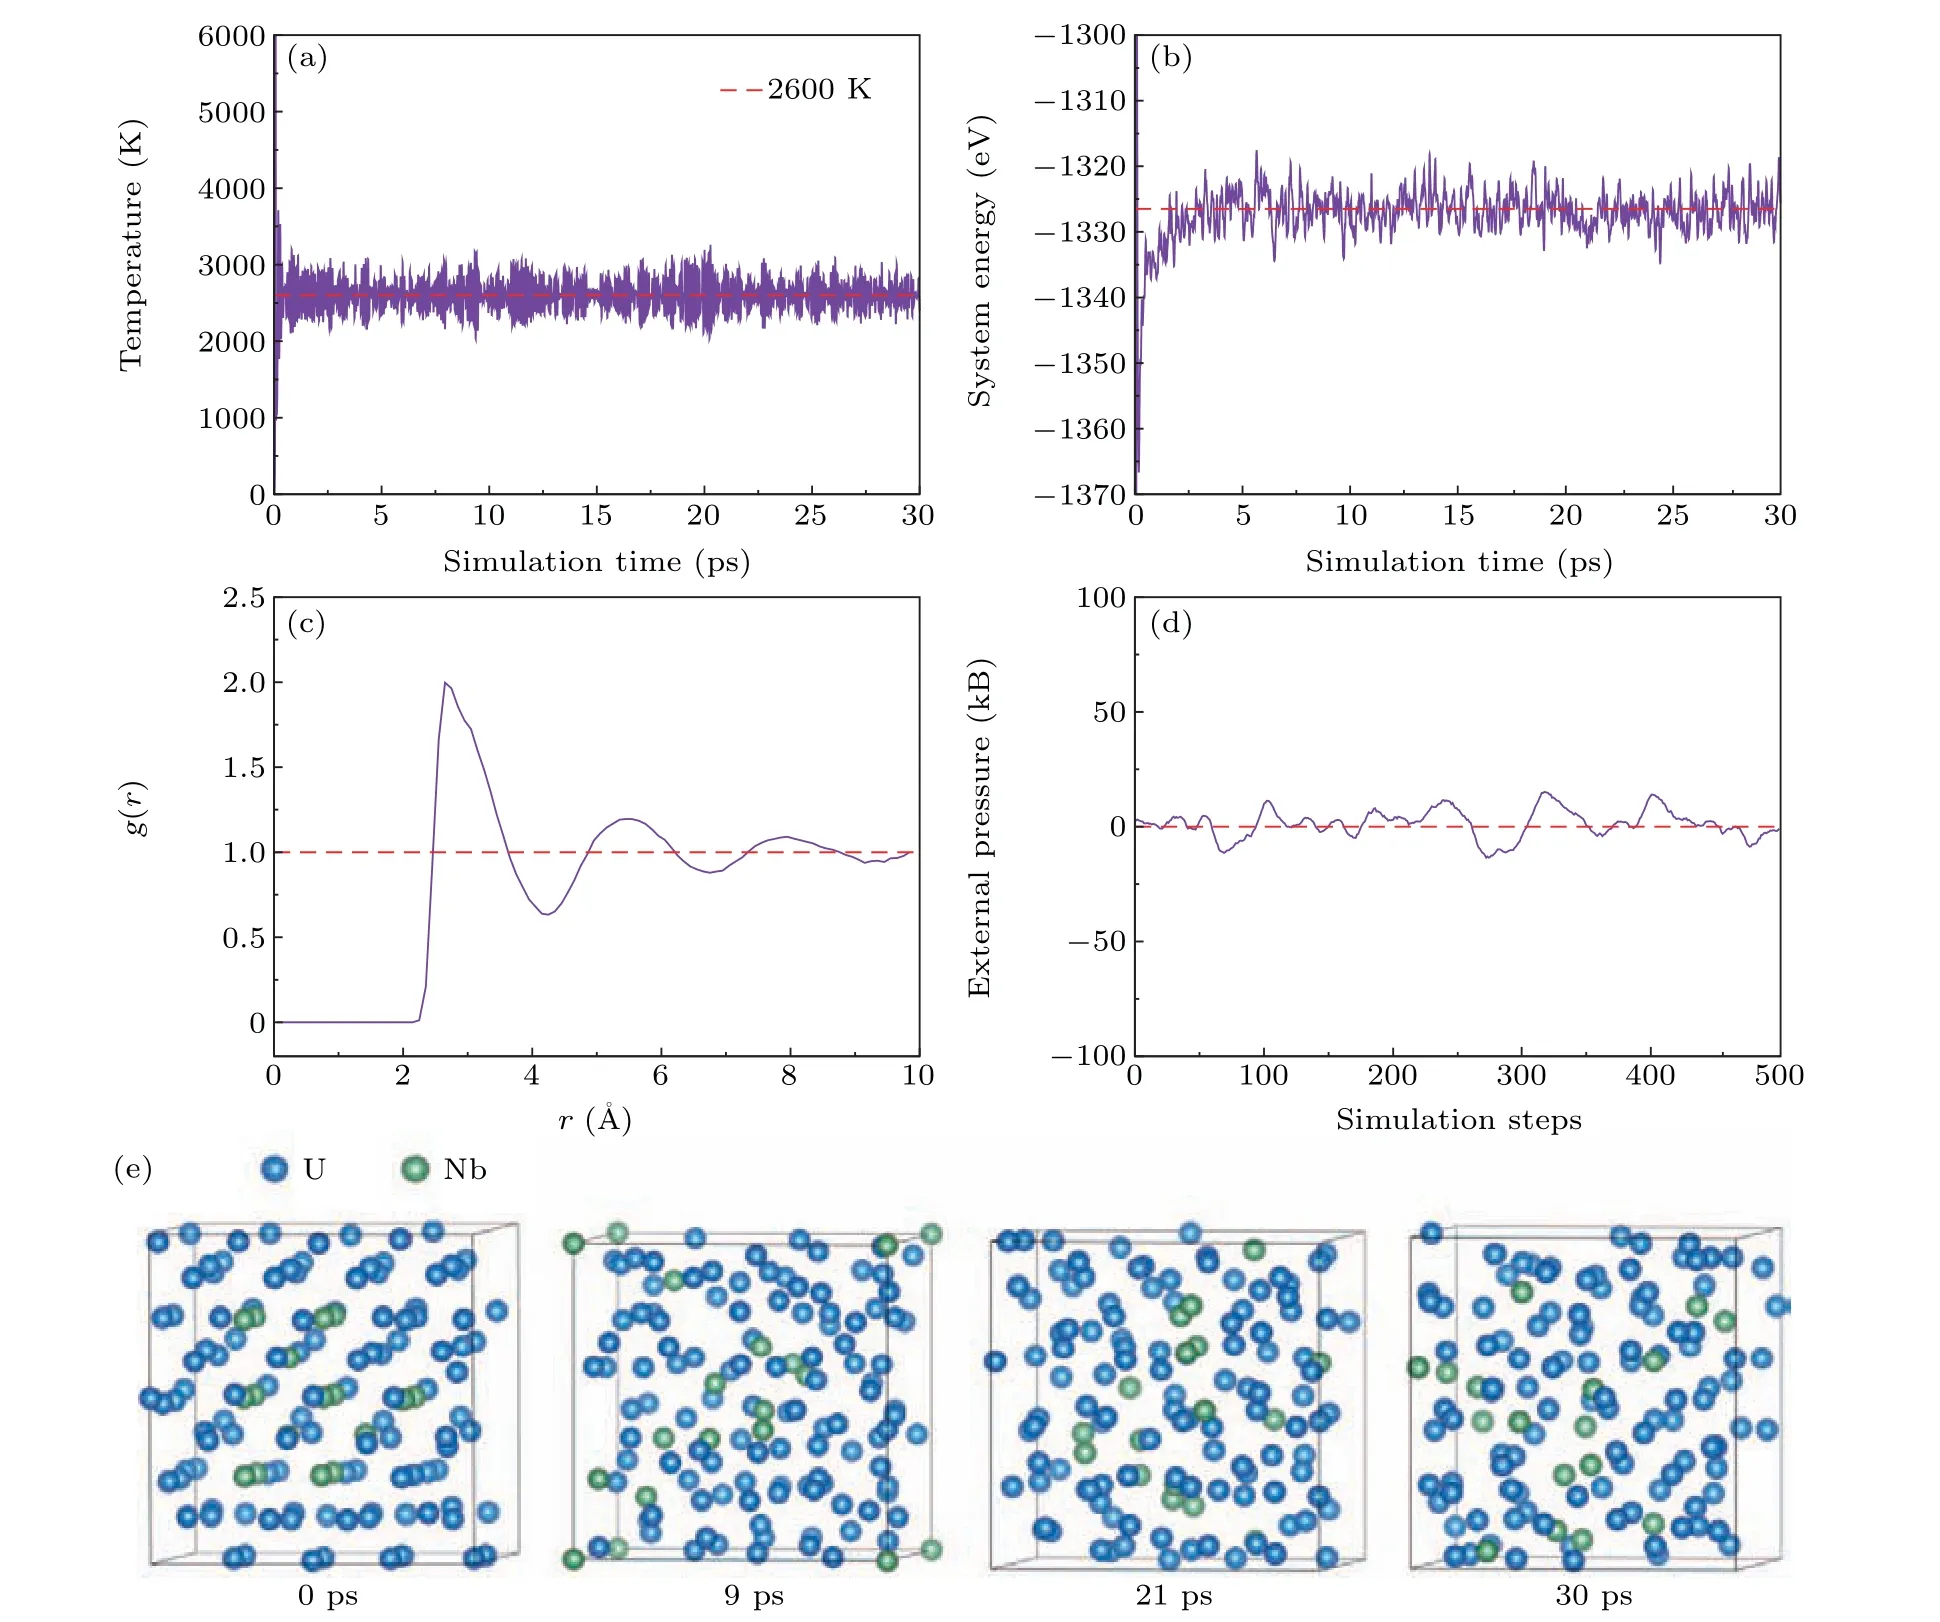
Fig.1. Variations of(a)temperature,(b)energy,and(d)external pressure with simulation time of 13.28-at.%Nb-containing U–Nb alloy;(c)variation of pair correlation function with r of 13.28-at.%Nb-containing U–Nb alloy at 2600 K;and(e)shots showing atomic structure evolution of 13.28-at.%Nb-containing U–Nb alloy melt at different times including the initially artificial structure at 0 picosecond.
Our AIMD study of the U–Nb alloy melt was carried out within the framework of density function theory(DFT)[11–13]implemented in the Viennaab-initiosimulation package (VASP).[14,15]All AIMD calculations were carried out by using the generalized gradient approximation(GGA)[16,17]of the PW91 functional developed by Perdew and Wang[18]for the description of the electronic exchange and correlation. An energy cutoff of 220 eV was used to expand the wave function, and the electronic configurations of 6s26p65f36d17s2for U and 4p65s14d4for Nb are treated as the semi-core electrons for our selected PAW potentials. Only theΓpoint was used to sample the Brillion zone of supercell.A canonical NVT ensemble with a Nose thermostat[19,20]for temperature control was employed. A typical time step of 3 fs was used via the Verlet algorithm to integrate the Newton’s equation of motion in our AIMD simulations.
The crystal structure ofγ-U with space groupIm-3m(No. 229) has a lattice constant of 3.475 ˚A.[21]The Bravais lattice of the conventional cell is body-centered cubic with a U atom occupying the position(0, 0, 0). In our AIMD simulations,based on the periodic boundary conditions,a 4×4×4 supercell of thex-at.%Nb(x=5.47,9.38,13.28,17.19,21.09,39.06,62.50,76.56,90.63)-containing U–Nb alloy,including 128 atoms,were constructed in which all the atoms exhibited random distribution. The initial configuration was heated at 2600 K (well above the melting point) with 104MD steps for 30 ps to remove the memory effects and reach the thermal equilibrium. As described by the temperatures and energy of system with simulation time in Figs.1(a)and 1(b),the 104MD running has established a robust thermal equilibrium within our supercell,and the calculated pair correlation function (PCF) [Fig. 1(c)] of the system further demonstrated the achievement of the standard liquid state at 2600 K. Furthermore, in order to illustrate the evolution of the molten process at 2600 K, four snapshots at different times have been complied in Fig. 1(e). We can see that with time going on,the atomic arrangement becomes more disordered, evidencing the transition from a solid to a molten state. Adopting the above method, the equilibrium liquid state of thex-at.%Nb(x=5.47, 9.38, 13.28, 17.19, 21.09, 39.06, 62.50, 76.56,90.63)-containing U–Nb alloys at 2600 K were obtained, respectively. Note that the 90.63-at.%Nb-containing U–Nb alloy was fully melted at 3100 K(well above the melting point of 2594 K)with 104MD steps to reach thermal equilibrium. It was then sequentially cooled down to 2400 K,2200 K,2000 K,1800 K,and finally to their melting points with a rate of 100 K per 1500 MD steps. At each temperature, the system was thermally equilibrated. Afterwards, the external pressure of molten model was made close to zero[Fig.1(d)]by adjusting the box size,[22]aiming to obtain the equilibrium volumes of the U–Nb alloy melt at different temperatures. Finally, using the derived equilibrium configuration with full molten status at the given temperatures,another 4000 AIMD steps were carried out for statistical analyses.
The diffusion coefficient (D) of the U–Nb alloy melt could be derived from the mean square displacements(MSDs)as a function of simulation time through the Einstein relation[23]as follows:

where parametertis the simulation time and〈R2(t)〉denotes the mean-square displacement (MSD) as a function of time.Based on the derived total-,U-,and Nb-diffusion coefficients,the pre-exponential factor and diffusion activation energy of the U–Nb alloy melt were obtained by fitting the logarithm of the diffusion coefficient with the reciprocal of temperature through the Arrhenius relation[24]as follows:

where the parameters ofD,E,R,andTare the pre-exponential factor,activation energy,molar gas constant,and temperature,respectively. We had derived the radial distribution functions(RDFs)and the diffusions coefficient,hence,the viscosity(η)for the U–Nb alloy melt could can be calculated at the given temperatureTthrough the Stokes–Einstein relation[24]as follows:

where the parameters ofk,T, andDare the Boltzmann’s constant, temperature, and diffusion coefficient, respectively,parameterarepresents the effective atomic diameter, which could be determined by the position of the first peak in the RDFs at a given temperature.
Note that the conventional DFT method may not be sufficient to describe the strongly correlated 5f electrons in U atoms. More advanced methods, such as DFT+U, are required to properly model the electronic and magnetic properties of uranium compounds, such as UO2[25]and UN.[26]However,there is no consensus on whether DFT+Umethod is necessary to correctly describe U metal and its alloys. Meanwhile,previous studies have suggested that conventional DFT is sufficient for U,[27]UZr alloys,[28]and UAl system.[29–31]Furthermore, in this work, we just consider the structure and energy of U–Nb alloy melt, but do not involve its electronic and magnetic properties. Therefore,in this work conventional DFT method is believed to be sufficient.
3. Results and discussion
3.1. Density
As is well known, the density of the metallic melt is mainly determined by temperature and its composition.Whereas the effect of pressure on the density of the liquid is relatively weak. Taking water for example,when the external pressure is increased by 5 atm(1 atm=1.01325×10⁵Pa),the density change of water is the same as that caused by temperature reducing 1 K.[32]Therefore,if the change range of pressure is relatively narrow,it is reasonable to completely ignore the effect of pressure on the density of the liquid. In this work,we have introduced two variables of temperature and composition to establish the mathematical model of the density for the U–Nb alloy melt. This model can be used to rapidly calculate the densities of the UNb alloy melts,thereby achieving high-throughput modeling.
Here, we first illustrate the basic physical consideration of our model. For a perfect bcc U crystal, its density can be described byρU=mU/VU,wheremUis the mass per U atom andVUis the equivalent volume per U atom in its bcc phase.Similarly, the density of bcc Nb isρNb=mNb/VNb. Based on the two equations, for U–Nb alloy where part of U atoms are replaced by Nb atoms,its density can be simply written asρU−Nb=(cUmU+cNbmNb)/(cUVU+cNbVNb), wherecUandcNbare the content of U and Nb in U–Nb alloy and they satisfycU+cNb=1. It is noticed thatVUandVNbare two constants derived from the bcc phase of U and Nb. Since the atoms in U–Nb alloy melt are extremely disordered, the density equation derived from perfect crystal is not applicable. Therefore,in our model of the density of U–Nb alloy melt, the form of density expression adopts the Taylor expansion of the density equation from perfect crystal and,the first three items of Taylor expansion are retained.Therefore,the relationship between density and content of Nb is a quadratic function,which is also evidenced by the results from our firstprinciples calculations,and we will discuss this part later. Furthermore,when Nb content is a constant, the relationship between density and temperature is nearly linear, which has been evidenced by previous work.[1]Note that the effect of coupling between temperature and Nb content on density is also necessarily considered.Based on the above theoretical basis, the density equation is established in the following part.

Fig.2. AIMD simulated density varying with Nb concentration and temperature for U–Nb alloy melt.
Figure 2 shows the derived densities of thex-at.% Nb(x= 5.47, 9.38, 13.28, 17.19, 21.09, 39.06, 62.50, 76.56 90.63)-containing U–Nb alloy melt at different temperatures.It can be found that at the same Nb concentration the densities of U–Nb alloy melts decrease linearly with temperature increasing from their melting points to 2600 K, which is attributed to the volumetric expansion by temperature.However,when the temperature keeps constant the densities each exhibit a parabolically decreasing tendency with Nb concentration increasing. This feature results mainly from the fact that the Nb atom has much smaller mass than U atom. Furthermore,figure 2 shows that all the derived densities of the U–Nb alloy melts fall on a curved surface, therefore, we can fit them with an expression with temperature(T)and Nb concentration(xat.%)as follows:
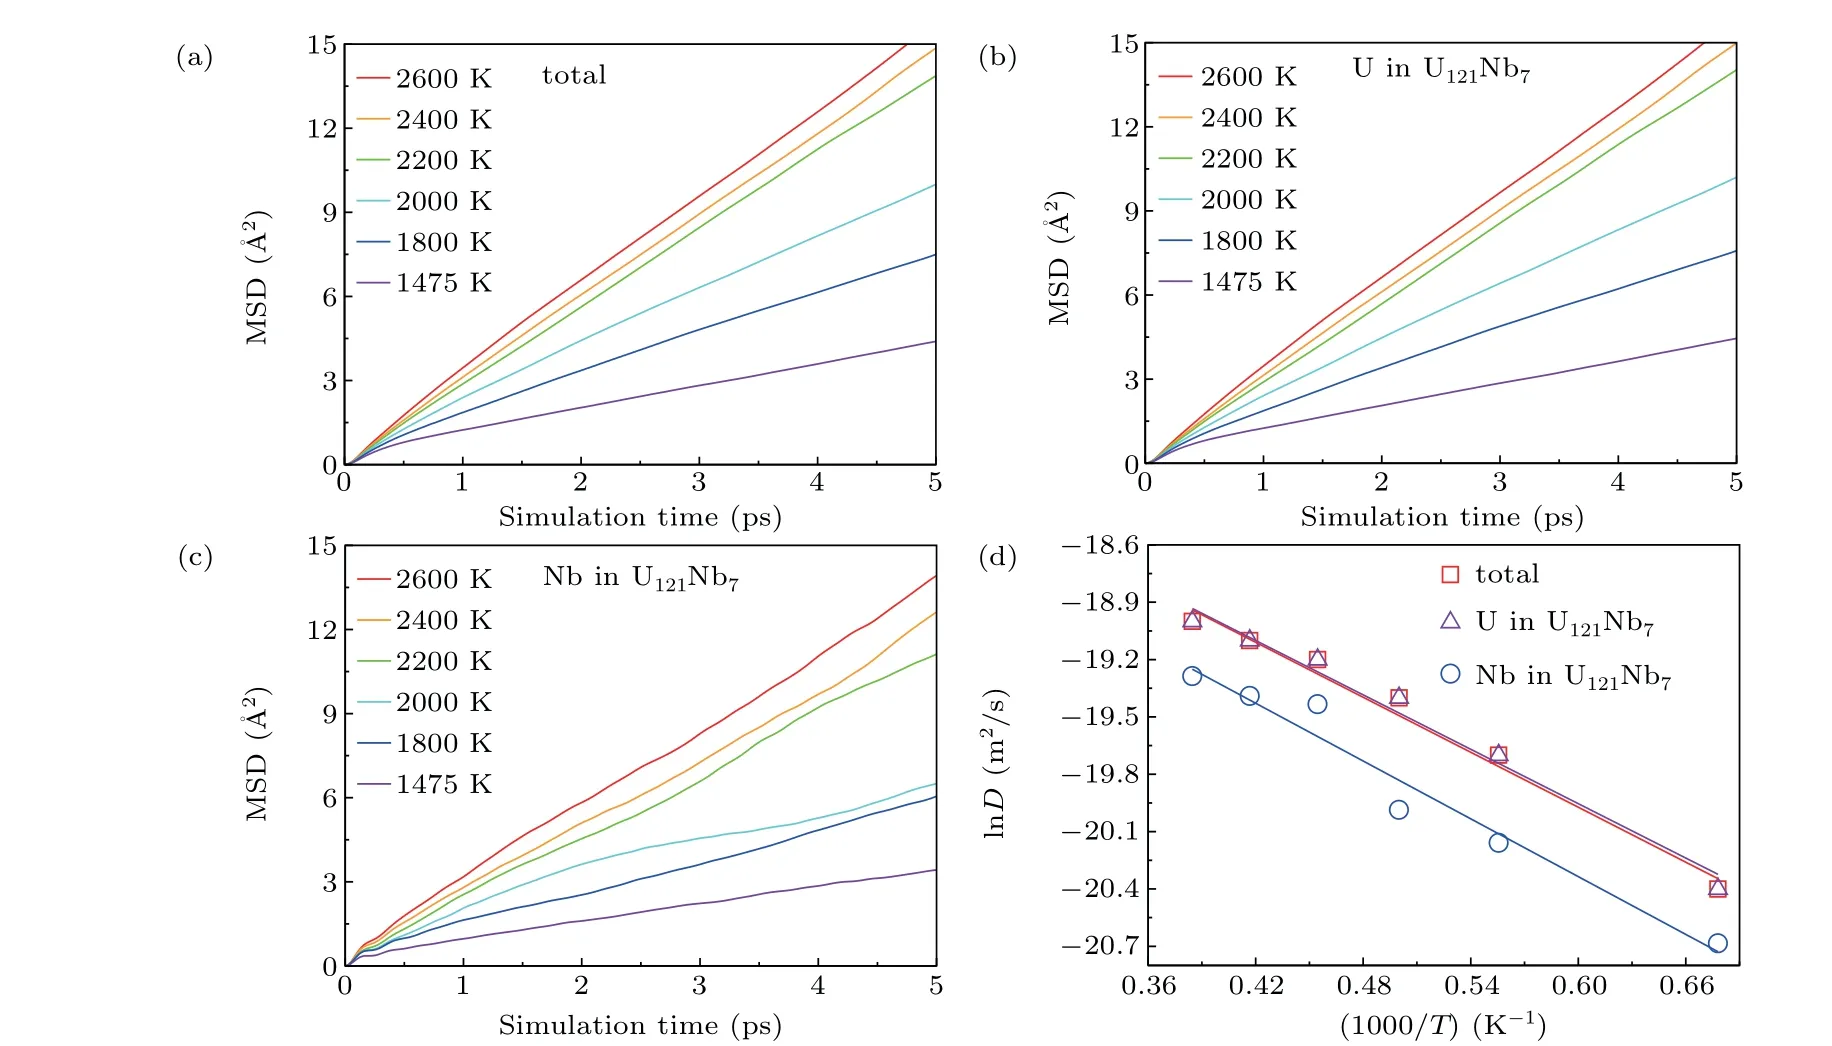
Fig.3. Variations of(a)total and partial mean square displacements at different temperatures with simulation time in 5.47-at.%Nb-containing U–Nb alloy melts: (b)U in U121Nb7 and(c)Nb in U121Nb7. (d)Logarithmic total-,U-,and Nb-diffusion coefficients varying with reciprocal of temperature in 5.47-at.%Nb-containing U–Nb alloy melt.

So far,there has been a lack of the theoretical and experimental data of the U–Nb alloy melt at high temperatures. In order to attest to the accuracy of our calculated results,we use Eq.(4)to calculate the densities of pure U melt at 1405 K and pure Nb melt at 2740 K,respectively,and compare them with the available experimental data in Refs. [1,33]. We have found that our derived densities of pure U melt at 1405 K and pure Nb melt at 2740 K are 17.92 g/cm3and 7.59 g/cm3,respectively,which are in agreement with the available experimental data(U melt: 17.47 g/cm3at 1405 K[33]and Nb melt: 7.83 g/cm3at 2740 K[1]). This comparison attests to the reliability of our calculated results.
3.2. Diffusivity
Diffusivity is usually used to reveal the effect on structural evolution and composition distribution during the solidification of metallic melt, and it is the crucial property of the metallic melt. In this subsection, we perform numerous calculations about diffusivity of the U–Nb alloy melt and constructe the statistical equation of the diffusion coefficients for the U–Nb alloy melt in order to achieve the rapid calculations of diffusion coefficients and diffusion activation energy in the whole U–Nb liquid region.
Figures 3(a)–3(c) show the total-, U-, and Nb-MSDs of the 5.47-at.%Nb-containing U–Nb alloy melt at different temperatures. The distinctly linear dependence of MSDs on simulation time indicates that the thermal equilibrium configurations are generated in our AIMD simulations. Through the Einstein relation [Eq. (1)], we further derive the total-, U-,and Nb-diffusion coefficients (D) by fitting their MSDs as a function of time. The detailed results are summarized in Fig. 3(d). It shows that the total-, U-, and Nb-diffusion coefficients display the continuously increasing tendencies with temperature increasing from melting points to 2600 K. Similarly,by the above method,the diffusion coefficients ofx-at.%Nb(x=9.38,13.28,17.19,21.09,39.06,62.50,76.56 90.63)-containing U–Nb alloy melt are further calculated. Note that figure 3(d) displays that the logarithmic total-, U-, and Nbdiffusion coefficients with respect to the reciprocal of temperature each exhibit an approximately linear relationship,which completely satisfies the Arrhenius relation [Eq. (2)]. Hence,by fitting Eq.(2)we can obtain the pre-exponential factor(D)and diffusion activation energy (E) and establish the thermal diffusion equations for the U–Nb alloy melt, which are summarized in Table 1. In addition,figures 4–6 show the logarithmic e total-,U-,and Nb-diffusion coefficients with respect to Nb concentration and reciprocal of temperature for the U–Nb alloy melts. It can be found that all the total-, U-, and Nbdiffusion coefficients fall on their corresponding curved surfaces, respectively. Therefore, for the U–Nb alloy melt, its total-, U-, and Nb-diffusion coefficients can be expressed as follows:

It should be pointed out that the total-, U-, and Nb-diffusion coefficients of the U–Nb alloy melt at any composition and temperature can be calculated quickly by using Eqs. (5)–(7).That is to say, we can easily establish the Arrhenius equation for the U–Nb alloy melt with any composition and, thus achieve the rapid calculations of the diffusion activation energy in the whole U–Nb liquid region.
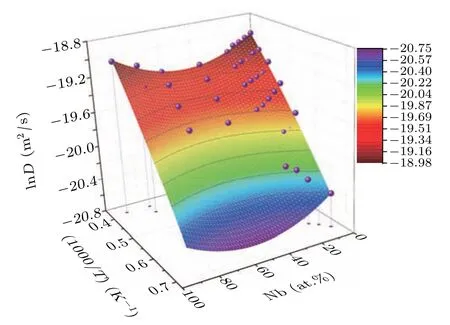
Fig. 4. Logarithmic total-diffusion coefficients varying with Nb concentration and reciprocal of temperature for U–Nb alloy melts from our AIMD simulations.

Fig. 5. Logarithmic U-diffusion coefficients varying with Nb concentration and reciprocal of temperature for U atoms in U–Nb alloy melts from our AIMD simulations.

Fig.6. Logarithmic Nb-diffusion coefficients varying with Nb concentration and reciprocal of temperature for Nb atoms in U–Nb alloy melts from our AIMD simulations.
3.3. Viscosity
Because we have already obtained the diffusion coefficients (D) and the positions of the first peaks in the RDFs at each temperature,the viscosities(η)of the UNb alloy melts at different temperatures can be calculated by using the Stokes–Einstein equation[Eq.(3)]. The results are shown in Table 1.Contrary to the tendency of the diffusion coefficients with temperature, the viscosities of the UNb alloy melts continuously decrease with temperature increasing from melting points to 2600 K. But the relationship between logarithmic viscosities and reciprocal of temperature also satisfies the Arrhenius relation. So,according to the Arrhenius relation of the viscosities we derive the pre-exponential factors(η),viscosity activation energy (E) and finally established viscosity equations for the U–Nb alloy melt, and the results are shown in Table 2. Furthermore, we have compiled the logarithmic viscosities as a function of Nb concentration and reciprocal of temperature of the U–Nb alloy melt in Fig.7. It can be seen that all the viscosities fall on a curved surface, hence, we can fit it with the viscosity equation for the U–Nb alloy melt as follows:


However, there has been no report on the experimental and theoretical viscosities of the U–Nb alloy melts yet. In order to verify the accuracy of our calculated results,we use Eq.(8)to calculate the viscosities of the pure U melt in the temperature range from 1405 K to 2973 K and compare the derived results with the available theoretical data. The results are ilisted in Fig.8.It can be seen that our calculated viscosities show an increasing tendency with temperature decreasing,and they are in agreement with the other theoretical data,[34,35]but at the same temperature our theoretical viscosity is a bit bigger. However,the data in Ref. [34] were derived by using model potential of interatomic interaction. In fact, this method has a certain error, which has been discussed in Ref. [34]. Therefore, it is reasonable that our calculated results are slightly different from the data in Refs. [34,35]. Furthermore, in this part, the calculations of viscosities for the U–Nb alloy melt are based on the derived diffusion coefficients, hence, the accuracy of our calculated viscosities also attests to the reliability of our calculated diffusion coefficients.

Table 1. Pre-exponential factor D0 (10−8 m2/s),diffusion activation energy E (kJ/mol)and thermal diffusion equation of x at.%Nb(x=5.47,9.38,13.28,17.19,21.09,39.06,62.50)-containing U–Nb alloy melt.

Table 2. Viscosity η (in units mPa·s),pre-exponential factor η0 (in units mPa·s),viscosity activation energy E (in units kJ/mol),and viscosity equation of x-at.%Nb(x=5.47,9.38,13.28,17.19,21.09,39.06,62.50,76.56,90.63)-containing U–Nb alloy melt.

Fig.7. Logarithmic viscosities varying with Nb concentration and reciprocal of temperature for U–Nb alloy melts from our AIMD simulations.
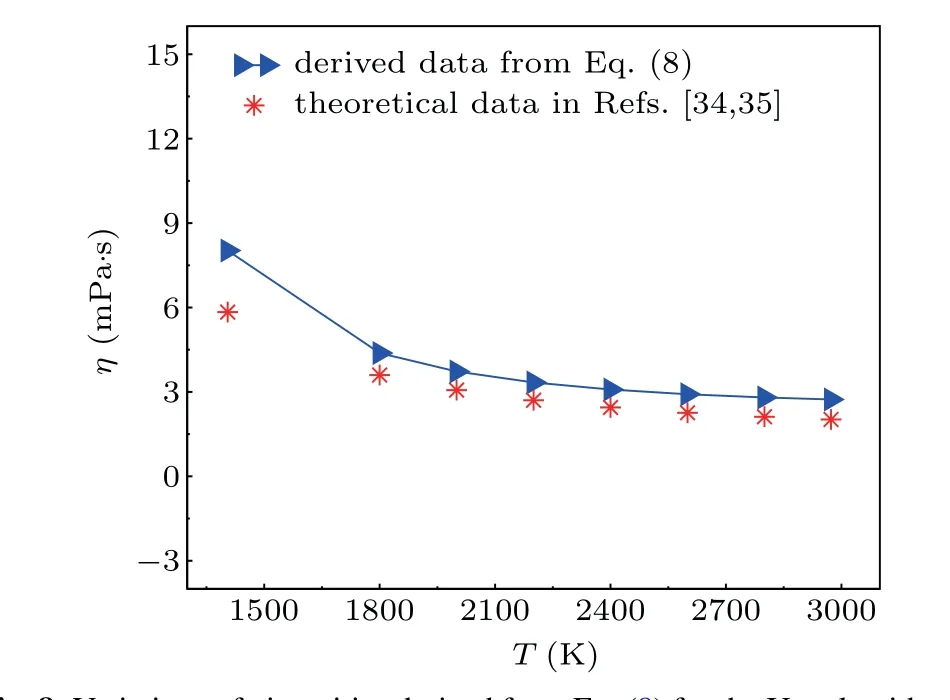
Fig.8. Variations of viscosities derived from Eq.(8)for the U melt with temperature from our AIMD simulations, compared with available theoretical data.[34,35]
4. Conclusion
In this work,the dynamical properties of the U–Nb alloy melt are systematically calculated by using the AIMD simulations. The conclusions are summarized as follows. (i) At the same Nb concentration the densities of U–Nb alloy melts decrease linearly with temperature increasing.However,when the temperature keeps constant,the densities exhibit a parabolically decreasing tendency with Nb concentration decreasing;(ii) The total-, U-, and Nb-diffusion coefficients display the continuously increasing tendencies with temperature increasing,whereas the viscosities of U–Nb alloy melts show a contrary tendency. In addition, the mathematical models of densities,diffusion coefficients,and viscosities are constructed to achieve the rapid calculations of dynamical properties in the whole U–Nb liquid region. These results will be useful in facilitating the construction of the nuclear material database as well as in providing a new idea for the investigation of dynamical properties of binary alloy melts and promoting the development of melt research.
Acknowledgement
All calculations were performed on the high-performance computational cluster in the Shenyang National University Science and Technology Park.
- Chinese Physics B的其它文章
- Modeling the dynamics of firms’technological impact∗
- Sensitivity to external optical feedback of circular-side hexagonal resonator microcavity laser∗
- Controlling chaos and supressing chimeras in a fractional-order discrete phase-locked loop using impulse control∗
- Proton loss of inner radiation belt during geomagnetic storm of 2018 based on CSES satellite observation∗
- Embedding any desired number of coexisting attractors in memristive system∗
- Thermal and mechanical properties and micro-mechanism of SiO2/epoxy nanodielectrics∗

