Synthesis of Porous CuO Based on an Etching Strategy and Application in Electrochemical Glucose Sensing
ZHANG ChenZHANG Jing-RuiHAN ChaoZHANG Yu-HangYANG Shan-HouMENG Wei*,
(1College of Chemical Engineering,North China University of Science and Technology,Tangshan,Hebei 063210,China)
(2Tangshan Sanyou Group Co.,Ltd.,Tangshan,Hebei 063305,China)
Abstract:Based on an etching strategy of treating a Cu-organic framework with tannic acid,a loose and porous CuO(denoted as E-CuO)was obtained.E-CuO modified glassy carbon electrode(E-CuO/GCE)was applied in the electrochemical sensing of glucose.E-CuO/GCE showed a high sensitivity of 0.273 μA·μL·mol-1·cm-2in the glucose concentration range of 0.25-2 000 μmol·L-1,as well as good anti-interference performance,repeatability and stability.In the analysis of practical samples,E-CuO/GCE performed well in the experiment of spiked recoveries of honey and fruit sugar,and E-CuO/GCE could be used in glucose detection in glucose injection.
Keywords:chemical etching;metal-organic framework;porous CuO;glucose oxidation
0 Introduction
The rapid and effective detection of glucose is of great significance in disease diagnosis and control,food analysis and drug regulation[1-2].The enzyme-free electrochemical sensors have attracted people′s great attention due to the advantages of high sensitivity as well as good stability,selectivity and reproducibility[3].In addition,the electrocatalytic activities of enzymefree electrochemical sensors are not easily affected by temperature,pH,humidity,toxic chemicals and other factors[1,4].As we know,the sensing behaviors of enzyme-free sensors greatly depend on the electrode materials[5].Many materials,including precious metals,transition metals and their oxides,carbon materials and other composites have been designed and fabricated to be used in glucose oxidation[1].Among all kinds of metal oxides,CuO is favored by people due to its excellent catalytic activity,good conductivity and well biocompatibility.The CuO-based electrochemical sensors exhibit high electrocatalytic activity for glucose oxidation,as well as good sensing behaviors in glucose detection[1,6-8].To further meet the requirements for glucose detection,it is a long-term work to continuously explore and develop diverse electrode materials with excellent performance.
Metal-organic frameworks(MOFs)are widely used in gas storage,light-emitting,separation and sensing due to their advantages of highly dispersed metal sites,large surface area and adjustable structure[9-11].In recent years,taking MOFs as precursors to prepare metal oxides is becoming a promising strategy[12-13].The metal oxides obtained by this method maintain many characteristics of MOFs,and exhibit great advantages in many fields,especially in the electrochemical field,such as lithium-ion batteries[14-15],supercapacitors[16-17]and electrochemical sensing[18-19].
To further enhance the electrochemical performances of metal oxides obtained from MOFs,the design and fabrication of oxide-based multi-component composites have become a research hotspot.Many composites,such as metal/metal oxides[20](e.g.Cu/Cu2O),metal oxide/carbon[21](e.g.Fe3O4@C)and metal oxide/metal oxide[22](e.g.CuO@NiO)are obtained.However,the preparation process of such composites is relatively complicated,and some procedures are often difficult to control.
Chemical etching to MOFs is a practical and simple strategy to enhance the material′s behaviors[23-26].In this method,some etchants,such as weak organic acid[23-24](e.g.tannic acid,glacial acetic acid and camphoric acid)are selected to corrode the parental materials under certain conditions,forming many pores on the surface and leading to the higher surface area.For example,Qi et al.[27]selected glacial acetic acid to etch MIL-101 to provide more adsorption sites for I2.Khan et al.[22]adopted a top-down etching strategy to ZIF-67 by using tannic acid,and obtained a hollow HCo3O4/C by calcining the etched ZIF-67.Compared with Co3O4/C directlyobtainedfrom ZIF-67,thecatalytic efficiency for peroxymonosulfate activation of HCo3O4/C is more than two times higher.
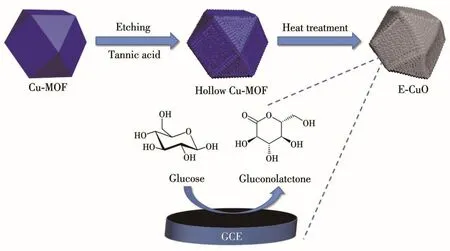
In this paper,based on the above consideration,by etching and calcining a Cu-MOF with tannic acid as the etchant,a porous copper oxide(denoted as E-CuO)was obtained.E-CuO was taken as the electrode material to modify the glassy carbon electrode(E-CuO/GCE)for glucose oxidation(Scheme 1).The electrocatalytic activity of E-CuO/GCE was greatly enhanced,and it also exhibited excellent sensing behavior for glucose detection.
1 Experimental
1.1 Apparatus

Scheme 1 Synthetic diagram of E-CuO as well as the electrooxidation of E-CuO/GCE towards glucose
Scanning electron microscope(SEM,JEOL JSM-IT100)was used to characterize the morphology and microstructure of the products(operating voltage:20.0 kV). X-ray photoelectron spectroscopy (XPS,ESCALab250xi)was used to observe the composition of the sample.X-ray diffraction(XRD,D/MAX2500PC and d8 advance,Rigaku)equipped with Cu Kα radiation(λ=0.154 18 nm)was conducted at 40 kV and 40 mA,and the 2θ was recorded from 5°to 90°.An electrochemical workstation(CHI-660C)was used for the electrochemical test.The workstation was equipped with three electrodes,including a GCE(glassy carbon electrode,φ 3 mm)as the modified working electrode.A three-electrode system was constructed with E-CuO/GCE as the working electrode,platinum electrode as the auxiliary electrode and calomel electrode as the reference electrode for the measurement of glucose sensing.
1.2 Synthesis of Cu-MOF and E-Cu-MOF
According to the literature[28],4.9 g Cu(NO3)2·3H2O was dissolved in 60 mL water-DMF(1∶1,V/V,DMF=N,N-dimethylformamide),and 2.4 g 1,3,5-benzenetricarboxylic acid(H3BTC)was dissolved in 30 mL ethanol.Then,Cu(NO3)2solution,120 mL glacial acetic acid and H3BTC solution were mixed,which was then placed in a heating oven at 550℃for 72 h.Finally,the blue Cu-MOF crystals were obtained.
According to the literature[22],the etching method was used for getting E-Cu-MOF.The prepared Cu-MOF was etched by tannic acid for two minutes with the concentrations of 0.002,0.004,0.006,0.008,0.010 mol·L-1,respectively.Then E-Cu-MOF was washed three times by ethanol.
1.3 Synthesis of E-CuO and CuO
The combustion boats with the prepared E-Cu-MOF crystals were directly placed in a tubular furnace.The temperature in the furnace gradually was risen from room temperature to 550℃and kept for 3 h to obtain E-CuO.CuO was obtained by the same method except that E-Cu-MOF was instead by Cu-MOF.
1.4 Fabrication of E-CuO/GCE
GCE was pre-treated.Under the action of ultrasound,10 mg E-CuO was dispersed in 200 μL ethanol solution for 30 minutes to obtain a uniform suspension.Then 40 μL suspension and 2 μL Nafion(mass fraction of 0.05%)solution were successively dropped on the GCE surface to obtain E-CuO/GCE.
1.5 Treatment and detection of honey,fruit sugar and glucose injection samples
The treatment of honey and fruit sugar:0.564 4 g honey was accurately weighed,diluted by 0.1 mol·L-1NaOH solution,and then put into a 25.00 mL volumetric flask to get the honey diluent.5.095 3 g fruit sugar was weighed,dissolved by distilled water,and then transferred into a 50.00 mL volumetric flask to get the fruit sugar solution.A fruit sugar solution(4.10 mL)was further diluted by 0.1 mol·L-1NaOH and transferred into a 25.00 mL volumetric flask to obtain the fruit sugar diluent.
The electrochemical detections of honey and fruit sugar were conducted as follows.Taking the honey detection for example:in 80.00 mL 0.1 mol·L-1NaOH electrolyte solution,80 μL honey diluent was first added,and then 80 μL glucose standard solution(0.1 mol·L-1)was added for three consecutive times,respectively.The corresponding response current was recorded by the current-time(I-t)curve at 0.55 V potential.
The treatment and detection of glucose injection:991 μL glucose injection(0.5 g·mL-1)was diluted by 0.1 mol·L-1NaOH solution,and transferred into a 25.00 mL volumetric flask.In 80.00 mL 0.1 mol·L-1NaOH electrolyte solution,40 μL glucose injection diluent was added seven times,respectively.The corresponding response current was recorded by the I-t curve at 0.55 V potential(Fig.S1,Supporting information).
2 Results and discussion
2.1 Characterizations
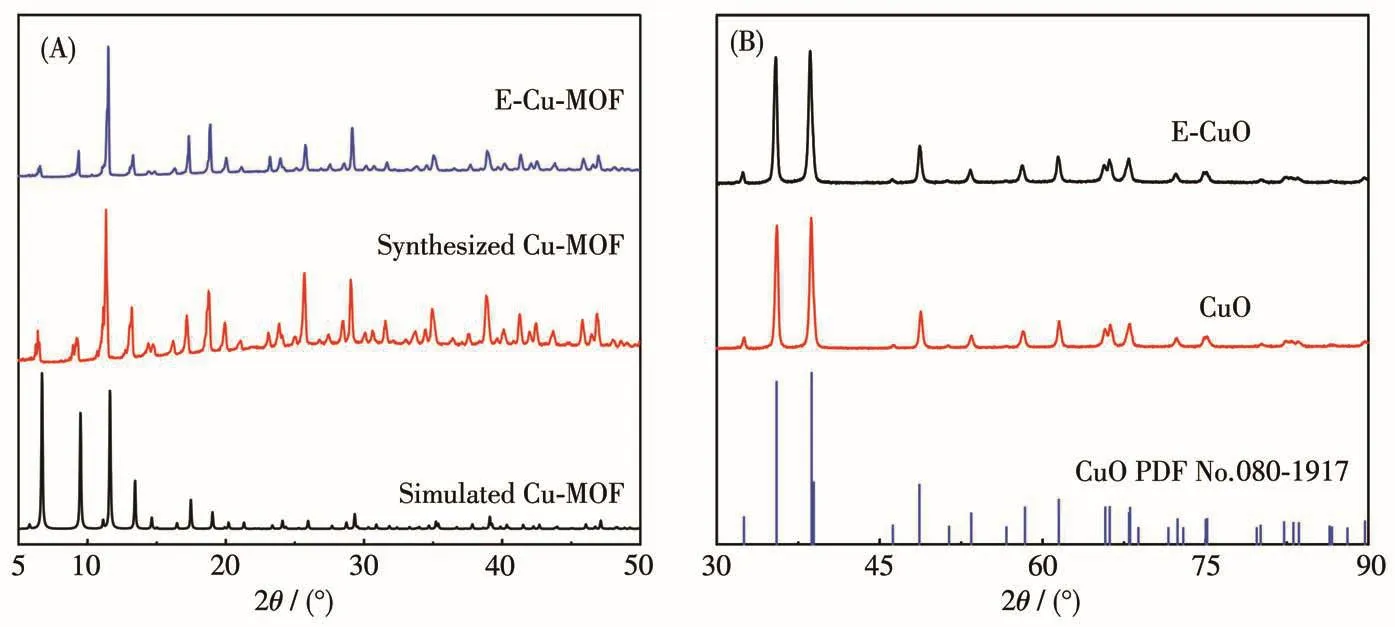
Scheme 1 depicts the fabrication of E-CuO.Tannic acid was selected as an etchant to etch Cu-MOF,and then Cu-MOF was calcined to obtain E-CuO.The XRD patterns were used for the structural investigation.The locations of the peak for the synthesized Cu-MOF are consistent with those of the simulated one,confirming a pure phase of Cu-MOF(Fig.1)[29].When Cu-MOF was etched by 0.004 mol·L-1tannic acid,the peak positions were still unchanged,indicating that chemical etching did not damage the crystal structure of Cu-MOF(Fig.1A).When Cu-MOF was calcined at 550℃in the air for 3 h,the peak positions of the calcined product are consistent with CuO in the cubic system(PDF No.080-1917),suggesting the formation of pure CuO(Fig.1B).Also,the peak positions of E-CuO obtained from the etched Cu-MOF still consisted well with those of CuO.

Fig.1 (A)XRD patterns of simulated Cu-MOF and Cu-MOFs etched by tannic acid or not;(B)XRD patterns of CuO and E-CuO
To verify the element composition and bond structure of E-CuO composite,XPS analysis was carried out.The XPS survey spectra in Fig.2A confirms the existence of Cu and O.The Cu2p spectrum of E-CuO signed with Cu2p1and Cu2p3peaks are 952.8 and 932.8 eV,respectively.Moreover,the energy difference of 20 eV between the peaks of Cu2p1and Cu2p3is attributed CuO,corresponding to the presence of Cu2+in CuO(Fig.2B)[30].The O1s showed a strong peak at about 529.9 eV.A low-intensity lattice peak at about 531.5 eV belongs to the lattice oxygen of CuO[31].

Fig.2 (A)Survey XPS spectrum,XPS spectra of(B)Cu2p and(C)O1s for E-CuO
SEM was operated to check the morphological structure of Cu-MOF,CuO and E-CuO obtained from Cu-MOF etched by tannic acid with different concentrations(0,0.002,0.004,0.006,0.008,0.010 mol·L-1).As shown in Fig.3A and Fig.S2,most of Cu-MOF crystals exhibited irregular shape.However,it could still be observed that there were some regular Cu-MOF particles with the tetradecahedron morphology.After heating Cu-MOF at 550℃in air,the calcined product of CuO almostremained the parentalmorphology[28](Fig.3B).Differently,the surface of CuO became uneven,loose and porous due to the decomposition of organic skeleton as well as the release of small molecule gas[32].The SEM images of E-CuO obtained from Cu-MOF etched by tannic acid with different concentrations are shown in Fig.3C-3H.As the concentration of tannic acid increasing,more and more holes appeared on the surface of E-CuO.E-CuO obtained from Cu-MOF etched by 0.004 mol·L-1tannic acid showed more well-distributed pores.As shown in Fig.S3,from the SEM images with high resolution,the loose and porous structure of E-CuO could be clearly seen.The N2adsorption-desorption isotherms of CuO and E-CuO were carried out(Fig.S4).However,due to the existence of macropore in E-CuO,the Brunauer-Emmett-Teller(BET)surface area of E-CuO failed to be measured.

Fig.3 SEM image of(A)Cu-MOF and(B)CuO;(C-H)SEM images of CuO and E-CuO obtained from Cu-MOF etched by tannic acid with different concentrations
2.2 Electrochemical behaviors of E-CuO/GCE
For CuO/GCE,as shown in Fig.4A,there was no obvious redox peak without glucose.After adding 3 mmol·L-1glucose,an obvious and wide oxidation peak appeared at the potential range of 0.4-0.6 V,and it is attributed to the conversion between Cu(Ⅱ) and Cu(Ⅲ),confirming the electrocatalytic activity of CuO/GCE for glucose oxidation;The sensing mechanism is concluded as the following aspects[33-36]:firstly,Cu(Ⅱ)is oxidized to Cu(Ⅲ)by the electrochemical reaction in NaOH solution(Eq.1);Secondly,a reduction reaction of Cu(Ⅲ)to Cu(Ⅱ)specie occurs,leading to the oxidation of glucose to gluconate(Eq.2).

For E-CuO/GCE,after the addition of 3 mmol·L-1glucose,a more obvious oxidation peak with higher current intensity appeared at the potential range of 0.3-0.55 V[29].It can be seen that the oxidation potential significantly shifted to the left and a wider electrochemical window appeared.On the one hand,the loose and porous structure of E-CuO could make the active catalytic-sites increased and more catalytic-sites exposed to the electrode surface;On the other hand,the loose and porous structure of E-CuO is beneficial to the catalytic mass transfer process[37].As a result,the electrocatalytic activity of E-CuO/GCE towards glucose oxidation is enhanced and the oxidation process becomes easier,which leads to the oxidation potential shifting to the left.In addition,many references could also support this situation[20,37].
The effect of tannic acid with different concentrations on the catalytic activity of E-CuO/GCE was also investigated(Fig.4B).As the tannic acid concentration was increased from 0 to 0.004 mol·L-1,the oxidation peak current gradually increased;however,as the con-centration of tannic acid further increased from 0.004 to 0.008 mol·L-1,the oxidation peak current gradually decreased;As the tannic acid concentration further increasing,although the peak current intensity slightly increased,an obvious oxygen evolution occurred.On overall consideration,the tannic acid concentration of 0.004 mol·L-1was selected as the best etching concentration for the following tests.Fig.4C shows the CVs of E-CuO/GCE upon successive addition of glucose from 0 to 5 mmol·L-1(0,0.1,0.2,0.3,0.4,0.5,1,2,3,4,5 mmol·L-1).The oxidation peak current increased with the glucose concentration increased,further affirming the electrocatalytic activity of E-CuO/GCE for glucose oxidation[37].

Fig.4 (A)CVs of CuO/GCE and E-CuO/GCE in the presence of 3 mmol·L-1glucose or not in 0.1 mol·L-1NaOH;(B)CVs of E-CuO/GCE obtained from Cu-MOF etched by tannic acid with different concentrations in the presence of 3 mmol·L-1glucose in 0.1 mol·L-1NaOH;(C)CVs of E-CuO/GCE in glucose solution with different concentrations of 0-5 mmol·L-1in 0.1 mol·L-1NaOH(scan rate:50 mV·s-1)
The improved catalytic activity of E-CuO may be attributed to the enhanced electron transport benefited from the loose and porous structure[38].The electrochemical impedance spectroscopy(EIS)of GCE,CuO/GCE and E-CuO/GCE were investigated to evidence this point.In Fig.5A,E-CuO/GCE shows the smallest semicircle,which indicates a fast electron transfer on E-CuO/GCE[39].Fig.S5A shows the CVs of E-CuO/GCE at different scan rates of 50-250 mV·s-1.The peak currentincreased with the scanning rate increased(Fig.5B).The peak current exhibited a linear dependence upon the scanning rate,indicating that this electrocatalytic oxidation of glucose is a surface-controlled process[40].

Fig.5 (A)Nyquist plots of EIS for GCE,CuO/GCE and E-CuO/GCE in the presence of 0.1 mmol·L-1glucose in 0.1 mol·L-1NaOH;(B)Plots of peak current vs scan rate of E-CuO/GCE
2.3 Glucose detection
As the OH-participates in the electrooxidation of the glucose,the effect of OH-needs to be investigated.As shown in Fig.6A,the oxidation peak current increased with NaOH concentration increased from 0.01 to 0.1 mol·L-1at 0.55 V.After that,further increasing NaOH concentration from 0.1 to 0.5 mol·L-1,the oxidation peak current decreased.As a result,NaOH with 0.1 mol·L-1was the optimal selection[40].Different potentials(0.45,0.50,0.55,0.60 V)were explored to obtain the best potential for glucose detection(Fig.6B).The slope value of the response current at 0.55 V was the highest[41].Moreover,from the relationship between glucose concentration and ampere response at each potential,it could be seen that the sensitivity at 0.55 V was also the highest,further confirming the good selection of 0.55 V in the glucose detection.

Fig.6 (A)Amperometric responses of E-CuO/GCE in NaOH solution with different concentrations of 0.01-0.5 mol·L-1 at 0.55 V;(B)Relationship between ampere response and glucose concentration at different potentials
Fig.7A shows the current response curve of E-CuO/GCE when glucose with different concentrations were added continuously.The inset shows the amplification curve with low glucose concentration ranging from 0.25 to 1 μmol·L-1.It can be seen that E-CuO/GCE also had a response to such a low concentration[33,41-42].Fig.7B shows the calibration curve of the current response signal and glucose concentration[41].For the fitting part,a good linear relationship was obtained in the range of 0.25 to 2 000 μmol·L-1glucose,with a sensitivity of 0.273 μA·μL·mol-1·cm-2.In addition,the limit of detection(LOD)of E-CuO/GCE was calculated to be 0.20 μmol·L-1based on a signal-tonoise ratio of three(S/N=3).

Fig.7 (A)Typical amperometric transient response with successive additions of glucose ranging from 0.25 to 13 000 μmol·L-1 for E-CuO/GCE at 0.55 V(Inset:an enlargement of the amperometric transient response with successive additions of glucose in the range of 0.25 to 1 μmol·L-1);(B)Relationships between glucose concentration and current signal of E-CuO/GCE at 0.55 V(Inset:the calibration curve for current versus glucose concentration)
The sensing behaviors of E-CuO/GCE prepared were compared with those of other copper-based materials,as shown in Table S1.It can be seen that E-CuO/GCE has comparative advantages in the linear range,sensitivity and LOD.The good sensing performances of E-CuO/GCE could attribute to the highly uniform and distributed catalytic-site,as well as loose and porous morphology.
2.4 Anti-interference,reproductivity and stability
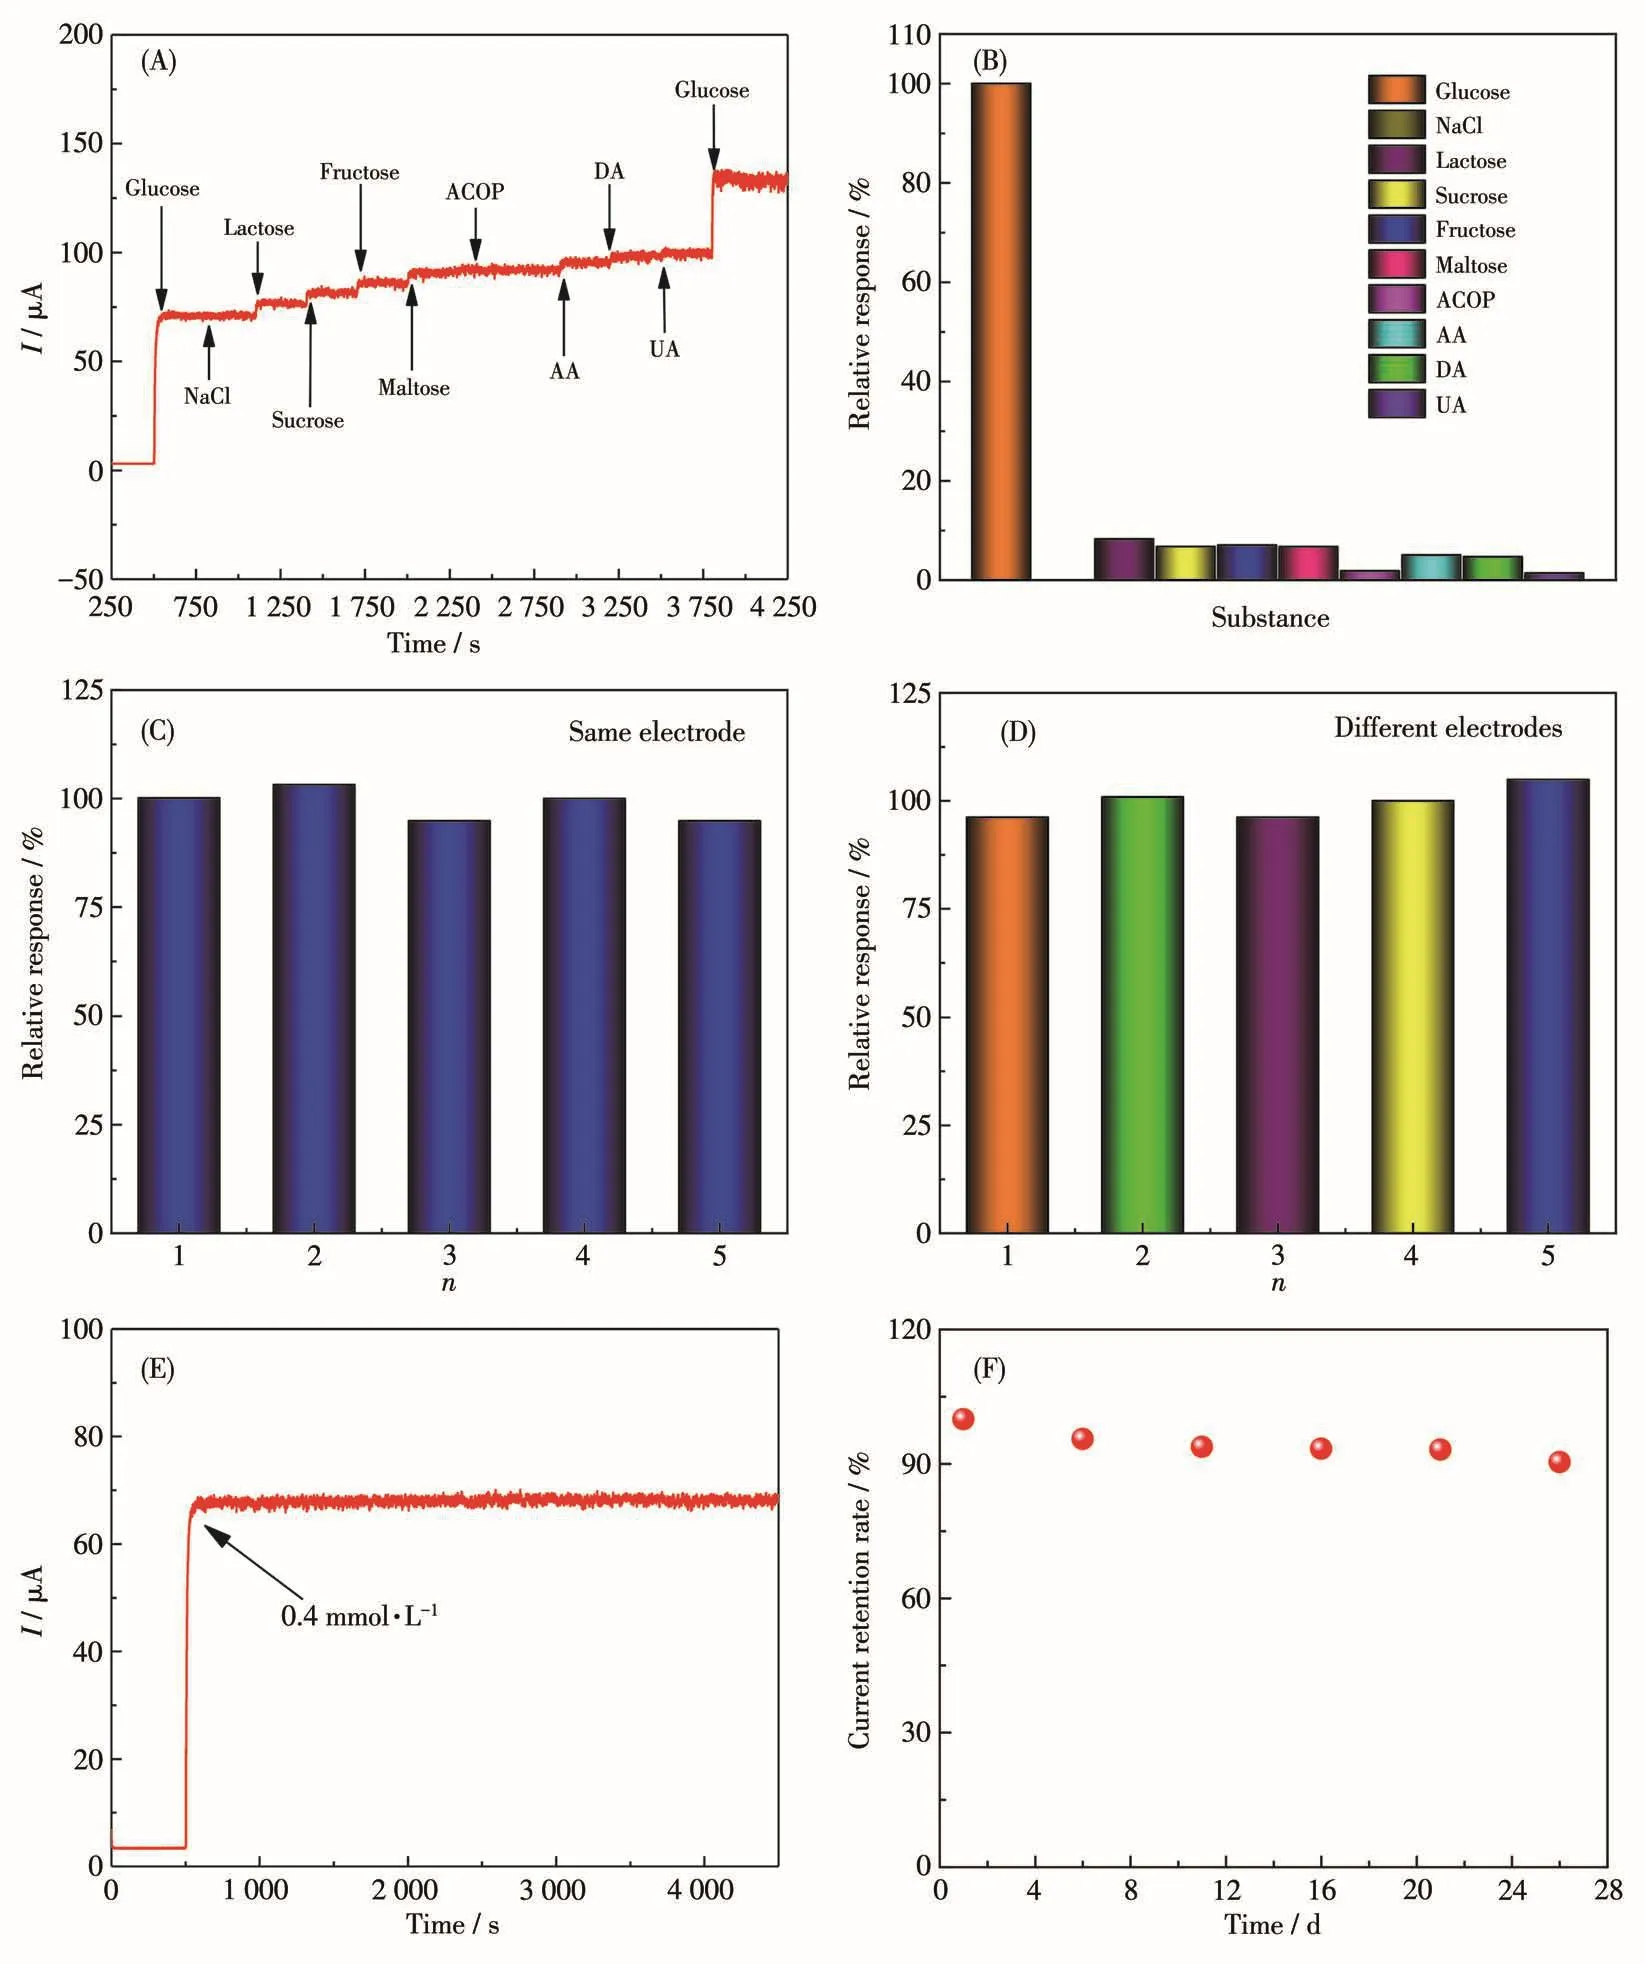
For enzyme-free glucose sensors,they are often used in the determination of glucose in serum and foods rich in glucose.The substances of NaCl,lactose,sucrose,fructose,maltose,acetaminophen(ACOP),ascorbic acid(AA),dopamine(DA)and uric acid(UA)were selected as coexistence species to investigate the anti-interference ability of E-CuO[29,35].Fig.8A and 8B show the response diagram of E-CuO/GCE to the substances of glucose(0.5 mmol·L-1),NaCl(0.05 mmol·L-1),lactose(0.05 mmol·L-1),sucrose(0.05 mmol·L-1),fructose(0.05 mmol·L-1),maltose(0.05 mmol·L-1),ACOP(0.05 mmol·L-1),AA(0.05 mmol·L-1),DA(0.05 mmol·L-1)and UA(0.05 mmol·L-1)[41-43].A significant current response was observed after adding glucose.However,the current responses had no obvious chang-es after adding a series of interfering substances.The fact shows that E-CuO/GCE has good selectivity for glucose detection in serum and foods rich in glucose.

Fig.8 (A,B)I-t curves of E-CuO/GCE in the presence of 0.5 mmol·L-1glucose and 0.05 mmol·L-1different substances;(C)Reproductivity based on the same electrode of E-CuO/GCE;(D)Reproductivity based on different electrodes of E-CuO/GCE prepared with the same method;(E)Amperometric I-t curve of E-CuO/GCE in the presence of 0.4 mmol·L-1glucose in 0.1 mol·L-1NaOH over 4 000 consecutive seconds;(F)Current response of E-CuO/GCE upon 28 days in 0.1 mol·L-1NaOH(Potential:0.55 V)
The repeatability ofE-CuO/GCE was also explored by using the same electrode to test five times,the maximum deviation was 5.16%(Fig.8C).Meanwhile,five electrodes made by the same methods were also used for the measurement to investigate the repeatability(Fig.8D),and the maximum deviation was 4.91%.The results above indicate that E-CuO/GCE has good repeatability.Furthermore,another batch of E-CuO was synthesized by the same method and the repeatability of E-CuO/GCE was also investigated.As shown in Fig.S6,E-CuO/GCE still shows good repeatability in glucose detection.
The stability of E-CuO/GCE was measured by continuously recording theI-tcurve(Fig.8E).The current signal remained basically unchanged for a long time over 3 000 s,indicating good stability[40].Long-term measurement of the electrode was also investigated.After storing the electrode in the air for 28 days,the current only decreased by 9.58%,as shown in Fig.8F,which indicates that the sensor has good long-term stability[40].
2.5 Application of glucose in the practical samples
The application ability of E-CuO/GCE in the determination of glucose in honey and fruit sugar was investigated by the recovery experiment.As shown in Fig.S7,the current response signal was systematically increased when 80 μL glucose standard solution was added continuously.The glucose concentration added was calculated according to the response current and calibration curve.As shown in Table 1,the recoveries of glucose under the two conditions were in the ranges of 94.4%-101.7% and 93.5%-97.1%,respectively.The results showed that E-CuO/GCE has the application prospect in the detection of glucose in real samples.
In addition,E-CuO/GCE was used to directly determine the content of glucose in glucose injection.The actual content of glucose in glucose injection was calculated according to the response current and calibration curve.As shown in Table 2,the recovery of glucose in glucose injection was in a range of 94.2%-102.0%,which was basically consistent with the standard concentration,indicating that E-CuO/GCE could be used for the detection of glucose in glucose injections.

Table 1 Results of glucose determination in practical samples of honey and fruit sugar

Table 2 Results of glucose determination in practical samples of glucose injection
3 Conclusions
By simply etching a Cu-MOF with tannic acid,a porous E-CuO was synthesized.E-CuO/GCE modified electrode showed enhanced sensing behaviors for glucose oxidation.To sum up,taking MOFs as precursors and adopting etching strategy provides a simple and effective way to fabricate porous metal oxides,and then contributes to the development of high-performance electrochemical sensors based on metal oxides.
Supporting information is available at http://www.wjhxxb.cn
- 无机化学学报的其它文章
- Synthesis of Quasi-MIL-53(Fe)Photocatalysts for Enhanced Visible Light Photocatalytic Degradation of Organic Dyes
- Synthesis,Structures,Luminescence and Magnetic Properties of Co(Ⅱ) and Ni(Ⅱ)Coordination Compounds Based on Dibenzoyl-Tartaric Acid
- Synthesis,Structure and Properties of Three Copper(Ⅱ)Complexes Based on a Bifunctional Ligand 2,2′∶6′2″-Terpyridine-4′-carboxylic Acid
- Visible Light-Assisted Synthesis of Platinum Nanoparticles for Catalytic Reduction Reaction of p-Nitrophenol
- 超快速turn-on型ClO-荧光探针的合成及性能
- g-C3N4基复合分离膜的制备及光催化性能

