
Nanoemulsion containing a synergistic combination of curcumin and quercetin for nose-to-brain delivery: In vitro and in vivo studies
2021-11-15 01:48HitendraMahajanNayanaPatil
Hitendra S Mahajan, Nayana D Patil
R.C.Patel Institute of Pharmaceutical Education and Research, Shirpur, Dist-Dhule (M.S), India
ABSTRACT
KEYWORDS: Curcumin; Quercetin; Nanoemulsion; Brain tumor;Synergism
1. Introduction
Cancer is one of the life-threatening diseases that leads to severe death worldwide[1]. Brain tumors are, in fact, the second leading cause of cancer-related deaths in children and young adults. Brain tumors are abnormal growth occurring in any tissues within the cranium, including the brain, cranial nerves, meninges, skull,pituitary gland, and pineal gland[2]. The recommended management strategy includes surgical removal combined with radiotherapy and/or chemotherapy but the median survival after the treatment is still very low[3-5]. For management of brain tumors, chemotherapy is widely used, but it has many limitations such as nonselective drug distribution, multi-drug resistance, and increased drug toxicity to the normal cells[1]. The unmet medical needs related to brain tumors and their incurable effects require novel treatment strategies.The objective of chemotherapy is to increase the survival time of patients by targeted drug delivery and to reduce the toxicity towards normal cells[6]. The primary challenge in the delivery of a drug to a tumor site is to target the anticancer drug specifically into and around tumors at concentrations that will decrease their growth and/or viability[7]. To improve therapeutic effect of drug, increasing drug loading is crucial. In addition, site-specific drug targeting is also important[8].
For management of brain tumors, the main problem is to achieve targeted delivery of active constituents bypassing significant barrier of the central nervous system (CNS) i.e., the blood-brain barrier.Numerous reports demonstrtaed feasibility of such targeted delivery to CNS bypassing the blood-brain barrier[9]. Colloidal drug delivery is a promising strategy for the delivery of hydrophobic drugs,because of its numerous advantages like increased bioavailability,sustained release of the drug, and improved drug stability[10].
Curcumin (CUR), a phytophenol, is a major active component of the spice turmeric (Curcuma longa Linn, Zingiberaceae). Both in vitro and in vivo studies have shown that CUR exhibits potent antioxidant, anti-inflammatory and anticancer activities[11]. CUR was shown to inhibit NF-κB activation and NF-κB-regulated gene expression through inhibition of IKK and Akt activation[11].Quercetin (QUE) is used to maintain general health and treat various diseases. Many researches reported its anti-inflammatory and anticancer potential. Many fruits, vegetables, leaves, and grains are rich sources of QUE[12]. It exerts its more specific pro-apoptotic action on tumor cells than non-transformed cells. Appilcation of QUE-like molecules is limited because of the its hydrophobic and crystalline nature[13].
Many studies explain rational use of a combination of a synthetic and a phytochemical for cancer therapy[14-17]. It is hypothesized that a combination of CUR and QUE may have synergistic effects as anticancer agents. Hence the present study aims to develop a nanoemulsion containing a synergistic combination of CUR and QUE as non-invasive delivery to the brain through the nose for effective treatment of brain tumors.
2. Materials and methods
2.1. Reagents
CUR was obtained as a kind gift from Sun pure Extracts Ltd Delhi,India; QUE was purchased from Otto Chemie. Pvt. Ltd (India),Tween 20 and Polyethylene glycol 400 from Loba Chemie Pvt. Ltd(India); olive oil was obtained from Soofi Traders Ltd. (Mumbai,India); high performance liquid chromatography (HPLC) grade methanol from Merck Pvt. Ltd. Mumbai (India). All other reagents used were of analytical grade.
2.2. Determination of synergistic combination
U-373 MG (Uppsala) cell line (Sigma Aldrich) was used in the experiment. Synergy can be demonstrated using the Chou-Talalay method by determining the combination index (CI). To determine CI, cells were subjected to viability assay with a combination of the two agents in a constant ratio to one another. The effects of the combination of CUR and QUE in comparison with CUR and QUE on cell viability were determined by sulforhodamine B (SRB) assay.The % cell growth inhibition of adrenomycin at different concentrations(10-80 μg/mL) was estimated as control. SRB solution (50 μL) at 0.4% (w/v) in 1% acetic acid was added to each well, and plates were incubated for 20 min at room temperature. After staining, plates were washed with 1% acetic acid for five times so as to remove the residual dye and then air-dried. The bound stain was subsequently eluted with a 10 mM trizma base, and the absorbance was read on a plate reader at a wavelength of 540 nm with a 690 nm reference wavelength. Percent growth was calculated on a plate-by-plate basis and was expressed as the ratio of average absorbance of the test well to the average absorbance of the control wells. The percentage growth was estimated at each concentration. Percentage growth inhibition was calculated as:

Where Ti is the absorbance of test wells growth and C is the absorbance of control wells growth.
Effects of the combination of CUR and QUE were analyzed by Chou and Talalay’s principle to provide quantitative information on the interaction of the combined drugs. The CI of the combined drugs was determined based on the two drug-effect equation:

Where (Dose)and (Dose), are the dose of drug 1 and drug 2 in the combination, (Dose x)and (Dose x)are the dose of drug 1 and drug 2 as a single drug. The interaction of the two drugs can be classified as synergistic (CI < 1), additive (CI = 1), or antagonistic (CI > 1)based on the % cell viability. In this study, CI values of free drug combinations (CUR and QUE) were determined using this equation,with (Dose x)and (Dose x)being the concentration of free CUR and free QUE in single, (Dose)and (Dose)being the concentration of free CUR and free QUE in the combination[14].
2.3. Preparation of nanoemulsion
Screening based on phase solubility studies with olive oil, oleic acid, and ethyl oleate as oil phase and Tween 20 as a surfactant was performed. Initially, the primary emulsion was prepared by spontaneous emulsion method. Disperse phases containing CUR,QUE, and olive oil were mixed with aqueous phases composed of surfactant (Tween 20) and co-surfactant (polyethylene glycol)using High-Speed Homogeniser (IKA, India). The resulting primary emulsion was transferred into a high-pressure homogenizer (Panda,Italy) at a pressure of 800 psi with 7 cycles.
2.4. Experimental design
Central composite rotatable design-response surface methodology(CCRD-RSM) was applied to systemically investigate the influence of independent factors of nanoemulsion preparation. Two factors with three levels were used to determine the effect of formulation composition variables such as surfactant concentration (X), speed of homogenizer (X) on the response variable globule size (Y),percentage CUR content (Y), and percentage QUE content (Y).Based on CCRD design, expert software shows a total of 9 trials run. Optimization of the formulation was done based on the lowest value for droplet size, and percent content of CUR as well as QUE.The CCRD allows us to independently examine the interaction of variables and interaction of variables with results. All independent variables and levels used are described in Supplementary Table 1. In this design, the best models such as quadratic model can be selected based on the analysis of variance (ANOVA). P-value < 0.05 was considered to be statistically significant[18,19].
2.5. Characterization of nanoemulsion
2.5.1. Droplet size analysis
Droplet size of prepared nanoemulsion was determined by dynamic light scattering, which analyzes the fluctuations in light scattering because of Brownian motion of the particles using a Zetasizer ZS 90 (Malvern Instruments Ltd., UK). The formulation was suitaibly diluted using double distilled water and particle size was determined by measuring the random changes in the intensity of light scattered from a dispersion[20].
2.5.2. Drug content
CUR and QUE from nanoemulsion formulations were extracted by dissolving 1 mL of formulation in methanol and assayed by an HPLC. An HPLC system consists of Agilent Gradient System,column C18 (4.6 mm × 250 mm), and particle size packing (5 μm), diode-array detector. A solvent system with methanol:orthophosphoric acid (0.05%) as 80:20 and 0.8 mL/min flow rate was used for chromatographic separation. The analysis was performed at a wavelength of 254 nm and ambient temperature.
2.5.3. Thermodynamic stability study
Heating cooling cycle: Six cycles between refrigerator temperature 4 ℃ and 45 ℃ with storage at each temperature for not less than 48 h.
Centrifugation: The nanoemulsion formulation was centrifuged(REMI International, Mumbai, India) at 2 000 rpm for 30 min and observed for instability (creaming, cracking, phase separation). If the formulation did not show any sign of instability, it was subjected to a freeze-thaw stress test.
Freeze-thaw cycle: The formulation was subjected to three freezethaw cycles at temperatures between -21 ℃ and 25 ℃ with storage at each temperature for not less than 48 h.
2.5.4. Zeta potential determination
The charge on the droplets of nanoemulsion is an additional property that should be assessed. The formulation (0.1 mL) was diluted suitably using double distilled water and analyzed using Zetasizer ZS 90 (Malvern Instruments Ltd. UK).
2.5.5. Cryo-scanning electron microscopy (SEM)Morphology of colloidal system was analyzed by Cryo-SEM using
FEG SEM equipped with Cryo unit (JSM-7600F). The nanoemulsion sample (10 μL) was placed on carbon conductive adhesive tape
mounted on specimen stub. The mounted sample was frozen at-190 ℃ in liquid nitrogen. The frozen sample was transferred to the preparation chamber, maintained at -130 ℃ and sublimed at -90 ℃for 10 min followed by coating with platinum. It was then transferred to the SEM chamber at -150 ℃ with an accelerating voltage of 5.0 kV.
2.5.6. Drug release studies
Dialysis membrane (Himedia, India, Avg Mol wt.cutoff: 12 000-14 000 kDa) was used as diffusion membrane. Pieces of dialysis membrane were soaked in phosphate buffer saline (PBS) pH 6.4 for 24 h before experiment and inserted in Franz diffusion cells assembly. PBS pH 6.4 containing 2% methanol (25 mL) at (37 ±0.5) ℃ was added to the receiver chamber. A total of 100 μL of CUR-QUE nanoemulsion was dispersed in the donor chamber.At predetermined time points, samples were withdrawn from the receiver compartment, replacing the sampled volume with PBS pH 6.4 containing 2% of methanol after each sampling, for a period of 4 h. The withdrawn samples were filtered and used for analysis. The release amount of drugs was determined using an HPLC at 254 nm.
2.5.7. Histological examination
Histopathological examinations were carried out using isolated sheep nasal mucosa. Three sheep nasal mucosa pieces with uniform thickness were selected and mounted on Franz diffusion cells. Nasal mucosa was treated with PBS (pH 6.4, negative control) (A), with optimized nanoemulsion formulation (F9) (B), and was treated with isopropyl alcohol (positive control) (C), respectively. All the samples were washed properly with double distilled water 6 h after treatment,sectioned, and stained with hematoxylin and eosin. The dissected mucosa was subjected to histological studies to evaluate the toxicities of nanoemulsion, and photographed by optical microscope(Motic,China)[21].
2.6. In vivo studies
2.6.1. Ethical statement
The in vivo studies were performed as per the CPCSEA guidelines.The animal study protocol was duly approved by the IAEC of RCPIPER, Shirpur and the registration number was 651/PO/ReBi/C/02/CPCSEA.
2.6.2. Animals and grouping
A brain-distribution study was carried out using male albino Wistar rats weighing 200-250 g (age 10-12 weeks). The rats were anastheized with an intraperitoneal injection of phenobarbitone (40 mg/kg) and kept on a heating pad to maintain the body temperature;which were divided into two groups with 6 rats in each group. In GroupⅠ, 100 μL of the nanoemulsion formulation (F9) containing a synergistic combination of CUR and QUE were instilled into the nostril nasal administration device. The rats were held from the back in slanted position during intranasal administration. For GroupⅡ,100 μL of the pure drug suspension (PDS) containing CUR and QUE was injected intravenously with the help of a tuberculin syringe. The rats were euthanatized by using a COchamber (carcass disposal: deep burying under soil)-disposal post-experimentation.The rats were sacrificed at different time intervals and the animals were decapitated immediately after blood collection. The skull was cut open and the brain was carefully excised. Each brain tissue was quickly rinsed with saline. The brain tissue samples were homogenized with 1 volume of saline in a tissue homogenizer. Blood samples were anticoagulated with heparin and centrifuged at 5 000 rpm for 10 min to obtain plasma. At each time point, 6 rats were taken for measurements. All plasma samples and brain homogenates were stored for up to 48 h in a deep freezer (-70 ℃) until HPLC analysis[22].
2.6.3. Sample processing
About 2 mL of extraction solvent (i.e. acetonitrile) was spiked to 100 μL of brain homogenate or plasma sample and mixed for 20 min. This sample was ultracentrifuged at 10 000 rpm for 10 min. The supernatant layer was collected and 20 μL was injected in HPLC system. The whole procedure was carried out at room temperature.
2.6.4. Chromatographic conditions
The chromatographic separation was performed at ambient temperature with reversed-phase, 150 mm × 4 mm base specific column packed with 5 μm C18 column (Eclipsed XDB 5 μm, 4.6 mm× 150 mm, Singapore). The mobile phase was a mixture of methanol:0.05% orthophoshopric acid (80:20 v/v) pumped at a flow rate of 0.8 mL/min. Detection was performed at a wavelength of 254 nm at ambient temperature.
2.6.5. Data analysis
The non-compartmental model was considered for computation of the different pharmacokinetic parameters. The Kinetica 5(Thermo Fisher Scientific Inc. Waltham, Massachusetts, United States) software was employed for the estimation of Cand Tobtained from the drug concentration vs. time plot. To calculate the area under concentration-time curve (AUC), the trapezoidal method was used. Drug targeting efficiency (DTE) representing a time-average partitioning ratio and % direct transport percentage(DTP) representing the percentage of drug directly transported to the brain via the olfactory pathway were calculated to estimate the brain targeting after nasal dosing as previously reported by us[22].
2.6.6. In vivo anticancer activity (allograft model)In vivo anticancer activity was performed in nude mice. For subcutaneous allograft models, patient-derived glioblastoma U87MG cell line was implanted subcutaneously. Total 12 female nude mice aged 8-10 weeks (weight 17 to 19 g) were used for the experiment and were divided into the following groups: Group 1 (treated with curcumin), Group 2 (treated with quercetin), Group 3 (treated with quercetin and curcumin), Group 4 (treated with nanoemulsion),Group 5 (untreated control group) and Group 6 (treated with doxyrubicin, standard group). Mice were housed on 12/12 light dark cycle and were given drinking water and fed ad libitum. Briefly U87MG glioblastoma cells (1×10) were injected into the back of the mice and allowed to form tumors (Deshpande Laboratories Pvt. Ltd, India).Tumors were minced and regrafted in experimental animals[23-25].The test sample was administered after the tumor reached a palpable size. The test sample was given 0.1 mL per 10 g bodyweight for 15 d.Tumor volumes were measured using digital vernier calipers (Mitutoyo JAPAN). Tumor volume was calculated as follows.

The animals were sacrificed by cervical dislocation at the end of experiment. The animals were dissected and tumors were excised.The excised tumors were immediately photographed.
2.7. Statistical analysis
Results are expressed as the mean±SD of at least three experiments.Statistical significance was assessed using the Student t-test with P<0.05 as the minimal level of significance. Statistical analyses were performed using Graph Pad Prism 5.0 software.
3. Results
3.1. Determination of synergistic combination
Synergistic combination analysis was performed by using SRB assay in human glioblastoma U373MG cell line. Results demonstrated that CUR and QUE (2:1) combination produced comparable % cell growth inhibition as that of adrenomycin at
different concentrations (10-80 μg/mL) (Figure 1).

Figure 1. Growth curve of human astrocytoma-glioblastoma cell line U373MG. ADR: adrenomycin.
3.2. Formulation of nanoemulsion
3.2.1. Selection of oil, surfactant, and co-surfactant The solubility of CUR and QUE in (2:1) combination was found to be highest in olive oil than oleic acid and ethyl oleate. Surfactant(Tween 20) solubilized the maximum amount of drugs in oleic oil hence it was chosen as the surfactant for the nanoemulsion development. Polyethylene glycol 400 (PEG400) was selected as the co-surfactant which showed a greater ability to reduce interfacial tension to form a stable nanoemulsion.
3.2.2. Experimental design Polynomial equation showed the relationship between independent variables and response variables such as droplet size (Y), drug content of CUR (Y), and drug content of QUE (Y), respectively.Values such as R, SD, % coefficient of variation are depicted in Table 1.

Table 1. Regression analysis for responses Y1, Y2, and Y3.
Y= 112.84 - 38.72*X-13.43*X………………………(4)Y= 18.71 + 27.50*X-16.62*X-20.50*X*X+5.92*X
-7.26*X….(5)Y= 10.07-26.56*X-18.07*X-21.75*X*X+24.64*X-7.33*X…(6)Where, Y= droplet size (nm), Y= drug content of CUR (%), Y=drug content of QUE (%). X= surfactant concentration, X= speed of homogenizer.
3.2.3. Response surface plots
Response surface plot showing effect of surfactant concentration and speed of homogenizer on droplet size (Y) is presented in Figure 2A. Response surface plots showing effect of surfactant concentration and speed of homogenizer on % content of CUR (Y)and % content of QUE (Y) are presented in Figures 2B and 2C.
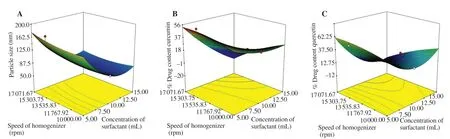
Figure 2. Effect of interaction between speed of homogenization and concentration of surfactant on globule size (A); interaction between speed of homogenization and concentration of surfactant on % content CUR (B); interaction between speed of homogenization and concentration of surfactant on %content QUE (C).
3.3. Characterizations of nanoemulsion
3.3.1. Droplet size analysis
Droplet size of the prepared nanoemulsions was determined and the results are shown in Supplementary Table 1. The formulation 9 (F9)was optimized as the droplet size of 93.0 nm with a polydispersity index of 0.149. The diameter of the dispersed oil droplets of the optimized nanoemulsion (F9) was smaller than 200 nm, and such droplets are considered to be suitable for intranasal administration to achieve brain targeting.
3.3.2. Drug content determination
The content of CUR in optimized nanoemulsion (F9) was 42.44%and 55.15% for QUE.
3.3.3. Zeta potential determination Zeta potential of optimized nanoemulsion (F9) was -14.8 mV. The zeta potential value was found to in between -30 to 30 mV.
3.3.4. Thermodynamic stability
Optimized nanoemulsion formulation (F9) was stable on thermodynamic stability testing such as heating-cooling cycle,freeze-thaw cycle, and centrifugation, which demonstrated longterm stability of formulation under extreme conditions of storage,handling, and transportation.
3.3.5. Cryo-SEM Droplets of nanoemulsion were found spherical shape with 100 nm size (Figure 3), which was in good agreement with the results of size analysis by dynamic light scattering.
3.3.6. In vitro drug release
The release profile showed that the release percentage of CUR from optimized batches (F9) was (95.84 ± 0.34)% and PDS was(52.62 ± 0.13)% through the dialysis membrane at PBS (pH 6.4);while release percentage of QUE was (94.02 ± 0.47)% and PDS was(43.02 ± 0.61)% at the end of 4 h (Figure 4). Korsmeyer-Peppa’s equation release exponent (n) was 0.85 for CUR and 0.87 for QUE.
3.3.7. Histopathological studies
Histological studies showed negative control mucosa (normal nasal mucosa) (Figure 5A), positive control mucosa (isopropyl alcoholtreated mucosa) (Figure 5B), and no change in mucosal structure treated with F9 (Figure 5C) as compared to the positive control.
3.4. Pharmacokinetics and brain-distribution studies
The results of biodistribution studies showed that CUR and QUE concentrations in the brain and plasma were higher after intranasal administration of drug-loaded nanoemulsion (CUR-QUE) as compared to intravenous administration of pure drug suspension(PDS). The maximum concentrations of CUR and QUE levels in the brain were achieved 10 min after administration; while maximum concentrations of CUR and QUE level in plasma were achieved 30 min after administration. A statistically significant difference(P<0.05) between the two formulations was found (Table 2).
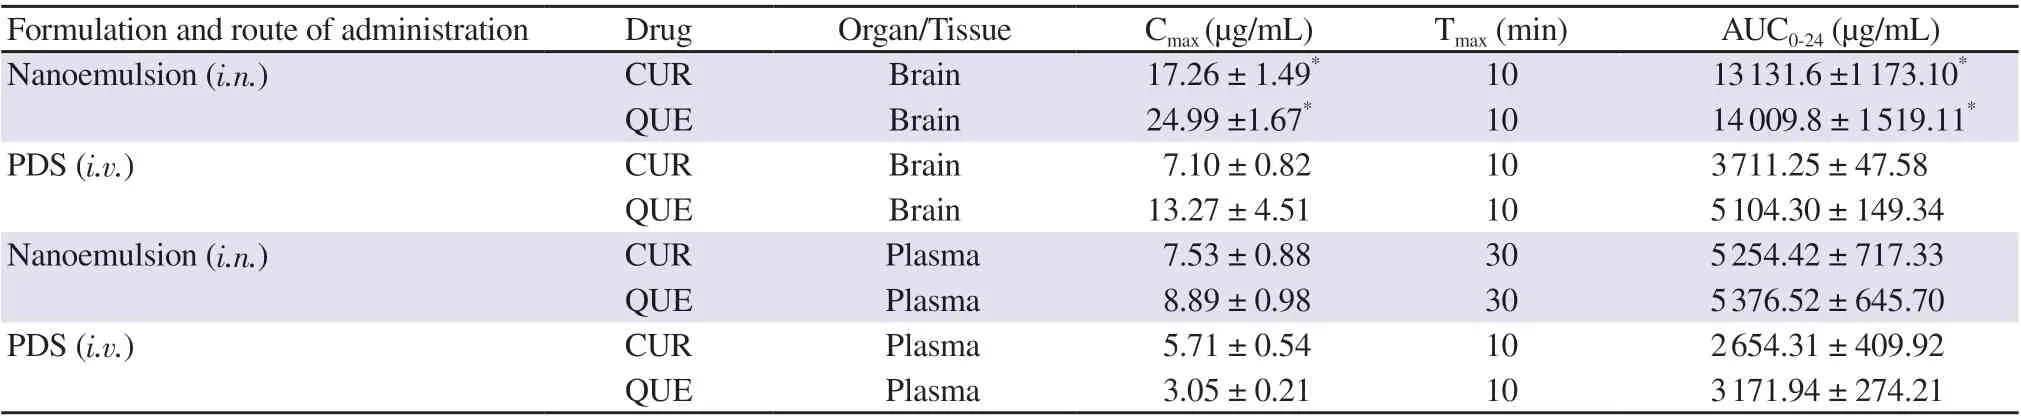
Table 2. Pharmacokinetics parameters of CUR-QUE nanoemulsion (F9) following intranasal (i.n.) and intravenous (i.v.) administration.
After intranasal administration of nanoemulsion, the % DTE was(178.25 ± 2.86)% and % DTP was (44.05 ± 0.93)% for CUR; while% DTE was (170.54 ± 6.11)% and % DTP was (38.25 ± 0.83)% for QUE.
3.5. In vivo anticancer activity
Tumor volume was recorded before administration, at the end of 3,6, 9, 12, and 15 days after administration. Figures 6A & 6B showed comparative tumor growth among different treatment groups. Tumor volume in doxorubicin-treated group was decreased during treatment.Significant tumor growth inhibition was observed in the nanoemulsiontreated group (tumor volume less than 600) as well as the doxorubicin treated group (tumor volume less than 200) in comparison with the untreated group (tumor volume less than 1 200).

Figure 3. Cryo-scanning electron micrographs of drug loaded nanoemulsion (F9). A: ×55 000 and B: ×50 000.

Figure 4. % Drug release and release mechanism of nanoemulsion formulation (NE) (F9) and pure drugs suspension (PDS), A & B for CUR and C & D for QUE, respectively.

Figure 5. Hematoxylin and eosin stained photomicrograph illustrating the histopathological changes in nasal mucosa. Arrow represents nasal mucosa changes after 2 h exposure to negative control (A, PBS pH 6.4), positive control (B, isopropyl alcohol), and nanoemulsion formulation (F9) (C) (Magnification 100×)..

Figure 6. Tumor volume (A) and photograph of tumor after treatment (B).C: CUR, Q: QUE, doxorubicin: standard, UT: untreated, NM: nanoemulsion formulation (F9) and C+Q: synergestic combination of CUR+QUE.
4. Discussion
Individual administration of CUR or QUE was not effective against the human glioblastoma U373MG cell line. Growth inhibitory 50% (GI)values of the combination of CUR + QUE at 2:1 were <10 μg/mL, which indicated less cellular viability and higher cytotoxicity. To confirm the synergistic effect quantitatively, the CI value was calculated and was found to be 0.99, which confirmed optimal synergistic effect of combination of CUR and QUE at 2:1 against human glioblastoma U373-MG cell line.
The droplet size of nanoemulsion was decreased as the surfactant concentration and the speed of homogenizer increased. The droplet size decreased from 178.3 nm to 54 nm with increase in amount of surfactantcosurfactant 5 to 15 mL at 15 000 rpm. Similarly droplet size decreases from 185.9 to 178.3 nm with increase in speed of homogenizer from 5 000 to 1 5000. The content of CUR and QUE was increased with increase in the surfactant concentration, which could be due to improved emulsification of both compounds by surfactant and cosurfactant combination.
A numerical optimization technique using desirability approach was proposed to develop a new formulation with desired response i.e. smaller globule size and maximum content of CUR and QUE.
The in-vitro drug release pattern from the formulation containing CUR and QUE exhibited first-order release kinetic model of anomalous non fickian diffusion mechanism.
Histological examination result shows that the section of the mucosa treated with nanoemulsion formulation revealed no changes in nasal epithelium and the formulation had no remarkable destructive effect on nasal mucosa. It indicates that nasal administration of nanoemulsion formulations may be safe.
Delivery of CUR and QUE to the CNS was significantly enhanced by intranasal administration of nanoemulsion as compared to intravenous administration of PDS. This could be related to the rapid absorption and longer residence time of the nanoemulsion in the nasal cavity of rats,which provides an opportunity for intranasal delivery to the brain via the olfactory pathway. Thus, the results prove that drugs could be transported directly to the CNS after intranasal administration of nanoemulsion,thereby enhancing drug concentration in the brain and also enhancing the nasal bioavailability of CUR and QUE.
To demonstrate targeting efficiency of the nose to brain direct transport following intravenous administration of nanoemulsion, % DTP and %DTE were calculated. It suggests that nanoemulsion has better brain targeting efficiency mainly because of substantial % DTP via the olfactory region of the nasal cavity. These findings are in high agreement with related reports showing that nanoemulsion increases nose-to-brain uptake of drugs[22].
Significant tumor growth inhibition was observed in the doxorubicintreated group. Comparable growth inhibition was observed in the CUR-QUE combination-treated group and nanoemulsion formulationtreated group. Besides, CUR and QUE also reduced tumor volume in comparison with the untreated group. Earlier studies have demonstrated the anticancer potential of the combination of CUR and QUE[26-28]. In our study, we use CUR and QUE at lower concentrations for combination to reduce toxicity and side effects. Intranasal administration of CUR and QUE-loaded nanoemulsion can be a promising approach to the treatment of brain tumors. However, further studies still need to explore mechanism of the combination therapy in treating carcinomas and further development of nanoformulation.
Conflict of interest statement
The authors declare no conflict of interest.
Authors’ contributions
HSM contributed to the design and writing of the manuscript and it was formatted and proofread by NDP.
 Asian Pacific Journal of Tropical Biomedicine2021年11期
- Asian Pacific Journal of Tropical Biomedicine的其它文章
- Phytochemicals, pharmacological and ethnomedicinal studies of Artocarpus: A scoping review
- Crotalaria ferruginea extract attenuates lipopolysaccharide-induced acute lung injury in mice by inhibiting MAPK/NF-κB signaling pathways
- Anti-inflammatory and antipyretic potential of Arbutus andrachne L. methanolic leaf extract in rats
- Chrysanthemum indicum ethanol extract attenuates hepatic stellate cell activation in vitro and thioacetamide-induced hepatofibrosis in rats