
One extraction tool for in vitro-in vivo extrapolation? SPME-based metabolomics of in vitro 2D,3D,and in vivo mouse melanoma models
2021-11-11 13:38KarolJarochPaulinaTaczynskaMartaCzechowskaJoannaBogusiewiczKamiluczykowskiKatarzynaBurlikowskaBarbaraBojko
Karol Jaroch, Paulina Taczyˊnska, Marta Czechowska, Joanna Bogusiewicz,Kamil Łuczykowski, Katarzyna Burlikowska, Barbara Bojko
Department of Pharmacodynamics and Molecular Pharmacology,Faculty of Pharmacy,Collegium Medicum in Bydgoszcz,Nicolaus Copernicus University in Toruˊn Poland, 85-089, Bydgoszcz, Poland
Keywords:Solid-phase microextraction In vitro-in vivo extrapolation Metabolomics Melanoma B16F0 C57BL6 mouse model
ABSTRACT Solid phase microextraction (SPME) in combination with high-resolution mass spectrometry was employed for the determination of metabolomic profile of mouse melanoma growth within in vitro 2D,in vitro 3D, and in vivo models. Such multi-model approach had never been investigated before. Due to the low-invasiveness of SPME, it was possible to perform time-course analysis, which allowed building time profile of biochemical reactions in the studied material. Such approach does not require the multiplication of samples as subsequent analyses are performed from the very same cell culture or from the same individual. SPME already reduces the number of animals required for experiment;therefore,it is with good concordance with the 3Rs rule (replacement, reduction, and refinement). Among tested models, the largest number of compounds was found within the in vitro 2D cell culture model, while in vivo and in vitro 3D models had the lowest number of detected compounds. These results may be connected with a higher metabolic rate, as well as lower integrity of the in vitro 2D model compared to the in vitro 3D model resulting in a lower number of compounds released into medium in the latter model.In terms of in vitro-in vivo extrapolation,the in vitro 2D model performed more similar to in vivo model compared to in vitro 3D model;however,it might have been due to the fact that only compounds secreted to medium were investigated. Thus, in further experiments to obtain full metabolome information, the intraspheroidal assessment or spheroid dissociation would be necessary.
1. Introduction
Arthur and Pawliszyn [1] first introduced solid-phase microextraction (SPME) in 1990. The principle of this extraction methodology lies in the equilibrium state established between the concentrations of analytes in the sample and the fiber's coating[2].SPME occurs only via the free fraction of analytes, and generally only applies to low molecular weight compounds(<1500 Da),as is the case for the majority of commercially available and lab-made extractive phases developed to date.When an SPME sampling device is immersed inside a sample containing binding macromolecules such as proteins(e.g.,enzymes),such compounds are unable to penetrate the extractive phase;thus,small compounds adsorbed(extraction occurs by physical interaction of analyte and the coating surface) or absorbed (extraction occurs by partitioning of analytes into coating phase) by the porous sorbent are protected from enzymatic degeneration[2].Consequently,small molecules with a short lifetime can be successfully extracted [3]. As mentioned before, SPME is an equilibrium-based sample preparation technique, which, together with low-recovery rates, can lead to nondepletive extraction; thus, the decrease of compounds in the sample as a function of extraction is often negligible.Moreover,by integrating the sample preparation and extraction steps, SPME drastically decreases sample consumption, thus enabling multiple extractions from the same set of samples over time. Indeed, SPME applications directed at sampling of biological samples are often referred to as“chemical biopsy”[4,5].Together,these properties of SPME enable the construction of time profiles of biochemical reactions in the studied matrices without the need for sample multiplication, as the original matrices can be conserved and continuously sampled over time. This, in turn, leads to a minimization of sample variability.Therefore,SPME seems to be a perfect analytical tool to be employed for the determination of analytes excreted by cell cultures, especially using 96-well plates, as the sample amount is significantly limited.
In biological applications, SPME is also characterized by“balanced coverage”; in other words, SPME enables extraction of both polar and non-polar analytes from biological matrices.This is explained by the fact that while polar compounds have low affinity for the SPME sorbent, the low protein binding typical of these compounds in such matrices results in high free concentrations of these compounds.On the other hand,non-polar compounds,which have high affinity for SPME sorbents, are usually highly bound to proteins and other matrix components,and are thus present in low levels in their free concentrations. These two ‘balancing forces’together enable balanced extraction of both types of analytes by the sorbent from biological matrices in relatively similar amounts[6,7].
For researchers, an important feature of in vitro assays lies in their ability to generate patterns similar to in vivo states. This approach is called in vitro-in vivo extrapolation (IVIVE). The main goal of IVIVE studies is to design such an in vitro platform that in vivo animal-based tests are no longer be necessary during the drug development process.Having an in vitro assay that is accurate in terms of IVIVE would provide compliance with the 3Rs rule(replacement, reduction, and refinement) implemented to animal research [8]. Accurate in vitro assays would especially help in complying with replacement and reduction.In this respect,SPME is presented as an ideal sampling tool capable of fulfilling the animalresearch requirements for reliable IVIVE platforms, while also reducing environmental waste as well as enabling cost savings.Due to its minimally invasive nature, SPME enables monitoring of biosystem(s) without disturbing said systems, thus enabling multiple extractions from the very same cell culture as well as the same individual over time. Such an advantage largely reduces the number of biological replicates needed in such studies while also minimizing inter-sample variability. Conversely, in time-course analyses of tumor tissue in in vivo mouse model, traditional sample preparation techniques such as solid-liquid extraction (SLE)require a separate group of specimens for each time point planned in the experimental design due to their exhaustive nature, an approach that does not comply with the 3Rs rule.
SPME has been widely applied in both targeted and untargeted analyses of complex matrices, including in a variety of metabolomics applications involving matrices such as biofluids and tissues, both for the purposes of selecting (untargeted) as well as monitoring (targeted) metabolites of interest i.e., potential biomarkers [9]. Coupling of SPME with high-resolution mass spectrometry (HRMS), e.g., orbitrap mass spectrometer or time-offlight, enables detection of metabolites with high mass accuracy and thus precise identification of these low molecular weight compounds.SPME has also been shown to be suitable for extraction of metabolites excreted by cell cultures [10,11].
Liquid chromatography-mass spectrometry (LC-MS) is widely used for metabolomics studies. An untargeted analysis allows for a wider insight into the overall metabolism of cells, while targeted analyses are ideal for monitoring of biomarkers.In order to compare different sample types,e.g.,in vitro and in vivo,and thus extrapolate findings, it is generally recommended that the same analytical workflow be adopted throughout the study for both types of samples, from sample preparation to LC-MS analysis. The fewer differences in analytical protocols, the more certain one may be that any variability in the final comparative results stem from biological factors,but not from divergences in the mentioned procedures that may have led to dissimilarities in compound coverage.The current ‘gold standard’analytical approach for sample preparation and extraction in in vitro cell studies is protein precipitation (PP), in which an organic reagent (e.g., methanol or acetonitrile, etc.) is added to the liquid sample to denature proteins and simultaneously extract organic compounds.The introduction of organic solution into in vitro cell cultures is a terminal protocol;thus,new samples are needed for each time point of the experiment.PP is most commonly selected for such applications due to its relative ease of use and efficiency;however, it necessitates new cell seedings for subsequent time points of the analysis,a disadvantage that in addition to being costly and time-consuming may also introduce biological variances, as immortalized cell lines are known to undergo changes between individual passages [12]. SLE, on the other hand, is the current ‘gold standard’ for in vivo model studies. However, application of SLE necessitates homogenization of tissue sample for analysis;thus,SLE is only suitable for ex vivo analysis. Previous studies have demonstrated that in vivo versus ex vivo metabolomics patterns may vary significantly. For instance, in previous work [3], in vivo SPME extracted 70 additional features when compared to ex vivo SPME,PP,or ultrafiltration.Only SPME,both in in vivo and ex vivo experiments,was capable of extracting very labile compounds such as β-nicotinamide adenine dinucleotide and adenosine monophosphate.Furthermore, only in vivo SPME enabled precise determination of the ratio of glutathione to oxidized glutathione (2.5) as previously established in the literature; in other words, in vivo SPME was the only technique among the above mentioned that provided sufficient metabolism quenching[3].However,this study was carried out with the use of mouse blood as matrix;for a tissue-based approach,it is expected that the homogenization step (necessary for non-SPME approaches) would introduce even more discrepancies with respect to low abundance compounds in comparison to the in vivo state of this matrix.
Given the previously described features of SPME, as well as limitations related to sample consumption when traditional techniques such as PP or SLE are used,we proposed the use of SPME for untargeted metabolomics of in vitro 2D and in vitro 3D cell cultures as well as in vivo mouse model of murine B16F10 melanoma with the aim to describe biochemical changes during tumor growth.
2. Materials and methods
2.1. General SPME protocol
SPME fibers were manufactured in-house with 5 μm hydrophilic-lipophilic balanced particles kindly provided by Prof.Pawliszyn (University of Waterloo,Waterloo, Canada). The coating protocol was adopted from Gˊomez-Ríos et al. [13]. Coating length was 2 mm, and two layers of coating were applied to each fashioned device. All other chemicals were of LC-MS grade (Merck,Poznaˊn, Poland) unless stated otherwise. Preconditioning of SPME fibers was carried out overnight with a methanol:water solution(1:1,V/V)under static conditions.Fibers were rinsed with water for 5 s without agitation directly prior to extraction. Extractions from 96-well plates containing in vitro 2D and in vitro 3D cell cultures were carried out for 30 min by direct immersion of fibers in 100 μL of samples. In vivo sampling from a tumor was carried out by insertion of fibers into tissue for 15 min. Following extraction, in in vitro and in vivo experiments,fibers were rinsed with water for 5 s without agitation so as to remove any matrix components loosely attached to the fibers. Desorption was carried out in acetonitrile:water solution (4:1,V/V) for 90 min with orbital shaker agitation set at 1,200 rpm, using a desorption solution volume of 100 μL. Subsequently, extracts were submitted to instrumental analysis on an LC-MS system.
2.2. General cell culture protocol
A B16F10 cell line was cultivated at 37°C and 5%CO2with RPMI-1640 with L-glutamine and sodium bicarbonate (R8758, Sigma-Aldrich, Poznaˊn, Poland), with 10% fetal bovine serum (Biowest,Nuaillˊe, France), as well as antibiotics and antimycotic (A5955,Sigma-Aldrich, Poznaˊn, Poland) with addition of ciprofloxacin(17850, Sigma-Aldrich, Poznaˊn, Poland).
2.3. In vitro 2D cell culture extraction protocol
A total of 1000 cells per well were seeded on a 96-well plate.The SPME protocol was implemented following 24(T1),48(T2),and 72(T3) h of initial plating. Experiments were conducted on four separate cell culture replicates.A representative photograph of the sampling step is shown on Figs.1A and B [11].
2.4. In vitro 3D cell culture extraction protocol
A total of 1000 cells per well were seeded onto an ultra-low adhesive 96-well plate (Nunclon Sphera, U-bottom, Thermo-Fisher Scientific, Waltham, MA, USA). The plate was gently transferred into a centrifuge and spun under 200gfor 4 min.The SPME protocol was carried out at 5(T1)and 8(T2)days of initial plating.Experiments were conducted on four separate cell culture replicates.A representative photograph of the sampling step is shown in Figs.1A and B [11].
2.5. In vivo extraction protocol
Adult male mice C57BL6/cmdb (6-8 weeks old) were utilized for this study. Animals were housed in a controlled environment under the following conditions:temperature(22±2)°C,12 h lightdark cycle, humidity (55 ± 10)%, with food and water available ad libitum. Mice were administered isoflurane and kept under anesthesia throughout the extraction procedure. The inguinal region part of the leg was sampled with SPME fibers (Fig.1B). In order to penetrate the skin,fibers were housed in hypodermic needles that were used to guide the fibers to the proper sampling location in the leg. Once the fiber coating was inserted into the tissue, the needle was removed. Sampling was performed before tumor inoculation(T0) then following inoculation with B16F10 cells (2 × 10⁶per 100 μL phosphate buffer saline (PBS) per animal) [14]. Tumor sampling was carried out 10 days after inoculation, once tumors reached a size of ca. 5 mm in diameter (T1 on 10th day after inoculation) and after an additional 4 days (T2 on 14th day after inoculation).A total of two animals were used for experiments,and two fibers per animal were used for each time point. Once samplings for the last time point of sample collection were finished,the mice were sacrificed by manual cervical dislocation, resulting in euthanasia within approximately 10 s. The study was conducted under a research protocol reviewed and approved by the Local Ethical Committee on Animal Testing at the Faculty of Animal Breeding and Biology, University of Science and Technology in Bydgoszcz(Approval No.25/2018).All the procedures were carried out in accordance with relevant guidelines, and all sampling procedures carried out on living animals were performed under anesthesia as described above, and all precautions were taken to minimize suffering.
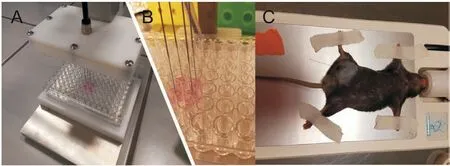
Fig.1.Solid phase microextraction(SPME)device for(A and B)in vitro 2D,in vitro 3D,and (C) in vivo sampling procedure.
2.6. LC-HRMS analysis
The LC-MS system consisted of a Dionex UltiMate 3000 RS autosampler, Dionex Ultimate 3000 RS pump (Thermo Fisher Scientific, Bremen, Germany), and a Q-Exactive Focus high resolution mass spectrometer(Thermo Fisher Scientific, Bremen, Germany).
Chromatographic separation was performed using reversed phase pentafluorophenyl(PFP)Discovery HS F5column(100 mm ⅹ2.1 mm, 3 μm, Supelco, Bellefonte, PA, USA) with mobile phase consisting of 99.9%water+0.1%formic acid(mobile phase A)and 99.9% acetonitrile + 0.1% formic acid (mobile phase B). The LC gradient for the PFP column was adopted from the study by Vuckovic and Pawliszyn [15] and consisted of the following gradient conditions:0-3 min 0%B,3-25 min linear gradient to 90%B,25-34 min 90%B,34-40 min 0%B,and a flow of 0.3 mL/min.All solvents and additives used for SPME and LC-MS analysis were of LC-MS grade.The injection order of all the three protocols(in vitro 2D,in vitro 3D and in vivo)was randomized for each set of samples,and fiber blanks and pooled quality control (QC) samples were utilized for background determination and data normalization,respectively. Fiber blanks were prepared by rinsing fibers with water for 5 s, then submitting fibers to the same preconditioning and desorption steps utilized for sampling fibers, as described above.
The MS was operated in positive ionization mode, with heat assisted electrospray ionization ion source parameters set as follows: spray voltage 1500 V, capillary temperature 300°C, sheath gas 40 a.u.,auxiliary gas flow rate 15 a.u.,probe heater temperature 300°C, S-Lens RF level 55%. Data acquisition was performed via Xcalibur software v. 4.0. The MS was calibrated using Pierce LTQ Velos ESI Positive Ion Calibration Solution (88323, Thermo Fisher Scientific, Bremen, Germany) every 72 h according to the manufacturer's protocol.
2.7. Data processing and statistical analysis
Datasets for each protocol carried out in this study, namely in vitro 2D, in vitro 3D, and in vivo, were analyzed individually, with each protocol being designated their own set of fiber blanks and pooled quality control(QC)samples.Data processing and statistical analyses were performed on Compound Discoverer 2.1. software(Thermo Fisher Scientific, Bremen, Germany). The selected mass tolerance window was set to 3 ppm, the signal-to-noise threshold to 10,and the maximum sample-to-blank ratio to 5(where a value lower than 5 marked a feature as background). Minimal peak intensity was set to 5000. Pooled QC samples were used for data mean normalization with minimal QC coverage set to 50%and max QC area RSD set to 50%.Compounds were automatically annotated by Compound Discoverer 2.1 software using ChemSpider and the databases BioCyc, Human Metabolome Database, and KEGG with 3 ppm tolerance. Statistical software (ver 13.1 Dell Inc., Tulsa, OK,USA) was used for chart generation based on normalized data provided by Compound Discoverer 2.1 software. Scopus and PubMed databases were searched using phrases such as“B16”and“Metabolomics” or “B16F10” and “Metabolomics” to evaluate whether the annotated compounds were biologically important according to previous studies. The quality of the peaks picked by the Compound Discoverer 2.1 software was also scrutinized by a manual inspection of chromatograms.
3. Results and discussion
While the executed protocols did not consider quantitative analysis, qualitative comparisons between results obtained for subsequent experiments, i.e., in vitro 2D, in vitro 3D and in vivo experiments, were performed. After filtering of data to remove background compounds present in fiber blank samples and compounds that did not meet reproducibility requirements,compound counts were determined. For in vitro 2D analysis, a total of 54986 features constituting 8117 compounds were found, among which 810 unique compounds were positively identified using databases and 34 were found relevant to the B16F10 model(Figs. 2A-C). For in vitro 3D analysis, a total of 26998 features, 3933 compounds,with 680 hits and 16 compounds relevant to the B16F10 cell line were determined(Figs.2D-F).For in vivo analysis,a total of 35944 features,5946 compounds,785 compounds identified in databases,and 30 with biological meaning (Figs. 2G-I) were found.
A comparison of total (unfiltered) numbers of features and putatively identified compounds found in the analyses showed that the best coverage was observed in the in vitro 2D model (Fig. 3).Considering in vitro models only, the number of compounds secreted into the sampled medium correlates with the metabolic capacity of cell cultures, which is connected with their proton production rate (PPR). The PPR, in turn, is related to glycolysis,which results in the production of lactate and protons (H+), and thus in the acidification of cell culture[16,17].The larger number of compounds found in the in vitro 2D cell line may be partially owed to the faster metabolism (higher PPR) of monolayer cultures as compared to spheroids,a phenomenon which has been previously reported in the literature [18]. Another cause of this result may concern the higher integrity of spheroid cultures than that of monolayer cultures. In a previous drug penetration study utilizing the hanging-drop technique, the authors concluded that the integrity of in vitro 3D spheroids hindered drug penetration as compared to that attained in the in vitro 2D model[19].As the cell intake rate in in vitro 3D is lower than that in in vitro 2D models,it is expected that the efflux into medium will also be slower. The hanging-drop and ultra-low adhesive in vitro 3D models (utilized in present study) can be considered to yield equivalent results, as both techniques result in spheroid formation. Since both techniques anchorage independently, i.e., no scaffolds or extracellular matrix used, the created spheroids are thus similar in terms of morphology [20]. Additionally, due to the much slower proliferation rate of the in vitro 3D model as compared to the in vitro 2D model, a longer incubation time for in vitro 3D cell cultures(eight days)was employed.This might have led to a decrease in medium components since the medium was not replaced or replenished during this time; therefore, the medium components were likely present in lower amounts than required for SPME-LC-HRMS detection.

Fig.2.Scatter plots representing respectively numbers of features, compounds, and ChemSpider hits within (A-C) in vitro 2D model, (D-F) in vitro 3D model and (G-I) in vivo mouse melanoma model. Blue dots represent biologically important compounds.

Fig.3.Chart representing the number of features and compounds per study group,with bars representing standard deviations.
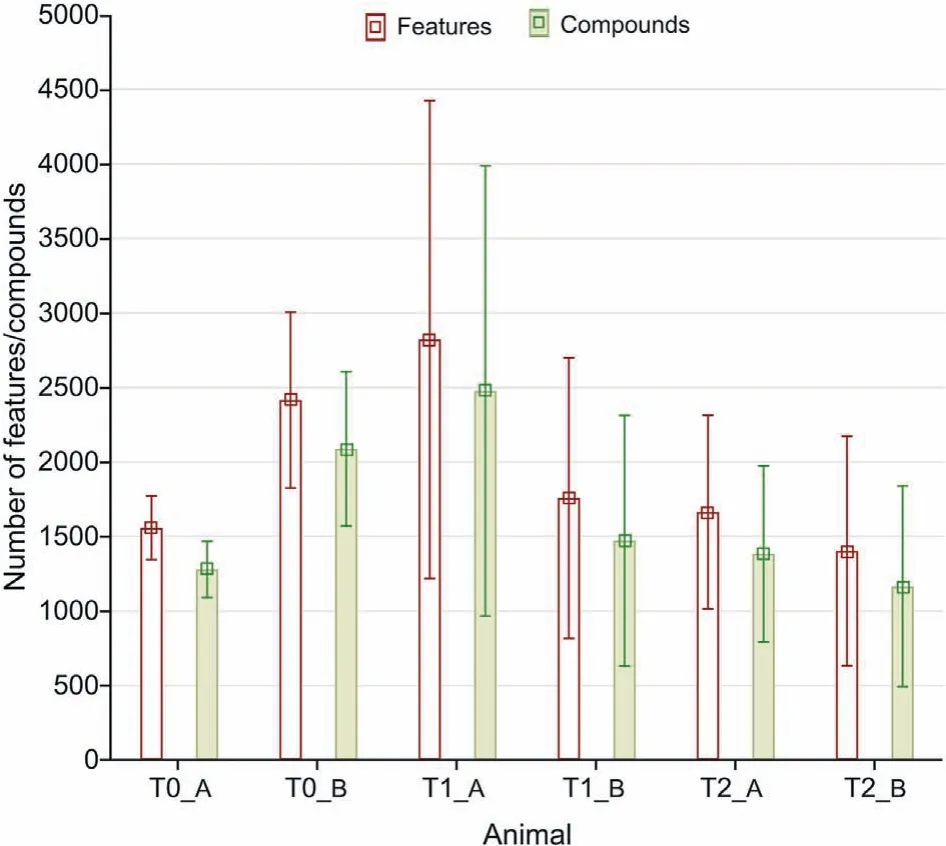
Fig.4.Chart representing insight into the in vivo count of features and compounds(A:mouse #1; B: mouse #2). Bars represent standard deviations.
Given that SPME is an equilibrium-based approach,the amount of compounds that can be extracted from a matrix by a given coating strongly relies on various parameters, e.g., time, temperature, and matrix composition. Unsurprisingly, 30 min extractions from the in vitro 2D model enabled detection of more features than the 15 min extractions from the in vivo animal model.On the other hand, a slightly larger number of features/compounds were detected in the in vivo study as compared to the in vitro 3D model.These additional features/compounds may be owed to the presence of additional compounds associated with the increased blood flow typical of neoangiogenesis within the tumor tissue. Another possible explanation for this would be the contamination of fibers with blood during skin and tumor penetration. However, a recent study on the fundamental principles of SPME extraction demonstrated that SPME might enable faster mass transfer of certain compounds in tissue than in liquid samples. For the tested compounds,an equilibrium state was reached after 20 min of extraction from tissue as compared to a 60 min extraction in PBS solution.This phenomenon was explained by the presence of binding components in the tissue, e.g., proteins, which act as a reservoir for extracted molecules. SPME extracts via free concentration; therefore,the extracted molecules are replenished by the ones released from binding components as the system aims to reestablish equilibrium [21]. Accordingly, in a comparison between in vivo and in vitro assays, a larger number of features/compounds was found for the in vitro 2D model while the in vitro 3D and in vivo models yielded a similar number of compounds.
The highest standard deviations (SD) were observed in the in vivo part of the study,which can be explained by inter-individual variability(Fig.4,T0).The further increases in SDs observed at the tumor growth stage (Fig. 4,T1) might be owed to the fact that the sampled tumor tissues were relatively small (around 4-5 mm) at this stage.It is also possible that the fibers were not inserted in the same tumor regions, namely, in the necrotic core or the highly proliferating outer layer.At the T2 sampling time,the tumor tissue had grown big enough so as to enable insertion of both fibers at the same tissue height, which contributed to a decrease in the intraanimal SD (Fig. 4, T2). Feature count differences between individual animals were 858,1063,and 261 for T0,T1,and T2,respectively.Since this work was a proof-of-concept study, only a minimum number of animals(2 animals;two fibers each per time point)were used to attain a sufficient number of samples for statistical comparisons with in vitro 2D and in vitro 3D models. In a study employing a traditional sample preparation method, a total of six animals would have been necessary for each time point since the tissue sample would have had to be homogenized for further sample preparation,necessitating that the animals be sacrificed at each sampling point. Undoubtedly, from this perspective, SPME is far superior to traditional approaches as far as compliance with the 3Rs rule is concerned.
A database search revealed a total of 256 previously reported compounds related to the B16F10 cell line[22-35].In four of these studies, LC-MS was used for instrumental analysis [22-25] while NMR was employed in nine cases [26-35]. In vivo metabolomics was considered in eight cases [22,29-35]. Among them, only one study was performed with the use of MS as an analytical platform and B16 as a cancer model, with serum chosen as a matrix [22].Metabolomic analyses were carried out directly from the tumor tissue in four of the cited in vivo studies,while the other protocols sampled different tissues (e.g., spleen, liver, stomach) and/or biofluids (serum). Of note, none of the above-mentioned studies combined in vitro and in vivo samplings,utilized a in vitro 3D cell culture approach,or carried out time-course profiling.Such a gap in the literature suggests the need for a reliable untargeted metabolomic strategy serving IVIVE. In the current investigation, 42 biologically relevant compounds were putatively determined(Table 1).Among them,21 metabolites were found in the literature as described above (Table S1) [22-35]. The different numbers of detected and identified compounds as compared to the literature might be due to the different sample preparation techniques and/or different instrumental platforms used in the particular experiments, and/or different matrices employed.

Table 1 Distribution of putatively identified compounds among different mouse melanoma models.
The putatively identified compounds histidine, glutamic acid,leucine/isoleucine, and dipeptide Phe-Ans/Ans-Phe were the only compounds detected in all sample types (Fig. 5). As leucine andisoleucine have identical accurate masses, identification can be done based on retention time.As no authentic standards were used in this study to identify compounds, the amino acids were not assigned to the particular peaks in the chromatogram [36]. The mass tentatively identified as Phe-Ans or Ans-Phe based on the database search also corresponded to two chromatographic peaks.This is in good agreement with the literature[37].Within all tested models a positive relationship between leucine/isoleucine and cells number was observed, i.e., the larger cell number the higher peak area. Levels were stable throughout the tested time points for histidine and glutamic acid in the in vitro 2D cell culture,while an increasing trend over time was observed in in vitro 3D and in vivo models.Conversely,levels of Phe-Ans/Ans-Phe decreased over time in both in vitro assays as well as in vivo assays.

Fig.5.Normalized areas of compounds detected in in vitro 2D model, in vitro 3D model, and in vivo mouse melanoma model (A: histidine; B: glutamic acid; C and D: leucine/isoleucine; E and F: Phe-Asn/Asn-Phe). Bars represent standard error. Note: for leucine/isoleucine and dipeptide Phe-Asn/Asn-Phe, two chromatographic peaks were detected.
Purine derivatives are frequently found as biochemical biomarkers of various melanoma cell lines, including B16F10[23,25,30,31,33]. In our experiments we were able to characterize levels of hypoxanthine (Fig. 6A), arabinosylhypoxanthine (Fig. 6B)and xanthine (Fig. 6C). In all cases, an increase in levels of the aforementioned metabolites over time was observed. Other identified compounds included amino acids,vitamins(both groups were cell culture medium components), small peptides, and derivatives of the above listed medium components(Table S1,Fig.S1)[22-35].

Fig.6.Normalized areas of purine derivatives(A:hypoxanthine;B:arabinosylhypoxanthine;C:xanthine)detected within in vitro 2D model,in vitro 3D model,and in vivo mouse melanoma model. Bars represent standard error.
A total of 10 common compounds were detected in both in vitro 2D cell culture and in vivo models. However, no common compounds were found between the in vitro 3D and in vivo models(Table 1). In general, this finding runs counter to the wellestablished fact that spheroid cultures are more similar to in vivo states than monolayer cell cultures. This discrepancy might be explained by the fact that the SPME probe was inserted inside the tumor tissue during the in vivo procedure, whereas in the in vitro 3D model,fibers were positioned so as to extract metabolites from/via the medium.It is possible that many inter-spheroid metabolites either were not released from the spheroid altogether, or were present at concentrations that were too low to be detected.In order to achieve in-depth metabolomics characterization of the in vitro 3D model and provide a thorough comparison between in vivo tumors and the above-mentioned in vitro 3D model, intraspheroidal sampling must be employed in both cases. For such studies, miniaturization of the SPME probe should be utilized in a manner similar to that of previous experiments conducted on single cells[38].In that study,SPME probes consisting of a coating length of 150 μm with conical geometry (diameter varied in the range 10-30 μm) were used to characterize intracellular metabolites of Alium cepa cells. After 48 h, with inoculum of 1000 cells, a B16F10 hanging-drop in vitro 3D model generates spheroids of approx. 400 μm [39]. The mentioned examples certainly support that it may be possible to extract metabolites from the interior part of B16F10 in vitro 3D cell spheroids with the use of miniaturized SPME, consequently enabling an in vitro application that better reflects in vivo conditions.
4. Conclusion
A reliable analytical tool for IVIVE would enable further investigations of biological systems while significantly reducing the number of animals used during the drug development process.Given that SPME low-invasive sampling,the same animals could be used multiple times over the course of an investigation, thus significantly reducing the number of animals needed for such studies while additionally minimizing inter-sample variability. For instance,in this project,only two animals were needed to establish three time point samplings; conversely, traditional methods such as the standard SLE approach would require six animals for an analogous experiment. Similarly, multiple samplings of cell cultures can be carried from the same culturing plate(well)via SPME,resulting in cost saving while additionally eliminating inter-seeding errors typical of routine detection methods such as cytotoxicity assessments or immunohistochemical staining,since such methods require several seedings for time-course studies. In the currently presented study,attempts to utilize SPME for time-course analyses of in vitro 2D,in vitro 3D,and animal models of B16F10 cells were demonstrated. The results showed that SPME is an easy-to-use,simple, and effective tool for extraction of relevant compounds from various types of biological matrices. However, the several drawbacks already discussed in this work should be addressed in future experiments. One of the major issues encountered in this proof-of-concept work concerns the discrepancies in metabolite coverage between the in vitro 2D and in vitro 3D models and the in vivo animal model. As previously discussed, the encountered discrepancies are likely to be due to the extraction strategies utilized in this work and not biological factors. The proposed modifications of the sampling procedures should address these discrepancies.
Declaration of competing interest
The authors declare that there are no conflicts of interest.
Acknowledgments
This work has been funded by the statutory grant from Nicolaus Copernicus University (Grant No.: 451). We would like to extend our gratitude to Thermo Fisher Scientific (Bremen, Germany) for providing the Q-Exactive Focus.
Appendix A. Supplementary data
Supplementary data to this article can be found online at https://doi.org/10.1016/j.jpha.2021.03.005.
 Journal of Pharmaceutical Analysis2021年5期
- Journal of Pharmaceutical Analysis的其它文章
- Acid-base and lipophilic properties of peptide nucleic acid derivatives
- Predicting the grades of Astragali radix using mass spectrometrybased metabolomics and machine learning
- Capsid destabilization and epitope alterations of human papillomavirus 18 in the presence of thimerosal
- Transformation of berberine to its demethylated metabolites by the CYP51 enzyme in the gut microbiota
- Electrochemical detection of methyl-paraoxon based on bifunctional cerium oxide nanozyme with catalytic activity and signal amplification effect
- Simulation of the oxidative metabolization pattern of netupitant, an NK1 receptor antagonist, by electrochemistry coupled to mass spectrometry