
The slip activity during the transition from elastic to plastic tensile deformation of the Mg-Al-Mn sheet
2021-10-28 10:09:48DobroDrozdenkoFeketeKnpekBohlenChmel
Journal of Magnesium and Alloys 2021年3期
P.Dobroˇn,D.Drozdenko,K.Fekete,M.Knpek,J.Bohlen,F.Chmelík
a Charles University,Faculty of Mathematics and Physics,Department of Physics of Materials,Ke Karlovu 5,12116,Prague 2,Czech Republic
b The Czech Academy of Sciences,Nuclear Physics Institute,Hlavní130,250 68,ˇRež,Czech Republic
c Helmholtz-Zentrum Geesthacht,MagIC-Magnesium Innovation Centre,Max-Planck-Straße 1,D21502 Geesthacht,Germany
Abstract The deformation behavior of the Mg-Al-Mn sheet was investigated during tensile loading along the rolling(RD)and transversal direction(TD)with special attention to the early stage of deformation.The activity of dislocation slip systems during the transition from elastic to plastic deformation was revealed by the acoustic emission(AE)technique.The parametrization and statistical AE analysis using the adaptive sequential k-mean(ASK)clustering provided necessary information about the individual deformation mechanisms and their evolution.The AE findings were supported by microstructural analyses,including in-situ secondary electron(SE)imaging and Schmid factor estimation for the activity of particular dislocation slip systems with respect to the loading direction.It was found that basalslip is the dominating mechanism up to the stress of~80 MPa in both loading directions with an absolute dominance during the RD-loading,while during the TD-loading,the contribution of prismaticslip to the deformation at stresses above 50 MPa was determined.Below the yielding in both loading directions,the predominance of prismaticover pyramidal
Keywords:Magnesium sheet;Yield asymmetry;Acoustic emission;Clustering.
1.Introduction
In general,Mg sheets exhibit anisotropic mechanical properties and low formability,which limit their use in technical applications.These negative effects can be effectively reduced by using appropriate alloying elements affecting the grain size and the initial texture.The strengthening effect of Al and the grain refinement effect of Mn in Mg alloys have been reported,e.g.,in[1–6].Therefore,Mg-Al-Mn sheets with good strength and formability even at room temperature(RT)are promising candidates for their application,for example,in the automotive industry.
The macroscopic deformation behavior of Mg sheets has been extensively studied and several works have focused on revealing the activity of individual deformation mechanisms.Particularly,the activity ofand
In-situobservations of dislocation activity using scanning and transmission electron microscopy(SEM,TEM)are becoming more popular nowadays[14–17],despite providing information from a limited volume of samples.On the other hand,diffraction methods operate within higher penetration depths.Both the electron microscopy and diffraction methods,however,require a certain time for data collection and,therefore,can be rather classified as semiin-situmethods.In contrast,the acoustic emission(AE)monitoring during deformation provides information on local dynamic changes from the entire volume of the material in real-time.The development of the AE technique in the last decade enables the storage and processing of data with a very high time resolution.Moreover,the application of modern statistical analyses to the AE data,particularly clustering techniques,significantly contributes to the identification and understanding of the processes that occur during deformation of the material[18].The combination of the AE technique with other methods provides complementary information about deformation mechanisms.For example,the AE technique is sensitive to collective dislocation movement and twin nucleation[19,20],and the neutron diffraction(ND)method refers to dislocation density and changes in twin volume fraction(twin growth).Using those techniques,it was shown that during tension of cast(texturefree)pure Mg[21],the extension twins were nucleated during the entire test(thin twins),while during compression,twins were formed preferentially around the yield point(YP)and then only their massive growth/thickening was observed.Thus,to fulfill the von-Mises criterion for the compatibility of plastic deformation[22],a significant twinning activity occurs during both tensile and compressive loading of cast Mg.In wrought Mg alloys,the basal texture strongly affects the activity of individual deformation mechanisms with respect to the loading direction(and deformation temperature),which is also reflected in the AE response[12,23–26].Particularly,during the compressive loading of wrought Mg alloys along the extrusion/rolling direction,the extension twins are preferably activated around the YP,providing the necessary compatibility of plastic deformation along the c-axis,as described above for cast Mg alloys.On the contrary,during the tensile loading of wrought Mg alloys,dislocation glide is the dominating deformation mechanism and the contribution of basal and non-basal slip systems to the deformation is still intensively discussed.Previous AE results obtained during the dislocation slip-dominated deformation in wrought Mg alloys,e.g.,[23–25,27],indicate that the AE technique can be advantageously used to study the collective dislocation movement,particularly at the early stage of deformation.
According to generally accepted dislocation-based AE models,a release of the AE energy during deformation originates from(i)relaxation of the elastic stress field in the lattice caused by the passage of dislocations[28],(ii)annihilation of dislocations[29],and/or(iii)the radiation of wave energy from accelerating or decelerating dislocations[30–32].Based on many dislocation models,it has been assumed by Vinogradov et al.[33]that the AE energy is proportional to the density of mobile dislocationsρmand the squared mean velocity of dislocations〈v〉2.

To track the changes in the dynamics of mobile dislocations in the material(also concerning variations in the mean free path),the AE count rate can be effectively used.This AE parameter is defined as a number of times the AE signal exceeds a pre-set threshold per time unit[34].It follows from the above statements that the AE energy and AE count rate provide different information about dynamic processes in the material.The AE energy depends on the mobile dislocation density and the AE count rate is proportional to the rate of change in the density of mobile dislocations.The mobility of dislocations is very closely related to the mean free path〈L〉of dislocations and depends on the dislocation densityρ.

The adaptive sequential k-mean(ASK)clustering analysis,developed by Pomponi and Vinogradov[35],operates with the power spectral density(PSD)function G(f)which is calculated by the Welch’s method.The basic AE parameters,such as the AE energyEand the median frequencyfmof the PSD function,are defined in the working frequency rangefminandfmaxas follows:

This statistical method has been successfully applied to AE data received during the deformation of cast or wrought Mg alloys.Clusters created by this algorithm exhibit specific features and,taking into account the microscopic and diffraction observations,can be assigned to individual deformation mechanisms[36–38].
The aim of the present study is to obtain comprehensive information on the deformation behavior of the Mg-Al-Mn sheet in an earlier stage of deformation;particularly,on the transition between elastic to plastic deformation with respect to the loading direction.The activity of individual slip systems at the early deformation stage crucially influences the yielding behavior of the Mg sheet and the AE monitoring with the statistical analysis of the AE data enables us to track this activity in real-time at a very high time resolution.
2.Experimental procedure
The AM61(Mg+5.9 wt.% Zn+0.6 wt.% Mn)alloy was gravity cast at 730 °C into a rectangular steel crucible from which a slab with a thickness of 20 mm was machined.Before rolling,homogenization annealing at 430 °C for 20 h was carried out on the slab.After rolling at 430 °C(14 passes with intermediate re-heating for 10 min between passes),a final sheet with a thickness of 1.8 mm was heat-treated at 430 °C for 1 h.More information on the sheet production is given in[2].
Dog bone-shaped tensile samples with gauge sizes of 10 mm×1.9 mm×30 mm were machined from the sheet with the loading direction along(i)the rolling direction(RD)and(ii)the transversal direction(TD).Deformation tests were performed using the Instron 5882(Norwood,MA,USA)and the Zwick Z50(ZwickRoell,Ulm-Einsingen,Germany)universal testing machine at RT and a constant crosshead speed giving an initial strain rate of 10−3s−1.The possible influence of the equipment setting and environment(background noise)on the AE response was also elaborated by measuring AE during tensile tests performed on two testing machines located in different laboratories,showing practically no differences in the AE results.
AE was monitored during the tensile tests using the Physical Acoustics Corporation(PAC)AE system(MISTRAS Group,Princeton Jct,NJ,USA)consisting of a PC-integrated PCI-2 AE measurement board,a voltage preamplifier(type 2/4/6),and a broadband AE sensor(MICRO-30S).The AE sensor was attached directly to the sample with a wooden clip and a good acoustic contact between the sample and the sensor was achieved using the vacuum grease Apiezon M(Cryoandmore,Neuss,Germany).The preamplifier was set to 40 dB to ensure a high signal-to-noise ratio,and the AE data were recorded and stored with a sampling frequency of 1 MHz.Threshold-level signal detection(26 dB)was used to determine the AE count rate.
The ASK analysis was performed on the continuously recorded AE data during the tensile tests.The AE data from the RD-and TD-loading were merged into a single file(RDTD or TD-RD)to ensure the same cluster identification for both loading directions.The ASK algorithm was applied to both merged files to eliminate any influence of the arrangement on the AE results.By comparing the ASK results obtained from both merged files,no differences were observed in the identified clusters.
The AE data were firstly divided into successive frames containing 8192 samples representing a time interval of 8.192 ms,and subsequently,the PSD function was calculated for each frame.Thereafter,the PSD function was normalized by dividing this function by the AE energy in the working frequency range(Eq.3).The features of the PSD function in the first frame define the initial cluster.As a reference point for the analysis,the initial cluster was associated with background noise as the AE data acquisition began before the start of particular tensile tests.The successive frames were analyzed one by one and conditions for the formation of a new cluster were based on the k-means algorithm.More details on the algorithm can be found in[35].After the clustering procedure,each cluster is assigned to a dominant AE source mechanism.As mentioned above,the first cluster represents the background noise.In general,the assignment of other clusters to individual deformation mechanisms operating in Mg alloys is based on the characteristic features of the PSD function(energy,frequency distribution,etc.)for each deformation mechanism,and is supported by other experimental techniques(texture measurement,microscopy,etc.)or theoretical modeling.
The global characterization of the texture of the Mg sheet was performed using X-ray diffraction(XRD).The Malvern Panalytical X-ray diffractometer X’Pert(Malvern,United Kingdom)setup using CuKαradiation was employed to measure six pole figures on the polished sample in a reflection geometry to a sample tilt of 70°.

Fig.1.Initial microstructure and texture of the conventionally rolled and heat-treated AM61 sheet.
For the microstructure investigations,conventional metallographic procedures including grinding with SiC paper and polishing with diamond pastes down to 1μm particle size were used.Finally,the surface was polished by means of the LectroPol-5 electrolytic polisher(Struers Inc.,Cleveland,OH,USA)with Struers-AC2 electrolyte at-40 °C.The electron backscatter diffraction(EBSD)measurement of the sample in the initial condition was performed in the RD-TD plane using the Zeiss Auriga Compact SEM(Jena,Germany)equipped with the FIB system and EDAX EDX/EBSD detector.The EBSD measurements were carried out at a working distance of 9 mm with 10 kV acceleration voltage.To reveal the activity of the deformation mechanisms,in-situsecondary electron(SE)imaging of the microstructure was performed at defined stresses during tensile loading along RD and TD using the MTEST Quattro(Materials Testing system ADMET)deformation stage installed inside a chamber of the Zeiss Auriga Compact SEM.The stress level selection(75,125,and 175 MPa)was based on the previously recorded AE response.
3.Experimental results
Fig.1 shows the microstructure(SEM)and texture(XRD)of the AM61 sheet after conventional rolling and heat treatment at 430 °C for 1 h.The investigated sheet exhibits a relatively homogeneous microstructure with an average grain size of 13±2μm and a strong basal texture with a slightly broader spread of basal planes towards RD than TD.The precipitates are distributed in the matrix and,occasionally,some particle strings were found in the microstructure.

Table 1Tensile mechanical properties of the rolled AM61 sheet.TYS–tensile yield strength,UTS–ultimate tensile strength.
The EBSD maps and Schmid factor(SF)analysis for theand
Tensile deformation curves and the corresponding AE activity,represented by the AE count rate,AE energy,and median frequency of the AE signal,are presented in Fig.3.The deformation curves have a similar shape for both RD and TD-loading directions,with a higher yield strength for the TD-loading.A similar elongation of about 25%(with the initial strain rate of 10−3s−1it corresponds to 250 s)was achieved in both loading directions(Table 1).Monitoring of the AE activity during the deformation test revealed that a higher AE count rate and AE energy appear in the sample subjected to the RD-loading.Both AE parameters exhibit a typical evolution with their maximum at yielding,which is followed by a relatively distinct decrease.However,a change in the AE count rate is observed already before yielding and this effect is especially pronounced in the TD-loading.The median frequency of the AE signal is starting with its decrease at the beginning of the deformation,followed by an increase,which is strongly pronounced for the TD-loading,and further progressing with a gradual increase at later stages of deformation.In the case of the RD-loading,an additional drop around the time of 200 s can be seen on the median frequency–time curve,Fig.3a.To increase the visibility of the AE parameters at the beginning of the test(i.e.,the transition between elastic and plastic region),they were plotted against the tensile stress(Fig.4).The AE count rate increases rapidly from the beginning of the deformation test and then,in the stress range between 20 and 75 MPa,it increases either slightly(RD-loading,Fig.4a)or remains almost constant(TD-loading,Fig.4b).Thereafter,in the case of the RD-loading,a massive increase in the AE count rate can be observed immediately,while during the TD-loading,the AE count rate first increases slightly up to the tensile stress of~115 MPa and then increases rapidly up to the YP.After reaching its maxima at the YP,the AE count rate gradually decreases.During tensile loading up to the stress of~115 MPa,both loading directions exhibit similarities in the median frequency development.The median frequency is almost constant up to the stress level of~75 MPa and then drops sharply with a more pronounced effect in the case of the TD-loading.The following rise in the median frequency development is,therefore,only small for the RD-loading and more pronounced in the case of the TD-loading,Fig.4b.
To reveal a dislocation glide and possible twinning activity during the transition from elastic to plastic tensile deformation,deformation tests performed inside the SEM chamber were interrupted at 75,125 and 175 MPa(black circles on the deformation curves,Fig.4),and the corresponding microstructures were investigated together with the initial state using SE imaging(Figs.5 and 6).The stress levels were chosen with respect to changes in the AE response in order to correlate these changes to the development of the microstructure.For the RD-loading,the first basal slip traces are observed in the microstructure subjected to the stress level of 125 MPa(Fig.5).In the case of the TD-loading,the first evidence of plastic deformation was found on the surface of the sample deformed up to 175 MPa(Fig.6).Moreover,the twinning activity was not observed in any of the loading directions in the stress range between 0 and 175 MPa.
The ASK analysis was used to distinguish the changes in the activity of individual deformation mechanisms and to contribute to the understanding of the atypical AE response in the elastoplastic deformation region.For easier comparison of the cluster activity revealed by the ASK analysis and the above presented AE results(Figs.3–4),the dependence of the AE energy on the median frequency is presented for individual clusters in Fig.7.The background noise was measured before the tensile test and its energy is significantly lower than the energy released during the test.By comparing the results for the RD-and TD-loading,it is clearly seen that the released AE energy is an order of magnitude higher for the RD-loading and features a much narrower median frequency distribution in this loading direction.

Fig.2.Initial microstructure of the investigated alloy:orientation map and SF analysis for the activity of basal and non-basaland

Fig.3.Tensile stress-time curves and AE parameters for(a)RD-and(b)TD-loading.

Fig.4.Tensile stress-time curves and AE parameters plotted in the time interval of 0-120 s for(a)RD-and(b)TD-loading.The stress level of 75,125 and 175 MPa used for the SEM analysis is marked by circles on the deformation curves.Note that for the sake of clarity the scale of the AE energy in Fig.3b is 10×higher than that in Fig.4b.
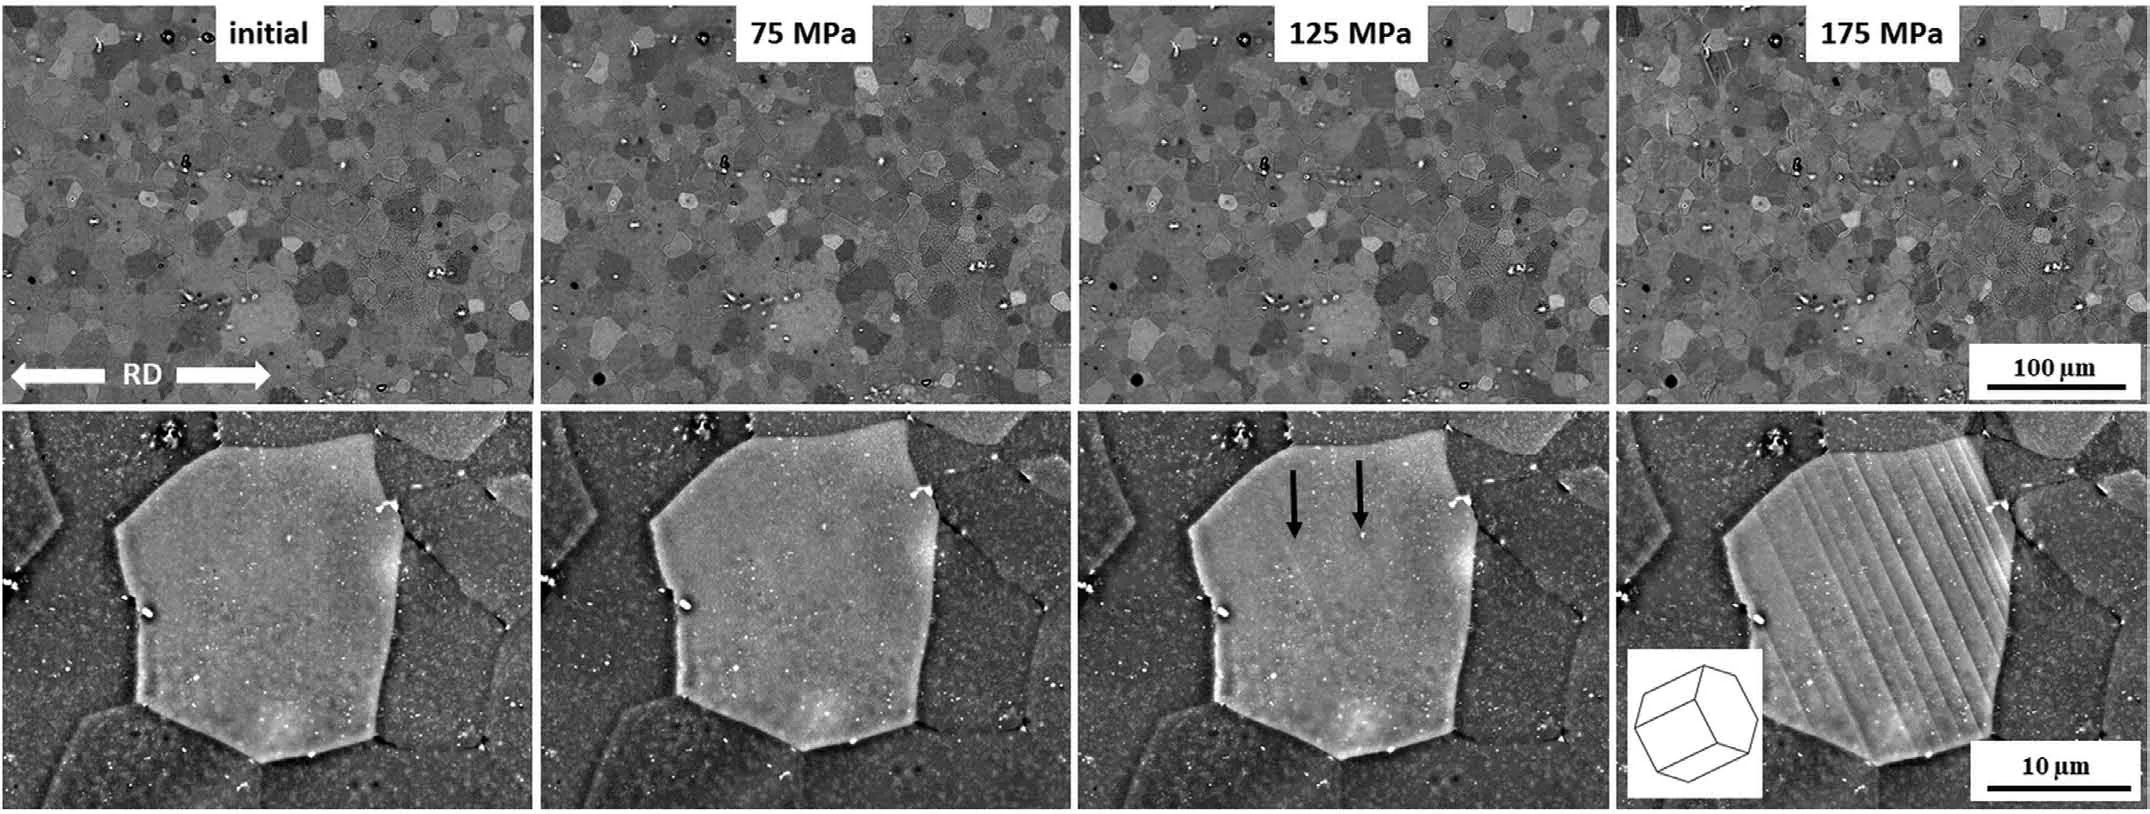
Fig.5.In-situ SE imaging of the microstructure during tensile loading along RD.Black arrows indicate the first visible traces of basalslip at image taken at stress of 125 MPa.

Fig.6.In-situ SE imaging of the microstructure during tensile loading along TD.Black arrows indicate the first visible slip traces at image taken at stress of 175 MPa.

Fig.7.Dependence of energy on median frequency corresponding to individual AE clusters for(a)RD-and(b)TD-loading.
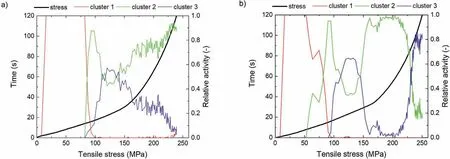
Fig.8.Dependence of a relative AE cluster activity on tensile stress for(a)RD-and(b)TD-loading.
The relative activity of individual clusters(background noise is not included)as a function of the applied tensile stress is shown in Fig.8.Almost immediately after the beginning of the tensile test,cluster 1(red color code)becomes dominant in both loading directions.The subsequent transition from cluster 1 to other clusters is realized at different stresses for the RD-and TD-loading and this transition differs in its course.In the RD-loading,the transition from cluster 1 is realized abruptly due to a concurrent activation of the other two clusters(clusters 2 and 3-green and blue color code,respectively,in Fig.8a)at a tensile stress of~80 MPa,while during the TD-loading,the increment of the cluster 2 is a gradual process(Fig.8b)which starts to occur at a stress of~50 MPa.
In the case of the RD-loading,cluster 2 shows higher activity compared to cluster 3 in the stress range of 80–110 MPa,then loses its dominance between stresses of 110 and 140 MPa and finally becomes dominant again up to stresses beyond the YP.
A different scenario was observed in the TD-loading,where cluster 1 loses its dominance gradually at the expense of a higher activity of cluster 2.Cluster 2 reaches its maximum activity around the tensile stress of 90 MPa,at which cluster 3 begins to be active.Then,both cluster 2 and cluster 3 show the competitive behavior with increasing tensile stress beyond the YP with higher activity of cluster 3 in the stress range of 110–145 MPa and at stresses above 230 MPa.The absolute dominance of cluster 2 at the expense of cluster 3 was observed in the stress range of 160-210 MPa.
4.Discussion
The homogeneous microstructure with a strong initial basal texture having a slightly wider spread of basal planes towards RD than TD(see Fig.1),is commonly observed in rolled Mg alloys[39–42].The homogenization temperature of 430°C was used to dissolve the intermetallic Mg17Al12phase and,therefore,the precipitates in the microstructure are assumed to be Al-Mn particles[2].With respect to the texture(Fig.1)andin-situSE imaging(Figs.5-6),dislocation glide has to be a preferential deformation mechanism during the tensile loading of the AM61 sheet.Twinning,as a competitive deformation mechanism in Mg alloys,can play an important role during the tensile loading of Mg sheets if the basal poles are extensively tilted from the normal plane of the sheet,as observed,for example in the ZE10 sheet[27].During loading in both directions up to 175 MPa(Figs.5-6),no evidence of twinning activity was found and,therefore,the SF analysis was performed only for theand
A slight variation in the texture(distribution of the(0001)intensity along RD and TD,Fig.1)with a more favorable orientation of grains for the basal glide along the RD-loading(higher fraction of grains with SF in the range of 0.4–0.5,see Fig.2)results in a planar anisotropy of mechanical properties with higher tensile yield strength for the TD-loading(Table 1).
The AE activity,observed almost immediately at the beginning of the test in both loading directions,indicates a long mean free path〈L〉due to a relatively low dislocation density in the initial microstructure caused by the solution heat treatment applied after rolling.
According to Eq.1,the AE energy is proportional to the number of mobile dislocationsρmand a higher cumulative release of energy during tension along RD than TD is,therefore,caused by a more favorable orientation of the grains for easier basal glide in this loading direction(Fig.2).A local increase in the released AE energy in the stress range of 50–75 MPa for the RD-loading can be attributed to a higher collective dislocation movement compared to the TD-loading and can be explained(in terms of the SF analysis)by a higher number of well-oriented grains for basalslip in case of the RDloading.With the progress of the tensile stress,an increasing number of grains involved in the deformation contribute to the total AE energy in both loading directions.The following massive multiplication of dislocations leads to the maximal release of AE energy at the macroscopic YP.Beyond this point,increasing dislocation densityρtogether with increasing number of immobile dislocations results in the decreasing mean free path〈L〉of dislocations and,therefore,reduces the amount of released AE energy.
On the other hand,the AE count rate is sensitive to changes in the dynamics of mobile dislocations.First,collectively moving dislocations produce detectable AE and a higher AE count rate in the RD-loading can be explained by a higher number of well-oriented grains for basal slip,which is typically the first active slip system in Mg alloys.The practically constant AE count rate(Fig.4)in the stress range of 25–75 MPa correlates with the fact that in crystalline materials showing no alternation of deformation mechanisms due to a change in the strain rate,a proportionality between the AE count rateand strain ratecan be described according to Fisher and Lally[43]as:

Considering a constant strain rate during the entire tensile loading,the basalglide is the dominant deformation mechanism in the above-mentioned stress range.A similar,but not so pronounced,flat AE response for the Mg alloys before the YP was also reported for the AZ31 sheet[23].
The following increase in the AE count rate at 75 MPa indicates an activation of further deformation mode,which is supposed to be the prismaticslip considering the CRSS required for its activation and the orientation of the grains with respect to the loading direction(SF analysis in Fig.2).The values of CRSS for the prismatic and pyramidal slip systems in Mg alloys are estimated to be around 70 MPa and 110 MPa,respectively[44,45].Increasing applied stresses give rise to the activation of pyramidaland
The activity of individual slip systems is also reflected in the median frequencyfmevolution.The constantfmin the stress range of 25–75 MPa(Fig 4.)can be explained by using the phenomenological relation forfm,presented for example in[33,46],

and assuming that(i)the low density of mobile dislocationsρmat the beginning of the tensile loading of the heat-treated(i.e.stress-free)sheet should not significantly affect the mean free path〈L〉of moving dislocations and(ii)the mean velocity of dislocations〈v〉can be changed only slightly due to a constant strain rate.The subsequent decrease in the median frequencyfmat tensile stresses between 75 and 115 MPa can be attributed to a massive increase inρm,which subsequently reduces〈v〉.It was shown in[33]that during tensile loading of pure metals with a face-centred cubic(fcc)lattice(Al,Cu,Ni,Ag),fmdecreases from the beginning of the tests with increasing loading up to yielding and after this point it constantly increases,showing only a different slope for each investigated metal.In those pure fcc metals,deformation is realized via several equivalent slip systems(having the same Burgers vector and CRSS)and the minimum in the median frequencyfmoccurs at the YP.However,in hcp metals,the slip systems are not equivalent and require different conditions for their activation.Thus,the increase infmbefore the YP in the investigated Mg sheet can be associated with a rather significant transition between slip systems.A more pronounced drop in the case of the TD-loading is in good agreement with the SF analysis presented in Fig.2 indicating higher SF values for the activation of prismaticslip during the TD-loading compared to those observed during the RD-loading.Moreover,the activity of pyramidal
The above-described activity of slip systems is strongly supported by results of the ASK analysis.All three clusters exhibit a similar shape(Fig.7)in the investigated time interval of 0–120 s and,consideringin-situSE imaging(Figs.5 and 6),the SF analysis(Fig.2)and previous studies on Mg alloys[36-38],they can be related to the dislocation slip activity.Therefore,the dominant mechanism during tensile loading along both RD and TD is dislocation glide.Cluster 1 dominates at lower tensile stresses in both loading directions and,considering the CRSS required for the activation of individual slip systems in Mg alloys,can be assigned to basalslip(Fig.8).The assignment of cluster 2 to prismatic and cluster 3 to the pyramidal slip system is based on the same idea taking into account the CRSS values for both slip systems[44,45].The dominance of theslip system up to the stress of~80 MPa during the RD-loading(Fig.8a)can be explained by a lower contribution of other slip systems to the deformation(SF analysis,Fig.2)and the principle of the ASK algorithm(revealing only the most dominant process in a given time interval).The subsequent activation of the prismatic and pyramidal slip systems represents a competitive process with a higher contribution of the prismatic slip up to a tensile stress of 110 MPa.The less favorable orientation of grains for the basal slip in the TD-loading(Figs.1 and 2)leads to the activation of prismaticslip(cluster 2,Fig.8b)at tensile stresses above 50 MPa and this slip system gradually takes control of the deformation.Interestingly,for both loading directions,the maximal activity of prismatic slip(cluster 2)is observed at the stress of 90 MPa and dominance of the pyramidal
The uniqueness of the AE technique is manifested by its comparison with thein-situSE imaging,where the first slip traces on the surface of the sample,as the evidence of slip activity,were observed at stresses only above 125 MPa in the RD-loading.To date,the ASK analysis has been successfully used in the cases where deformation mechanisms show significant differences in their AE characteristics,such as slip vs.twinning or kinking[18,37,47,48].The presented results demonstrate that by applying the ASK algorithm on AE data it is also possible to reveal important real-time information about the activity of different dislocation slip systems from the entire sample volume leading,in turn,to the detailed determination of their contribution in the anisotropic tensile deformation behavior of the Mg-based sheets.
5.Conclusions
The dislocation activity in the rolled Mg-Al-Mn alloy sheet was investigated in tension along rolling(RD)and transversal directions(TD),complemented by the acoustic emission(AE)technique using the parametrization of the AE signal and its clustering analysis.The AE results were supported by the microstructure observation,particularly by the estimation of the Schmid factor(SF)for the activation of individual slip systems.The following conclusions can be drawn:
•Higher AE energy and count rate in the RD-loading than those observed in the TD-loading is caused by a higher number of favorably oriented grains for dislocation glide,i.e.,the higher number of AE sources.
•The constant AE count rate and the median frequency in the stress range of 25–75 MPa are related to a relatively low initial dislocation density in the heat-treated(i.e.stress-free)sheet for both loading directions.The subsequent increase in the AE count rate and decrease in the median frequency is explained in terms of an increasing number of moving dislocations influencing the mean velocity of dislocations.
•Increase in the median frequency before the macroscopic yield point(YP)indicates the transition between individual dislocation slip systems for both loading directions.Thein-situsecondary electron(SE)imaging excludes the twinning activity in the microstructure.
•The ASK(clustering)analysis supported byin-situSE imaging and the SF analysis reveals that basalslip dominates during tensile loading of the Mg sheet up to the stress of~80 MPa.It operates as a single deformation mode in the RD-loading,while in the TD-loading,at stresses above 50 MPa,it gradually loses its dominance at the expense of a higher activity of the prismaticslip system.
•For both loading directions,prismaticslip predominates in the stress range of 80–110 MPa,then it loses its dominance at the expense of pyramidal
Declaration of Competing Interest
The authors declare that they have no conflict of interest.
Acknowledgements
This work was financially supported by the Czech Science Foundation(grant No.19-22604S),and the Operational Program Research,Development and Education,The Ministry of Education,Youth,and Sports(OP RDE,MEYS)(grant No.CZ.02.1.01/0.0/0.0/16_013/0001794).
 Journal of Magnesium and Alloys2021年3期
- Journal of Magnesium and Alloys的其它文章
- Modifying microstructures and tensile properties of Mg-Sm based alloy via extrusion ratio
- The effects of Ca and Mn on the microstructure,texture and mechanical properties of Mg-4 Zn alloy
- H2 generation kinetics/thermodynamics and hydrolysis mechanism of high-performance La-doped Mg-Ni alloys in NaCl solution—A large-scale and quick strategy to get hydrogen
- Rotational and translational domains of beta precipitate in aged binary Mg−Ce alloys
- Does acid pickling of Mg-Ca alloy enhance biomineralization?
- In situ growth process of Mg–Fe layered double hydroxide conversion film on MgCa alloy