
Microstructure evolution,texture and mechanical properties of a Mg–Gd–Y–Zn–Zr alloy fabricated by cyclic expansion extrusion with an asymmetrical extrusion cavity:The influence of passes and processing route
2021-10-28 10:09:14ZhomingYnXuinLiJieZhengZhiminZhngQingWngKihuXuHongzhiFnGunshiZhngJixunZhuYongXue
Journal of Magnesium and Alloys 2021年3期
Zhoming Yn,Xuin Li,Jie Zheng,Zhimin Zhng,∗,Qing Wng,Kihu Xu,Hongzhi Fn,Gunshi Zhng,Jixun Zhu,Yong Xue,∗
aSchool of Materials Science and Engineering,North University of China,Taiyuan 030051,China
b College of Mechatronics Engineering,North University of China,Taiyuan 030051,China
Abstract In the present work,two processing routes(A and B)with 3 CEE-AEC passes are performed on Mg–13Gd–4Y–2Zn–0.4Zr alloys,and the resultant microstructure evolution,texture analysis and mechanical properties are investigated systematically.The core difference between the two processing routes is the orientation between the expansion and extrusion steps,i.e.,they are parallel to each other for on route A and perpendicular to each other for route B.The results show that a remarkable grain refinement is achieved via both processing routes due to dynamic recrystallization(DRX).Fine equiaxed grains are observed in the samples processed with route B with a final size of 3.6±0.4μm compared to the grain size of 4.5±0.5μm with route A.With an increasing number of CEE-AEC passes,the overall texture intensity decreases,and the basal texture gradually changes to the mixed texture components.The shear deformation introduced by the asymmetrical extrusion cavity promotes a broad angular distribution of the basal planes on routes A and B,leading to an obvious increase in the Schmid factor for the activation of the basal〈a〉slip system.The tensile test at ambient temperature reveals that the comprehensive mechanical properties are improved,and the conventional mechanical anisotropy of as-received alloys is alleviated by successive CEE-AEC processing,which is mainly derived from the competitive balance relation between the grain refinement and texture modification.© 2021 Chongqing University.Publishing services provided by Elsevier B.V.on behalf of KeAi Communications Co.Ltd.This is an open access article under the CC BY-NC-ND license(http://creativecommons.org/licenses/by-nc-nd/4.0/)Peer review under responsibility of Chongqing University
Keywords:CEE-AEC;Mg–Gd–Y–Zn–Zr;Microstructure;Texture;Mechanical properties.
1.Introduction
It is widely known that the employment of magnesium(Mg)alloys in aerospace,automotive and national defense industries is promising due to their low density and high specific stiffness/strength[1–4].Nevertheless,the poor formability and ductility of traditional Mg alloys at the ambient temperature restrict their widespread application due to their hexagonal close-packed(HCP)crystal structure that contains only a limited number of basal slip systems[5–7].In recent years,increasing attention has been paid to improving the comprehensive properties of Mg alloys,and the main focus is focused on strengthening the plastic forming ability of Mg alloys.
Mg alloys containing rare-earth(RE)elements demonstrate a remarkable improvement in their microstructure and mechanical properties,and have an ultimate working temperature that reaches 623K.In particular,Mg–Gd–Y–Zn–Zr alloys exhibit the excellent mechanical properties due to the strengthening from long-period stacking ordered(LPSO)phases and the precipitation of second phases.Compared with the cast Mg–Gd–Y–Zn–Zr alloys,which have many defects and demonstrate a lower strength,the wrought Mg–Gd–Y–Zn–Zr alloys have become a research hotspot because of their homogenized structure and improved performance.Furthermore,the kink mechanism of LPSO phases can coordinate the deformation behavior,and contribute to the high mechanical properties of Mg–Gd–Y–Zn–Zr alloys[8].Zhou et al.[9]studied the mechanical properties of extruded Mg–Gd–Y–Zn–Zr alloys and found that LPSO phases restricted the DRX and the fine grains,these factors as well as the lamellar LPSO phases,increased the tensile properties.Shao et al.[10]worked on the hot rolled Mg–Gd–Y–Zn–Zr alloys and reported that the ultimate tensile and yield strength and elongation were synchronously improved by the existence of LPSO phases.
Severe plastic deformation(SPD)methods are considered to be an effective way to fabricate ultrafine grained(UFG)metals,weaken the texture and achieve higher mechanical properties than those achieved with conventional thermomechanical processing technologies.In recent decades,SPD technologies such as equal channel angular pressing(ECAP)[11,12],high-pressure torsion(HPT)[13,14],and repetitive upsetting-extrusion(RUE)[15,16],have been successfully applied to various metals and have achieved significant grain refinement and weakening of the basal texture,corresponding to an enhancement in the comprehensive tensile performance.Among most SPD processes,performing consecutive passes is one of the important ways to increase the strain.Li et al.[17]reported that Mg–13Gd–4Y–2Zn–0.6Zr(wt%)alloys after 3 passes of ECAP exhibited the best comprehensive mechanical properties due to grain refinement and texture modification.Sun et al.[18]proposed that the nanosized grains of Mg–8.2Gd–3.8Y–1.0Zn–0.4Zr(wt%)alloys were obtained after HPT,and the lamellar-shaped and block-shaped LPSO phases experienced kink bending,fragmentation and dissolution with increasing HPT revolutions.Processing with different routes is another way to modify grain refinement and texture development.Howeyze et al.[19]found that the processing routes played an important role in the effect of the microstructure and mechanical properties of AA5052 aluminum alloys.
In the present work,we developed a novel SPD method referred to as cyclic expansion extrusion with an asymmetrical extrusion cavity(CEE-AEC)[20,21].The shear strain introduced by the asymmetrical extrusion cavity is the core advantage compared with the conventional CEE method[22].The dynamic recrystallization and strengthening mechanism of Mg–Gd–Y–Zn–Zr alloys fabricated by CEE-AEC are not clear.Thus,the purpose of the current study is to evaluate the influence of three consecutive passes of consecutive deformation and two different routes on the microstructure,texture and mechanical properties of a hard-to-deform Mg–Gd–Y–Zn–Zr alloy during the CEE-AEC process.

Table 1Chemical composition of the Mg–13Gd–4Y–2Zn–0.4Zr alloy(wt%).
2.Experimental procedures
2.1.Principles of the different CEE-AEC routes
Fig.1 shows the two CEE-AEC processing routes.The prominent characteristic is the modification of the direction in the extrusion plane,which corresponds to an adjustment of the shear strain acting on the extruded metals.As demonstrated in Fig.1,the extrusion plane of extruded billet 1(b1)had the same direction as the billet 2(b2)in the processing of route A(Fig.1a),while it had the normal direction as b2 in the processing of route B(Fig.1b).These kinds of processing routes were introduced in a previous study[23],and the asymmetrical cavity is our core advantage because it could increase the shear strain.
The two different CEE-AEC routes have the same five steps.Take route A as an example,billet b1 with a rectangular cross-section was placed at the bottom of die A first and completed the expansion process.Then,the block was removed,and billet b2 with the same size was located against billet b1.Upon pressing with the top die pressing,billet b1 was extruded out,and billet b2 filled the expansion container.Finally,extruded billet b1 was rotated 180° along its central axis in the extrusion direction(ED)and reloaded in the chamber(Fig.1e).The same processing was repeated to accumulate the strain.After replacing the bottom of die A with the bottom of die B,billets b3 and b4 were processed according to route B.
2.2.Materials and processing
The studied alloy with the nominal composition Mg–13Gd–4Y–2Zn–0.4Zr(wt%)was prepared from high purity Mg(99.95%),Zn(99.95%),Mg-25Gd(wt%),Mg-25Y(wt%)and Mg–30Zr(wt%)master alloys in an electrical resistance furnace.The molten metal was held at 1003K under a mixed gas of CO2and SF6with a volume ratio of 99:1.The chemical composition is shown in Table 1.The cylindrical samples used in the present work with a size of 50mm×100mm×250mm were wire cut from the center of the Mg–13Gd–4Y–2Zn–0.4Zr(wt%)alloy which underwent upset forging at 753K from an ingot with dimensions ofΦ330×1000mm to the forged blank with dimensions ofΦ480mm×500mm at a ram speed of 3mm/s[20].The schematic diagram of container shapes on routes A and B are given in Fig.2.The geometric die parameters were determined to be 50mm of the length of the extrusion channel,100mm of the length of the expansion chamber,and 32° of the expansion angle.Furthermore,an asymmetrical cavity with a height gradient of 10mm was fabricated to introduce the shear strain(Fig.2a).The same die parameters with a rotation of 90°in the lower bottom die resulted in the extrusion plane being normal to the initial plane(Fig.2b).Prior to CEE-AEC,the billets were preheated to 753K,733K,and 713K for 80 min to equalize the temperature by 1 pass(1p),2 passes(2p),and 3 passes(3p),respectively(Fig.3).The experiments were carried out on 6300kN press machine with a top die speed of 1mm/s,and the oil-based graphite was used to reduce the friction between the billets and dies.Finally,water quenching to 298K was performed upon the completion of each pass to retain the microstructure.
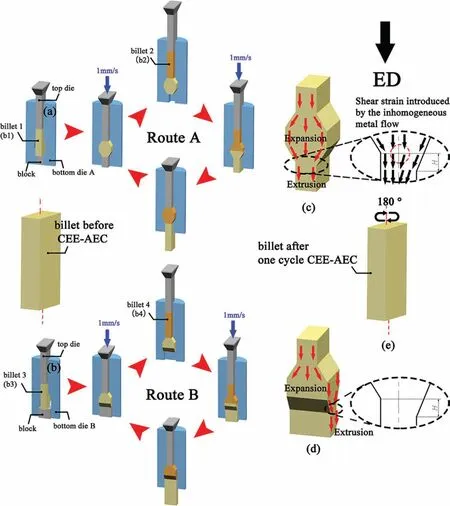
Fig.1.Schematic illustration of two different processing routes:(a)route A;(b)route B;(c)cubic sample for the route A;(d)cubic sample for the route B;and(e)reloading rule of the billet after one cycle of processing.
2.3.Experimental procedures
The microstructure of the as-received alloy was investigated before CEE-AEC,and that of the processed samples were analyzed after water quenching upon the completion of each processing step by using the optical microscopy(OM)(Zeiss A2m).The OM samples were chemically etched in a solution of 1g picric acid,2ml acetic acid,14ml alcohol and 2ml distilled water.The grain size was measured by the linear intercept method using Image-Pro-Plus software.Field emission gun scanning electron microscopy(SEM)(Hitachi SU5000)was used to observe the morphologies of the secondary phases,and energy dispersive spectroscopy(EDS)was applied to determine the composition of the phases.For the experiment of electron backscatter diffraction(EBSD),the specimens with the longitudinal sections along the ED were mechanically polished and ion etched by ion beam thinner(Leica Em Res102).The accelerating voltage and tilting angle for the observation were 20kV and 70°,respectively.All EBSD data were analyzed with TSL OIMTMsoftware.Transmission electron microscopy(TEM)was carried out using a JEOL JEM-F200 transmission electron Microscope operating at 200kV for detailed microstructural analyses.The mechanical properties were measured on an Instron uniaxial tensile machine with the dog-bone plate specimens with dimensions of 45mm×18mm×2mm.The tensile direction was parallel to the ED and TD of the CEE-AEC processed samples,and the strain rate was 1×10⁻³s−1.

Fig.2.The shapes and dimensions of the samples for the two different CEEAEC routes:(a)route A and(b)route B.
3.Results
3.1.Microstructure and texture of the as-received alloy
Fig.4 shows the microstructure and texture of the as-received alloy.The as-received alloy presents a typically bimodal grain structure,and the average grain size is estimated to be 23.5±0.5μm.From Fig.4a,it can be seen that the coarse grains contain large amounts of lamellar-shaped phases,while these phases are not observed in the fine grains.The SEM image shown in Fig.4b displays detailed images of the as-received alloys,which are composed of interdendritic block-shaped phases,white eutectic phases and cuboid-shaped phases.The EDS results that their compositions are Mg84.91Gd6.44Y1.93Zn6.57Zr0.15,Mg83.27Gd10.91Y3.80Zn1.56Zr0.46, and Mg11.22Gd26.86Y56.18Zn1.15Zr4.59,which are consistent with the results for Mg12Zn1RE1,Mg5RE,and RE-rich phases[24].An additional investigation is carried out by TEM,and the results are presented in Fig.4b and c.The intragranular lamellar-shaped phases and interdendritic block-shaped phases are defined as 14H-LPSO phases according to their TEM bright-field images and the corresponding selected area electron diffraction patterns[25,26].The white eutectic phases have face centered cubic(fcc)structure and are similar to equilibriumβphase(Mg5(Gd,Y,Zn))[27].The IPF images of the as-received alloy and corresponding{0001}and{10–10}pole figures are shown in Fig.4e and f.The coarse grains show a strong basal texture with an orientation of<11−20>//ED,while fine grains possess a relatively dispersed orientation.These microstructural features possess the typical characteristics of Mg alloys that underwent DRX[28].Thus,this suggests that the basal texture of the as-received alloy is mainly due to the coarse grains.Considering the dispersed orientations of the fine grains,this work focuses on the deformation behaviors of the coarse grains and LPSO phases.
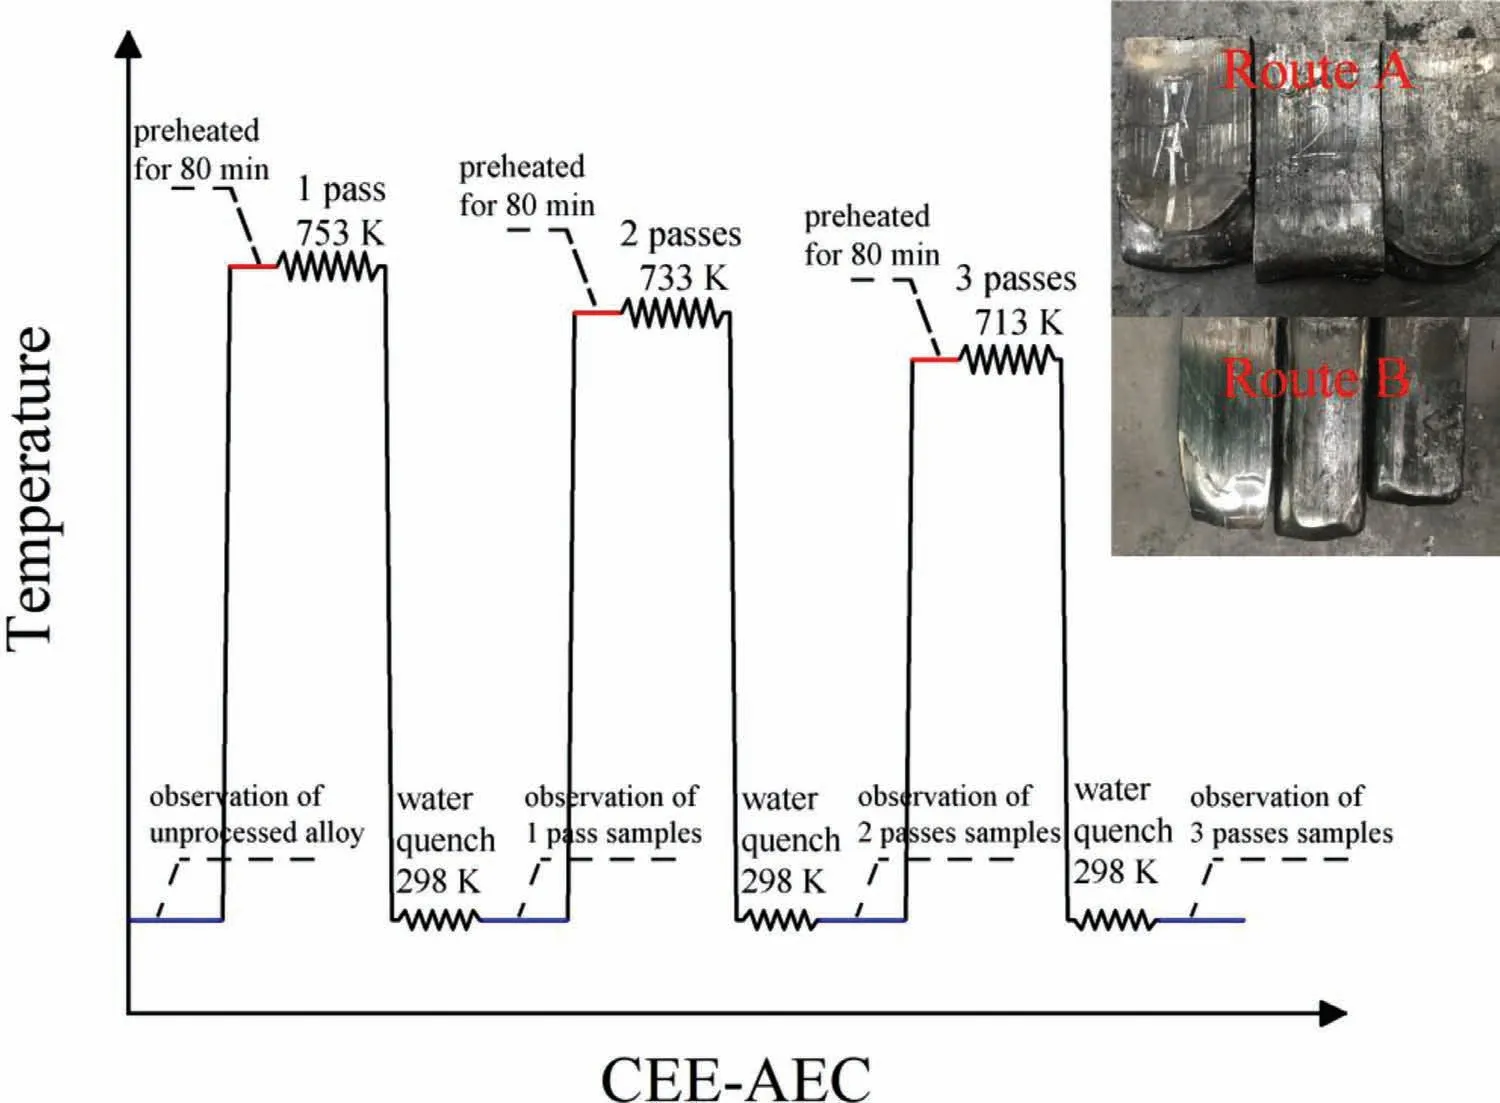
Fig.3.Illustration of the CEE-AEC processing sequence.

Fig.4.Microstructure and texture of the as-received alloy:(a)optical micrograph and(b)SEM micrograph with EDS results.(c,d)TEM bright-field images and the corresponding SAED patterns of the intragranular lamellar-shaped LPSO phases,the block-shaped LPSO phases and white eutectic phases.(e)Inverse pole figure(IPF)map and(f)EBSD-based{0001}and{10–10}pole figures from EBSD results.
3.2.Microstructure evolution during CEE-AEC
The microstructures of the CEE-AEC processed samples after different passes on different routes were investigated by OM and SEM,and the results are shown in Fig.5.The corresponding histograms of the grain size distribution are presented in Fig.6.The microstructure after 1p-CEE-AEC shows a heterogeneous grain size distribution,and the appearance of both refined equiaxed grains and the elongated coarse grains are observed(Fig.5a and g).The grain structure develops with a high fraction of serrated grain boundaries and fine grains,and the coarse grains are surrounded by fine grains that form a necklace-like pattern.The the blockshaped LPSO phases are compressed into stream-lined distributions along the ED.In addition,the lamellar-shaped LPSO phases become kinked and zigzagged to accommodate the stress concentration;these processes are commonly activated when slipping and twinning are inhibited in the Mg-RE-Zn alloys(Fig.5d and g)[29,30].The volume fractions of the block-shaped LPSO phases are 15.3% and 12.3%.The microstructural homogeneity progressively increases after 2p-CEE-AEC,accompanied by an the increasing volume fraction of fine grains and a decreasing of average grain size(Fig.5b and h).It is noteworthy that a few coarse grains are observed in the sample processed with route A,while the coarse grains are nearly consumed by the fine grains in route B.From SEM observations in Fig.5e and k,the block-shaped LPSO phases are effectively broken and aligned along the ED at the larger accumulated strain,and the volume fractions further reduce to 14.8% and 11.9%.After 3p-CEE-AEC,the initial heterogeneous coarse-grained microstructure is completely replaced by a fine equiaxed grain microstructure(Fig.5c and i).The microstructure contains uniform dynamically recrystallized grains,dispersed block-shaped LPSO phases at the grain boundaries and reserved lamellar-shaped LPSO phases.Moreover,a considerable number of particle phases precipitate along the grain boundaries,which indicates that the low deformation temperature results in the supersaturated precipitation during CEE-AEC(Fig.5f and l).

Fig.5.Optical and SEM micrographs of the CEE-AEC processed samples.
Fig.6 shows the histograms of the grain size distribution,which show a large variation in the average grain size with the number of CEE-AEC passes on different routes.At the early stage,a small effective decrease in the grain size occurs in the samples processed on route A(18.6±0.4μm),while a significant grain refinement is observed on route B(4.8±0.3μm).After 2p-CEE-AEC,the grain size distribution profile becomes narrow,and a considerable decrease in the grain size is obtained in the samples processed on route A(4.5±0.5μm);however,a slight change in the grain size distribution occurs on route B(3.6±0.4μm).After 3p-CEEAEC,no further decrease in the grain size is observed,and the grain size distribution varies from 1μm to 10μm on routes A and B.The average grain sizes on routes A and B are 4.7±0.3μm and 3.6±0.2μm,respectively.The slight increase in the number of dynamically recrystallized grains can be attributed to the relatively high interpass time spent at the deformation temperature and the lower propensity for recrystallization of the fine grains.Similar results were also reported in previous research studies[31,32].Thus,we can indicate that the continuous grain refinement during CEE-AEC is mainly dominated by DRX.
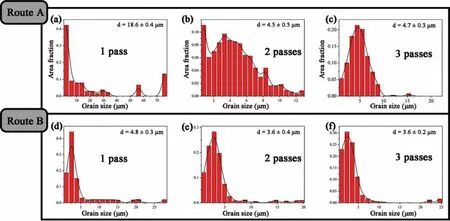
Fig.6.Histograms of the area fraction of the grain size distribution for CEE-AEC processed samples.

Fig.7.TEM bright field images(a,b,c,d,and e)and high resolution TEM image of the fragment of LPSO(f)in the samples after 1p-CEE-AEC.The electron beam is parallel to〈11–20〉.
Fig.7 shows the TEM results for the samples after 1p-CEE-AEC.High-density dislocations induced by the cumulative strain can be observed within the grains(Fig.7a).Furthermore,dynamic precipitates are distributed along the grain boundaries.The kink in the LPSO structures is one of the major deformation mechanisms for Mg-RE-Zn alloys containing LPSO structures.Fig.7b displays the deformation kinks in the lamellar-shaped LPSO structure induced by CEE-AEC.Shao et al.[33,34]proved that the kinking angle increased with an accumulation of the strain,and the kinking in the LPSO structures could propagate into Mg interlayers and neighboring Mg grains.The equilibriumβphase is fragmented as a the result of high strain and induces fine directly recrystallized grains.This process can be defined as the particlestimulated nucleation(PSN)mechanism(Fig.7c).Coarse particles(>1μm)generally promote recrystallization during or after deformation via PSN[35–37].PSN is one of the main mechanisms of recrystallization in particle-containing Mg alloys,and it has a significant influence on the grain structure and texture;thus,it impacts the mechanical properties.Fig.7d shows the microstructure of the sample after 1p-CEEAEC processed on route B.It is apparent that the structure consists of a considerable number of fine recrystallized grains with a nanoscale size,which is in accordance with the optical microstructure(Fig.5c).Moreover,small-sized dynamic precipitates are distributed at the grain boundaries,which can inhibit grain growth.It is worth noting that a considerable number of fine grains are obtained after 1 pass on route B,and the homogeneity of the precipitates dramatically increases.In addition,some coarsened secondary phases can also be observed.Fig.7e shows the block-shaped LPSO phase and its corresponding high-resolution transmission electron microscopy(HR-TEM)image is depicted in Fig.7f.The image demonstrates deformation fragments with an equal width in the block-shaped LPSO structures and sandwiched Mg layers that were observed along the〈11–20〉axis of the Mg.The increased contrast along the fragment boundaries implies that heavier atoms segregate in both the LPSO phases and Mg interlayers during deformation.Shao et al.[34]also observed that heavier solute atoms segregated along the kink boundaries(KBs)and exhibited a brighter contrast.Nie et al.[38]demonstrated that analogous symmetrical KBs in the LPSO structure in the Mg–Y–Zn exhibited a brighter contrast,which implies that the solute atoms tend to be enriched in the KBs during deformation.

Fig.8.The IPF maps(a,b,c,g,h,and i)and GOS maps(d,e,f,j,k,and l)of CEE-AEC processed samples.
3.3.DRX behavior during CEE-AEC
The inverse pole figure(IPF)maps and grain orientation spread(GOS)maps from the EBSD measurements after CEEAEC processing in the ED-TD plane are shown in Fig.8.The shaded areas in the IPF maps and GOS maps represent the block-shaped LPSO phases with low confidence index(CI)values due to the lack of corresponding parameters in the system[39].The critical orientation angle for the dynamically recrystallized grains is defined as 1.8°[40].In general,the IPF maps exhibit a microstructure similar to that obtained with the OM observations,indicating a process in which coarse grains are gradually consumed by fine grains through DRX.
On route A,as seen in Fig.8a,the DRX volume fraction of 1p-CEE-AEC processed samples is 32%,exhibiting a typical bimodal microstructure that consists of coarse grains elongated with a tilting angle of 40 ° towards the ED and fine DRX grains with dispersed orientations.Furthermore,two kinds of obvious strong textures are observed,i.e.,the coarse grains in green indicate the<11−20>//ED orientation,and the coarse grains in red indicate the<0001>//ED orientation.To interpret the DRX behavior and its effect on the crystallographic orientation,coarse deformed grains in region R1 and fine dynamically recrystallized grains in region R2 are extracted from Fig.8a and analyzed in detail in Fig.15.After additional deformation(2p-CEE-AEC),more dynamically recrystallized grains with dispersed orientations are formed,and the DRX volume fraction increases markedly up to 65%(Fig.8e).However,the dynamically recrystallized grains are not homogeneous or equiaxial,and fine grains nucleate at the serrated grain boundaries(GBs)and the triple junctions of the previous dynamically recrystallized grains.This kind of DRX mechanism is reported as DDRX[41].To interpret such a grain refinement behavior,the dynamically recrystallized region R3 is extracted and analyzed in detail in Fig.16.After 3p-CEE-AEC,the DRX volume fraction increases subsequently to 74%.The IPF map shown in Fig.8c exhibits a relatively homogeneous grain structure with a concentrated grain size distribution and smooth boundaries.A limited number of grains with bulges can be observed,such as in the dynamically recrystallized region R4.The specific analysis is interpreted in Fig.16.

Fig.9.EBSD-based{0001}and{10–10}pole figures exhibiting the crystallographic texture of samples after CEE-AEC.
The samples processed on route B present a more homogeneous grain structure and finer grain size distribution.After 1p-CEE-AEC,the DRX volume fraction dramatically reaches 64%,which rivals the result of 2 passes with route A.The coarse grains shown in Fig.8g exhibit an obvious color gradient,indicating the existence of a misorientation change during CEE-AEC.The typical deformed grain region R5 and dynamically recrystallized grain region R6 are selected for detailed analysis,and the results are presented in Fig.15.Upon continued deformation(2p-CEE-AEC),the DRX volume fraction is approximately 74%.Due to the lack of deformed grains,the effect of grain refinement in the deformed grain region is weak,while it is strong in dynamically recrystallized regions.Region R7 in Fig.8h is extracted,and the results are shown in Fig.16.After 3p-CEE-AEC,the grain size distribution is no longer refined,and the(0001)planes in the fine equiaxed grains tend to rotate from a dispersed orientation to being parallel to the ED.This suggests that the cumulative strain induces the high-density dislocations in previous dynamically recrystallized grains,resulting in a rotation of the grain lattice.
3.4.Texture development during CEE-AEC
The{0001}and{10–10}pole figures of CEE-AEC processed samples are shown in Fig.9.The CEE-AEC process has an explicit effect on the maximum texture intensity and distribution of the basal planes.
On route A,it can be seen from Fig.9a that two kinds of typical grain orientations are observed after 1p-CEE-AEC,i.e.,a fiber texture with(0001)planes that tend to be parallel to the ED and a nonbasal texture with basal planes parallel and inclined 45° to the ED(red circles).The formation of the nonbasal texture can be attributed to shear deformation introduced by the asymmetric extrusion cavity.These results have been proven in previous studies[42–44].With further deformation(2p and 3p-CEE-AEC in Fig.9e and i,respectively),a typical rotation of the basal planes results in an asymmetrical nonbasal texture component,which completely changes the initial texture type.The maximum pole intensity exhibits a tendency of first increasing(5.2–10.2)and then decreasing,which can be ascribed to the degree of DRX.It has been reported that dynamically recrystallized grains can effectively weaken the deformation texture in Mg alloys[45].

Fig.10.EBSD Schmid factor maps for basal〈a〉slip of CEE-AEC processed samples based on EBSD results.
There is a distinct difference in the grain orientations in the samples processed on route B.After 1p-CEE-AEC,as shown in Fig.8c,it can be seen that the nonbasal texture with a 15° inclination of the basal planes from the TD towards ED appears,and the basal texture similar to Fig.8a remains.However,in comparison with the sample processed on route A,the nonbasal texture component rotates approximately 90° along the ED,which is similar to the transformation of the metal flow(Fig.1d).After 2p-and 3p-CEE-AEC(Fig.8g and k),a more random texture component than that for the same processing condition on route A is observed,exhibiting a weak intensity and titling and spreading of the(0001)basal planes in most grains.This suggests that fine grains with dispersed orientations change the initial preferred orientation.The effect of the reorientation of the lattice and subsequent tilting of the basal planes increases the possibility of activating basal〈a〉slip.The maximum pole intensity shows a continuous weakening.
Fig.10 shows the EBSD results of the Schmid factor for{0001}〈11–20〉basal slip(mbasal)under tension in the ED and TD.Fig.10 illustrates the distribution of the average Schmid factor in the as-received and CEE-AEC processed samples.As shown in Figs.9 and 10,there is a distinct tensile anisotropy in the as-received samples in terms of the strong difference of the Schmid factor values between the ED and TD,and the values of the Schmid factor invariably increase with increasing CEE-AEC passes.In Mg alloys,the activation of basal{0001}〈11–20〉slip is the main mechanism governing the plastic deformation at room temperature;thus,its Schmid factor value plays an important role in understanding the mechanical behavior[46].Specifically,a higher Schmid factor means a lower tensile yield strength(TYS)under the same conditions.

Fig.11.Distribution of average Schmid factor of as-received and CEE-AEC processed samples.
On route A,a weakening of the anisotropy is observed after 1p-CEE-AEC.The coarse grains in red with mbasalfrom 0.4 to 0.5 provide a dramatic optimization in the distribution of the Schmid factor under tension in the ED and TD(Fig.9a and b)).Based on the above IPF analysis data and the distribution maps of the Schmid factor,this behavior is attributed to the rotation of the(0001)planes by an angle of 45°,which is the soft orientation to operate the basal〈a〉slip(Fig.8a).The mbasalafter 2 and 3 passes presents a steady upward trend with little difference in the average weighted Schmid factor value for tension in the ED and TD(Fig.10).In comparison with that on route A,the distribution of the Schmid factor on route B is more dispersed with no specific enhancement in the ED or TD,which can be attributed to the relatively high degree of DRX at the early stage.Thus,the texture with a relatively stable Schmid factor may have a limited influence on the tensile strength variation on route B.

Fig.12.Mechanical properties of the as-received and CEE-AEC processed samples:(a)ultimate tensile strength,(b)tensile yield strength,and(c)fracture elongation.
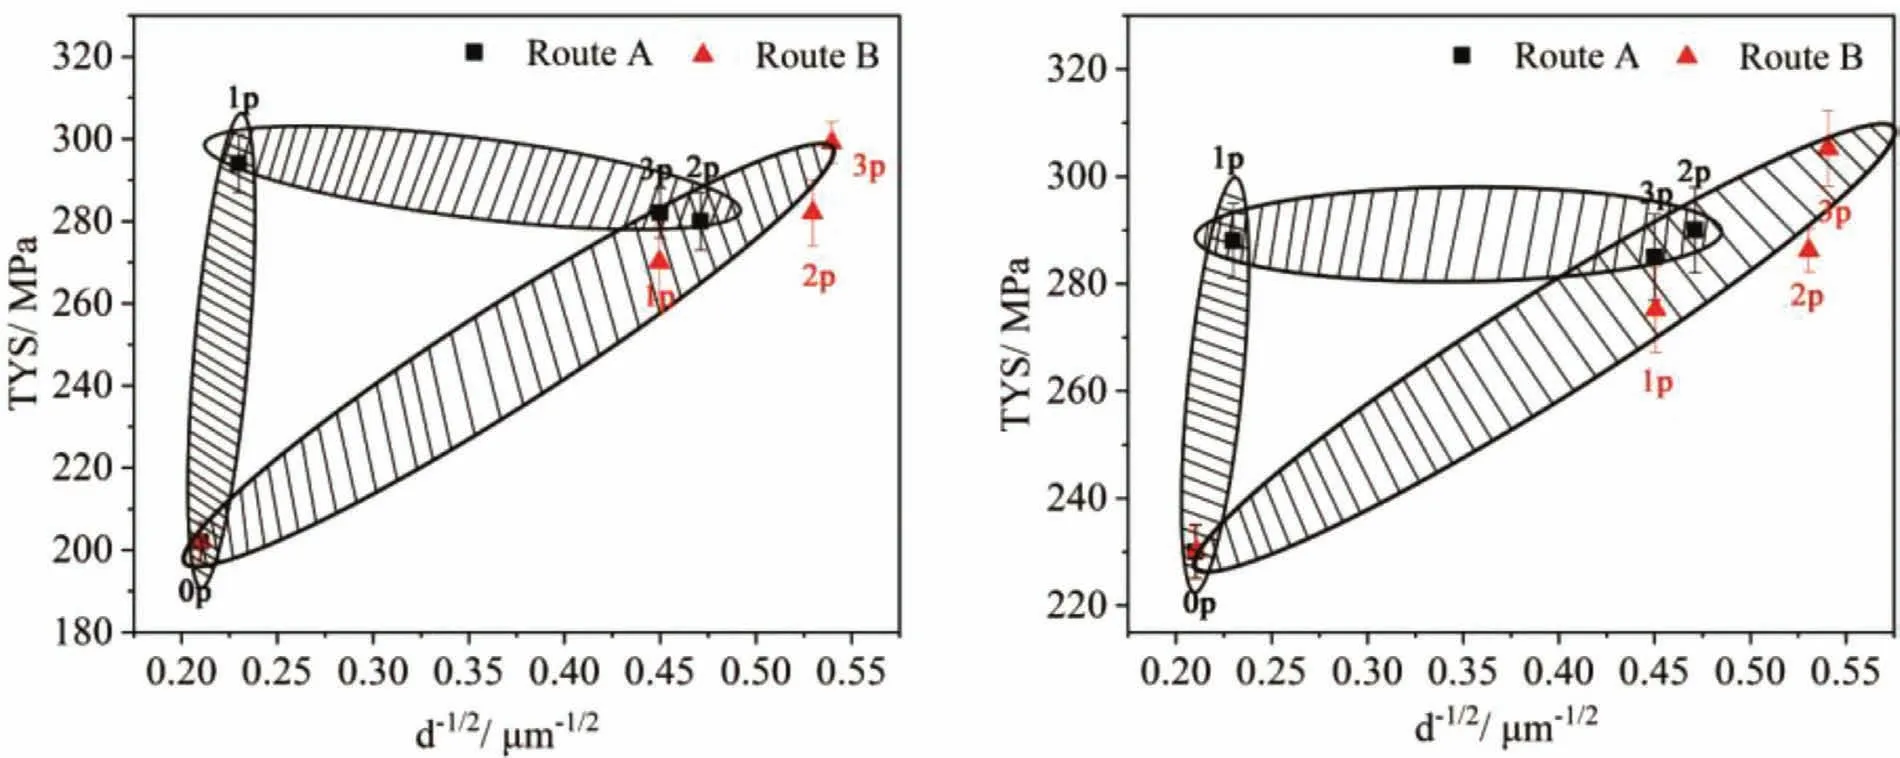
Fig.13.Analysis of grain refinement effect on the tensile yield strength of the as-received and CEE-AEC processed samples:(a)TYS against d−1/2 in ED and(b)TYS against d−1/2 in TD.
3.5.Mechanical properties
Fig.12 shows the ultimate tensile strength,tensile yield strength and fracture elongation of the as-received and CEEAEC processed samples with different loading directions.It is apparent that the as-received alloy with a heterogeneous grain structure shows a lower tensile strength as well as an obvious mechanical anisotropy.The TYS in the TD is higher than that in the ED.After 1p-CEE-AEC,the tensile properties are obviously increased,and the mechanical anisotropy is dramatically improved.With further deformation,a different trend for the mechanical properties takes place for routes A and B,respectively.On route A,the tensile strength is slightly decreased after 2p and 3p-CEE-AEC,while an increase in the ductility is observed.On route B,the changes in the UTS and TYS match well with the Hall–Petch criterion,while the fracture elongation shows a sudden decrease after 3p-CEE-AEC.Moreover,the mechanical anisotropies of the CEE-AEC processed samples loaded in the ED and TD decease due to the strain accumulation and the shear strain introduced from the asymmetrical extrusion cavity.
For a quantitative understanding of the mechanical properties,the relationships between TYS andd−1/2in the ED and TD were examined,and the Hall-Ptech plot is shown in Fig.13.A similar tendency is observed regardless of whether the loading occurred in the ED or TD.Two different trends for the properties can be obtained for the samples processed on routes A and B:(1)there is a sharp increase in the TYS after 1p-CEE-AEC on route A,while there is a decrease after continued deformation;and(2)there is a continuous rise in the TYS as the CEE-AEC number increases on route B.For the Hall-Petch plot for route A,the texture modification is thought to be responsible for the deviation from the Hall-Petch criterion,and the same results are observed in previous studies of SPD[47,48].The results for route B seem as if only the grain refinement governs the TYS,obeying the Hall-Petch criterion.However,we believe that this phenomenon may be associated with a competitive balance relation between the grain refinement and the texture softening.The detailed strengthening mechanism is discussed in the following sections.
4.Discussion
4.1.Microstructural homogeneity
In the current study,the main purpose of the consecutive pass deformation and change in processing routes is to achieve the grain refinement and fragmentation of secondary phases.It is widely known that the poor formability of Mg alloys at ambient temperature results from the limited basal〈a〉slip systems and inactive nonbasal slip systems.Nevertheless,fine grains can decline the twinning mechanism and promote the activation of nonbasal slip.Koike et al.[49]reported that the nonbasal slip systems of Mg alloys as well as basal slip systems in fine grains could be activated because of the grainboundary compatibility effect.Moreover,Mg alloys are prone to achieve DRX during the thermoplastic deformation due to their low stacking fault energy.
In the present study,a fine equiaxed grain structure is observed after 3p-CEE-AEC for both routes.The main purpose of choosing the condition with a decreasing deformation temperatures is to inhibit grain growth.It is widely agreed that a fine grain structure can improve both strength and ductility.However,lower temperatures increase the difficulty of deformation,especially for Mg–Gd–Y–Zn–Zr alloys.The CEE-AEC processed samples experience a homogenous deformation(no fractures and cracks)on both routes,and no twinning activation is observed.The decrease in the average grain size increases the critical resolved shear stress(CRSS)value for twinning deformation.The prominent grain refinement is results from DRX.It is agreed that the deformation temperature and accumulation of strain are two crucial factors that control the DRX.An elevated temperature and high accumulated strain can induce the production of highdensity dislocations and subgrain boundaries.In contrast,a lower temperature leads to the accumulation of dislocations,which cannot be rapidly absorbed at grain boundaries.This suggests that a low deformation temperature can inhibit grain boundary migration.Yan et al.[50]investigated the formation of AZ80+0.4%Ce Mg alloy tubes and concluded that the grain growth at high temperatures was more obvious than that at low temperatures.The more uniform microstructure from route B can be attributed to a change in the orientation of the extrusion plane with respect to the expansion plane.Furthermore,the differences in the orientation and aspect ratio of the flowing metal can be another reason for this result.The shear strain introduced by the asymmetrical cavity may also increase the uniformity.

Fig.14.The volume fraction and average size of the block-shaped LPSO during CEE-AEC.
In addition,the elevated temperature and strain accumulation effectively influence the morphology and distribution of the LPSO phases.Fig.14 lists the statistical volume fraction and average sizes of the samples after CEE-AEC.It can be clearly noted that increasing CEE-AEC passes and deformation temperature accelerates the decrease in the volume fraction and the average size of the block-shaped LPSO phases.Specifically,the most obvious reduction in the block-shaped LPSO phases takes place after 1p-CEE-AEC on both routes due to the solid solution.It has been reported that Gd has a maximum solubility of 23.4wt% in a Mg matrix at 821K and decreases to 3.82wt.% as the temperature decreases to 473K.The same result was obtained by Sun et al.[51].Furthermore,the size of the block-shaped LPSO phases decreased with increasing CEE-AEC passes due to the strain accumulation,and these phases can induce the PSN mechanism and inhibit the boundary migration.In a related study,Xu et al.[52]reported that the dispersion of interdendritic block-shaped LPSO particle fragments can induce the PSN to achieve grain refinement.Moreover,it is known that the nucleated fine grains would grow after further processing because of the elevated temperatures and the strong difference in the dislocation density between the new and parent grains.However,the fine grains would be eliminated by the block-shaped LPSO particle fragments during the process of boundary migration.
4.2.DRX mechanisms
From the EBSD results,it is known that the grain refinement during CEE-AEC is mainly dominated by DRX.Moreover,the appearance of grain rotation and serrated grain boundaries indicates that the CDRX and DDRX occur in different regions.To understand the relation between DRX behaviors and processing routes as well as deformation passes,several typical regions are selected from Fig.8 for detailed analysis.
In the deformed grain region R1 of route A,shown in Fig.15a,many subgrain boundaries(sub-GBs)are formed within it,and the whole coarse deformed grain is subdivided into three parts,namely,P1,P2 and P3,by the formation of the sub-GBs.Fig.15a1shows the misorientation gradient in the deformed grains of point-to-origin along the lines AB and CD in P1 and P3.The misorientation angles in P1 and P3 gradually rise to 19° and 9°,respectively,indicating that the grains have a high dislocation activity.Moreover,it can be clearly seen that several fine DRX grains labeled from 1 to 12 are obtained at the region where a high density of sub-GBs exists.It can be interpreted that the formation of fine grains is related to the transformation of sub-GBs by continuous absorption of dislocations.This kind of DRX mechanism is defined as CDRX.The transformation process can be more apparent observed in the grains labeled as 3 and 7–12,which are surrounded by a high density of sub-GBs.Moreover,the newly formed grains have a similar orientation to the deformed grains with<0001>//ED(Fig.15a2).In the dynamically recrystallized region R2,shown in Fig.15b,three kinds of grains are distinguished,i.e.,deformed parent grains,dynamically recrystallized grains and subgrains.It is clearly noted in Fig.15b that the deformed grains consist of irregular grains with serrated grain boundaries(GBs).The fine dynamically recrystallized grains are formed from the growth of sub-grains,and the subgrains in deformed grains are isolated by the sub-GBs along the serrated boundaries.Compared with the formation of dynamically recrystallized grains due to the transformation from LAGBs to HAGBs,such sub-GBs have different feathers.The bowing and bulging of parent grains towards the adjacent grains lead to the formation of S1 and S2(Fig.15b).Furthermore,dynamically recrystallized grains labeled as 10–13 and 16 are formed at the junction between P1 and P2,and other newly formed grains are formed at the serrated GBs.The nucleation by bowing in pre-existing serrated GBs reveals the occurrence of DDRX.In Fig.15b1,it can be observed that the subgrains have the same orientation as the deformed parent grains,while the discontinuous dynamically recrystallized grains show a dispersed orientation.Thus,it can be concluded that the CDDRX and DDRX mechanisms cooperate to achieve grain refinement after 1p-CEE-AEC.Fig.16 shows the IPF maps of the samples processed after 2 and 3 passes.As seen in Fig.8e and f,the DRX volume fractions of samples processed on route A increase to 65%and 77% after 2p and 3p-CEE-AEC,respectively,and the dynamically recrystallized grains exhibit a homogeneous grain size distribution,except for the deformed region.Regions R3 after 2 passes and R4 after 3 passes are selected in Fig.8b and c(Fig.16a and b),respectively,considering that dynamic recrystallization has not fully occurred.It can be seen that several subgrains and new dynamically recrystallized grains nucleated at the serrated GBs and the junction of previous dynamically recrystallized grains,showing the same results as Fig.15.Thus,it can be concluded that the DDRX plays a dominant role and that CDRX plays a subordinate role in the microstructure evolution from 2 passes to 3 passes of deformation on route A.

Fig.15.The DRX mechanism and its effect on nucleation:(a,b,c and d)IPF maps,(a1 and c1)line profiles of point to origin along the black lines in the deformed grains,(a2,b1,c2 and d1)(0001)pole figure of crystallographic orientations of the marked grains.(P:deformed parent grain,i=1,2…:DRX grains).
The similar deformed grains and dynamically recrystallized grains regions on route B that are selected in Fig.8g are shown in Fig.15c and d.Based on the analysis of Fig.15a and b,consistent results are also obtained for the samples processed on route B.Thus,it can be concluded that the CDRX and DDRX processed cooperate to achieve microstructure evolution during 1 pass deformation on route A.However,a limited number of high-activity of dislocations is observed in the deformed grains P1 and P2,indicating that the transformation of the LAGBs to HAGBs is nearly completed by the sub-GBs absorbing the dislocations.The DRX volume fraction is 64%,revealing that few coarse deformed grains are left.However,the inhomogeneous grain structure in the dynamically recrystallized grain region reveals that the DRX has not fully taken place.To display the DRX in the grain region,region R7 is chosen from Fig.8h.The dynamically recrystallized grains and subgrains are nucleated at the serrated GBs,which is consistent with the processing from 2 passes to 3 passes on route A.As a result,the DDRX mechanism plays a dominant role in the microstructure evolution during 2 deformation passes.
4.3.Texture evolution mechanism
The evolution of texture during CEE-AEC processing is strongly related to the processing routes and deformation passes(Fig.9).Li et al.[53]proposed that the main slip plane or slip direction is gradually rotated to the macroscopic shear direction during ECAP with different processing routes.Moreover,the elevated deformation temperature is beneficial for the activation of nonbasal slip systems and the occurrence of DRX.Agnew et al.[54]found that the activation of nonbasal〈c+a〉slip systems can be responsible for the inclination of the basal texture.It is widely accepted that the recrystallization texture of Mg alloys can weaken the preferred orientation texture[45,55].
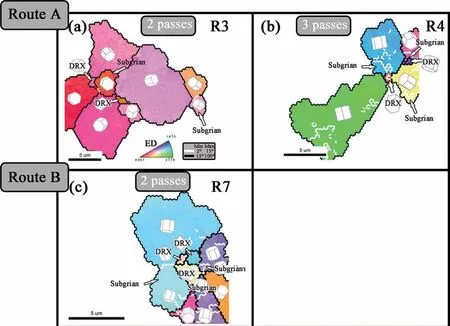
Fig.16.The IPF maps of the DDRX mechanism and its effect on the nucleation.
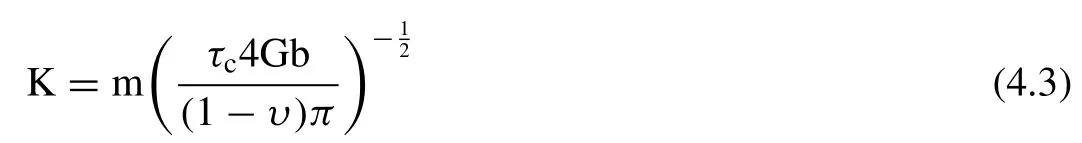
Fig.17 shows a schematic image of the texture evolution after CEE-AEC.After 1p-CEE-AEC,it can be noted that the spread of the basal poles from the ED to TD and the rotation of the main texture are observed.The phenomenon of TD spread has been reported in many studies and may be related to the DRX mechanism,such as the PSN mechanism[56,57].Al-Samman and Li[58]reported that the segregation of RE atoms at grain boundaries can influence the recrystallization kinetics,resulting in the TD spread of the basal poles.The inclination of the basal texture from the ED towards TD may result from the shear strain introduced from the asymmetrical extrusion cavity.Similar results have been proven in many ECAP investigations[55,59,60].Moreover,nonbasal〈c+a〉slip would be activated more easily at the high temperature(753K)due to the significant decrease in the CRSS.With further deformation,the CEE-AEC processed samples would be rotated 180° along the ED after each pass,which redistributes the texture components.It can be seen that the main texture gradually alternates with the inclination in the ED and TD due to the shear strain and the processing routes.Moreover,the spread of nonbasal texture is enhanced in the subsequent passes,and weak basal texture components are observed,suggesting an increase in the number of fine grains with a dispersed orientation and the activation of nonbasal slip systems(Fig.9).
4.4.Strengthening mechanism
The strengthening process of Mg alloys with LPSO structures can be divided into(i)grain boundary strengtheningσGB,(ii)dislocation strengtheningσdislocation,(iii)solid solution strengtheningσsolution,(iv)precipitation strengtheningσprecipitation,and(v)other strengtheningσother[61].

4.4.1.Grain boundary strengthening
The Hall-Petch(H-P)criterion is the main basis for grain boundary strengthening,which indicates that the yield strength increases as the grain size decreases..The formula for the H-P criterion is showing as follows:

whereσ0is the yield strength of the single crystal(46.5MPa for Mg–Gd series Mg alloys[62]),d is the average grain size(μm),and k is the constant which can be defined as 4–3[63].
where m is the Taylor factor,τcis the critical stress for dislocation slip through the grain boundary,υis the Poisson’s ratio(0.35),and b is the Burgers vector(3.21×10⁻¹⁰in Mg alloys[64]).When the condition ofd>1μm is achieved,τcis constant,and K is approximately 164 MPa/for Mg–GdY alloys[61].Thus,the increase in the yield strength due to grain refinement is 112MPa.
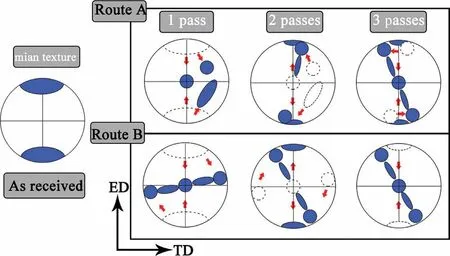
Fig.17.Schematic illustration of the main texture evolution mechanism during CEE-AEC.
4.4.2.Dislocation strengthening
The equation that describes dislocation strengthening is as follows[65]:

whereαis a constant determined by the materials that can be selected as 0.2,Gis represented by the shear modulus(1.66×10⁴MPa for Mg alloy[66]),bis the Burger vector(0.32nm)andρindicates the dislocation density of the alloys,which can be taken as 1×10¹⁴/m2.Thus,the contribution from dislocation strengthening can be calculated to be 40MPa.
4.4.3.Solid solution strengthening
It has been reported that RE elements have a high solid solubility in the Mg matrix.Moreover,Gd atoms replace Mg atoms and enter the Mg lattice structure,causing the distortion.The contribution of the solid solution can be represented as follows[64]:

whereσuis the yield strength of Mg(21MPa[67]),εis the experimental constant,and C is the concentration of RE atoms.
Fig.18 shows the relationship between the solubility of the Gd atom and yield strength,according to the results obtained by Rokhlin[67]et al.In the present work,the Gd solubility is approximately 3.4%,and the volume fractions of the Mg5RE and LPSO phases are approximately 5% and 13%,respectively.The dissociative RE elements range from approximately 0.8–1.3%.Thus,the contribution of solid solution strengthening is approximately 70MPa
4.4.3.Precipitation strengthening
The precipitated phases could effectively pin dislocation motion;thus,they play an irreplaceable contribution to the strength of Mg-RE alloys.For Mg–Gd–Y–Zn–Zr alloys,the contribution to precipitation strengthening mainly comes from the precipitated phaseβ′and LPSO phases[61].In the present study,precipitation strengthening can be established by the formula below[64]:

whereνis the Poisson’s ratio,fνrepresents the fraction of LPSO phases,and dpindicates the average diameter of LPSO phases.The contribution of the LPSO phases of CEE-AEC samples is approximately 16MPa.
The strengthening from grain boundaries,dislocations,the solid solution,and precipitation is roughly calculated to be 238MPa for samples processed on route A,which is below the TYS of RD 282MPa for the RD.Thus,the contribution of other strengthening mechanisms,such as texture strengthening or short-fiber strengthening[64],is approximately 44MPa.The contribution from the different strengthening mechanisms are shown in Table 2.For the samples after CEE-AEC,the grain boundary strengthening accounts for the largest contribution for the TYS(44.8%),and the effect of the solid solution accounts for a relatively high fraction.
4.5.Tensile behavior
In wrought Mg alloys,an increasing Schmid factor indicates a decreasing TYS.This can be attributed to that the grains with tilted basal planes facilitating the activation of the basal〈a〉slip system.The Schmid factor equation can be defined as follows:


Table 2Roughly calculated values for the different strengthening mechanisms.
whereτcis the critical resolved shear stress(CRSS)for a certain slip system,σyis the tensile yield strength,andλandφare the angles between the flow stress and the slip direction and normal to the slip plane,respectively.
On route A,an important result observed in the present work is that with increasing CEE-AEC passes,the fracture elongation increases continuously,while the TYS shows a significant increase in the early stage and then decreases monotonically,although the grains are refined.The change in the texture component is thought to be responsible for this behavior.In Figs.12 and 13,it can be seen that the average Schmid factor can reflect the stress state of a textured polycrystalline alloy.If the basal slip plays a leading role in the ambient temperature deformation of Mg alloys,an increasing Schmid factor determines the decreasing TYS.Instead,the improvement in the fracture elongation can also be attributed to grains with basal planes facilitating the activation of basal〈a〉slip[68].The considerable enhancement in the tensile strength after 1p-CEE-AEC can be partly attributed to the grain refinement.On the other hand,the specific texture component with a high intensity strengthens the matrix.Moreover,the kinking of LPSO phases inhibits the slipping of basal〈a〉slip,and the high density of dislocations still remains.With further deformation(2p and 3p-CEE-AEC),the original LPSO phases are gradually dissolved into the dynamically recrystallized grains(Fig.5f and g).Rong et al.[69]investigated whether the LPSO phases are dissolved during DRX and precipitated during subsequent grain growth.Thus,it can be concluded that the crucial factors for an increase in the fracture elongation and decrease in the TYS are the coordination of the grain refinement and texture modification.Furthermore,compared with grain boundary strengthening,the spread and tilting of the basal texture with a high Schmid factor play the main roles in controlling the TYS.
Compared with that for route A,the effect of the texture from sample processed on route B is more obvious(Fig.13).Moreover,finer grain structures with more dispersed of secondary phases are observed in route B.It is known that fine grains can achieve a high strength and improve the ductility,and the precipitates can block the motion of dislocations and contribute to the TYS.The average Schmid factor is in a relatively high range,and the elongation has a considerable increase,which can be attributed to the tilting of the basal texture due to the shear strain introduced by the asymmetrical cavity.The approximately linear relationship between the increase in the TYS and average grain size can be mainly ascribed to the grain boundary strengthening and precipitate strengthening.However,a shape decrease in the fracture elongation occurs after 3p-CEE-AEC,which can result from that the excessive number of precipitates reducing the interface bonding strength.Zhou et al.[9]investigated that too many precipitates in Mg–Gd–Y–Zn–Zr alloys can worsen the ductility.The fracture surface can prove that the source of the fracture is the particle precipitates.

Fig.18.The relationship between tensile the yield strength and Gd atomic concentration in Mg-Gd alloys.
Fig.19 shows the tensile fracture surfaces of the samples processed after 3p-CEE-AEC tested at ambient temperature.In general,on route A,the fractured samples in the ED and TD exhibit the ductile fractures with a large number of dimples.Specifically,fine equiaxed dimples occupy the fracture surface of the samples in the ED(Fig.19a),while small and shallow dimples are observed in the specimens tested along the TD(Fig.19b),corresponding to the higher fracture elongation in the ED and lower fracture elongation in the TD(Fig.11c).On route B,the fracture morphologies of the samples show a mixed fracture mechanism.In Fig.19b and d,the block-shaped LPSO fragments and particle phases are exposed on the fracture surface,and a limited number of dimples can be observed.The presence of block-shaped LPSO phases is related to the crack initiation.Furthermore,a large number of dynamic precipitates reduces the bond strength of the grain boundaries.The results of the fracture morphologies of the tensile specimens are identical to the mechanical properties.Based on this,it can be concluded that high strain accumulation increases the dispersion of the second phase,but there is a limit that should not be exceeded to prevent decreasing the fracture elongation.
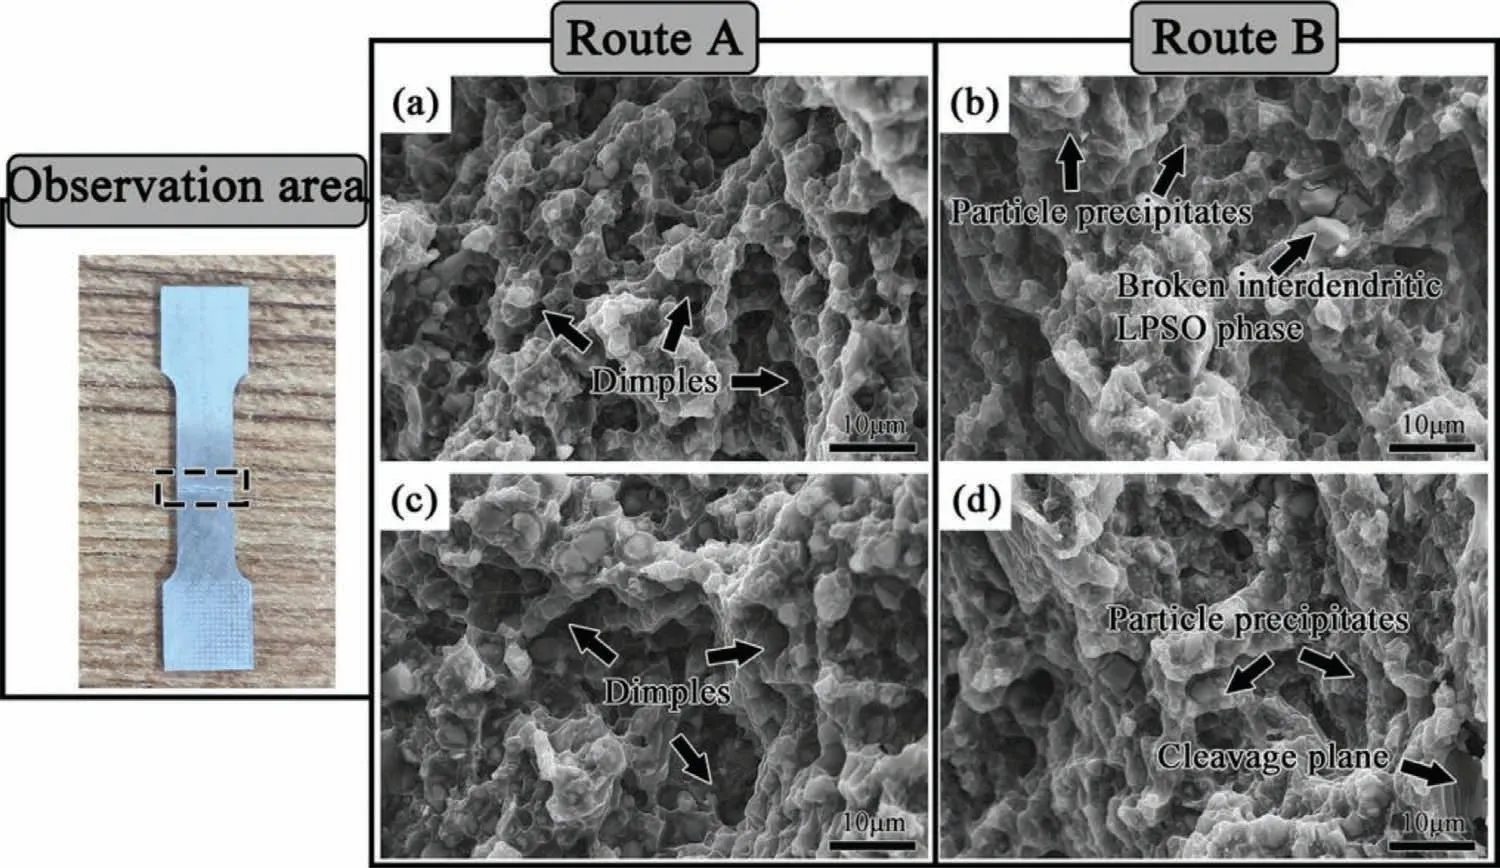
Fig.19.SEM graphs of the fracture morphologies of the tensile specimens after 3p-CEE-AEC:(a,b)ED and(c,d)TD.
5.Conclusions
The present work studied the effect of processing routes on the microstructure evolution,texture development and the resultant mechanical properties at room temperature of CEE-AEC processed Mg–Gd–Y–Zn–Zr alloys.The samples with dimensions of 50mm×100mm×220mm were processed through CEE-AEC on routes A and B at the decreasing temperatures.The main findings are obtained as follows:
(1)In terms of grain refinement,processed on route B is proven to be a more effective method than on route A.CEE-AEC promotes the DRX behavior of Mg–Gd–Y–Zn–Zr alloys,leading to a significant grain refinement,and a homogeneous grain structure with an average grain size of 4.5±0.5μm is obtained on route A,while an alloy with a finer average grain size of 3.6±0.4μm is fabricated through route B after 2p-CEE-AEC.Moreover,an additional pass cannot continue to refine the grains but regulates the grain orientation.
(2)Different routes of CEE-AEC give various texture characterizations and route B provides a more random texture than route A.During the processing of CEE-AEC,the initial fiber texture becomes disintegrated,and a new texture with the different extents of inclination or spread of the basal poles is developed.
(3)Tensile results reveal that the samples processed on route A exhibit a decrease in the TYS due to a rotation of the basal texture facilitating the activation of the basal〈a〉slip system.This suggests that the weakening of the texture plays a more dominant role in the determination of the TYS than the grain refinement.However,an opposite result is obtained in the observation of samples processing on route B because the grain boundary strengthening plays the main role in the increasing the TYS and the texture plays the minor role.
(4)The ductility of the CEE-AEC processed alloy has been remarkably improved due to a homogeneous grain structure and texture modification.However,excessive particle phases can worsen the fracture elongation.
Conflict of interest
The authors declare no conflict of interest.
Acknowledgments
The authors acknowledge the support of the National Natural Science Foundation of China under grant No.51775520,No.52075501,the Key R&D program of Shanxi Province(International Cooperation)under grant No.201903D421036,the Scientific and Technological Innovation Programs of Higher Education Institutions in Shanxi under grant No.2018002,and the Natural Science Foundation of Shanxi Province under grant No.201801D121106.
 Journal of Magnesium and Alloys2021年3期
- Journal of Magnesium and Alloys的其它文章
- Modifying microstructures and tensile properties of Mg-Sm based alloy via extrusion ratio
- The effects of Ca and Mn on the microstructure,texture and mechanical properties of Mg-4 Zn alloy
- H2 generation kinetics/thermodynamics and hydrolysis mechanism of high-performance La-doped Mg-Ni alloys in NaCl solution—A large-scale and quick strategy to get hydrogen
- The slip activity during the transition from elastic to plastic tensile deformation of the Mg-Al-Mn sheet
- Rotational and translational domains of beta precipitate in aged binary Mg−Ce alloys
- Does acid pickling of Mg-Ca alloy enhance biomineralization?