
The preferential growth and related textural evolution during static recrystallization in a cold-rolled Mg–Zn–Gd alloy
2021-10-28 10:08:20ZhoYnChenEnHouHn
Journal of Magnesium and Alloys 2021年3期
L.Y.Zho,H.Yn,R.S.Chen,En-Hou Hn
a The Group of Magnesium Alloys and Their Applications,Institute of Metal Research,Chinese Academy of Sciences,62 Wencui Road,Shenyang 110016,China
b School of Materials Science and Engineering,University of Science and Technology of China,72 Wenhua Road,Shenyang 110016,China
Abstract The grain growth process plays an important role in the texture formation in magnesium alloys.The microstructural and micro-textural evolution of a cold-rolled Mg–Zn–Gd alloy during annealing at 350 °C for 60–190min were tracked by quasi-in-situ electron backscatter diffraction method.The results show that grain growth takes place gradually with the annealing time increasing.Moreover,the TD-split texture maintains the texture type but alters in three aspects-the increased tilting angle,the decreased pole intensity and the widened distribution of high-intensity area.Grains with their c-axis tilting 45–70° from normal direction show preferential growth which is closely associated with the texture changes.The original grain size advantage is one of the important factors leading to the growth advantage,some grain boundaries,such as 50–60°[20],50–60°[70],60–70°[20](Σ18b),and 70–80°[1010](Σ10)are also considered to be related to this preferential growth.© 2020 Chongqing University.Publishing services provided by Elsevier B.V.on behalf of KeAi Communications Co.Ltd.This is an open access article under the CC BY-NC-ND license(http://creativecommons.org/licenses/by-nc-nd/4.0/)Peer review under responsibility of Chongqing University
Keywords:Grain growth;Preferential growth;Texture;Static recrystallization;Magnesium alloys.
1.Introduction
The recrystallization process,especially recrystallization grain growth(GG),has an important effect on the mechanical properties of materials.On one hand,GG can modify grain size which directly affects the yield strength of materials[1-3].On the other hand,the texture evolution during recrystallization,which plays an important role in plasticity and formability[4-6],is related to the GG process closely[7-9].Therefore,it is very necessary to study the GG process.
Lots of study on preferential grain growth(PGG)have been done in face-centered cubic(fcc)and body-centered cubic(bcc)metals,such as the faster growth of recrystallization cube-orientated grains than others in aluminum(Al)and copper(Cu)[10],the growth advantage ofγ-fiber grains({111}[112])in low-carbon steels[11],and so on.Regarding hexagonal close packing(hcp)metals,such as magnesium(Mg)alloy,few specialized studies on GG have been done and the research on GG is mostly reported in the papers which discuss the formation mechanism of texture.
For commercial AZ31 and pure Mg,grains with their caxis nearly parallel to the normal direction(ND)show growth advantage and this PGG is considered to be the key factor for the formation of strong basal texture[12,13].However,opinions on the GG in rare-earth(RE)contained Mg alloys are different.Grains with non-basal orientation are observed to grow preferentially in Mg(-Zn)-RE alloy[14-16].For example,Imandoust et al.[16]characterized the inverse pole figure(IPF)sheets of all recrystallization grains and the larger grains over 25μm,then found that the latter show more obvious[111]-[113]//ED(extruded direction)orientation,and thus believed these grains have growth advantage.However,uniform grain growth is reported[17-19].For instance,Guan et al.[19]divided the recrystallization texture into four different components and considered the absence of PGG according to the invariance of average grain size at each annealing state and almost unchanged number fraction during the whole grain growth process.In addition,although the PGG is discussed in some papers,the reason for it is still controversial.Many factors,like grain size difference[9,20,21],storage energy[14,16],grain boundary(GB)misorientation[22,23],solute atoms segregation[16,24],and so on,can affect the GG process.

Fig.1.(a-g)Quasi-in-situ IPF maps of cold-rolled ZG21 during annealing at 350 °C with various time:(a)60min,(b)65min,(c)75min,(d)85min,(e)100min,(f)130min,(g)190min,and(h)changes of grain number and average grain diameter over annealing time,together with(i)grain diameter distribution under different annealing states displaying the microstructural evolution.
To address the above issues,a quasi-in-situ electron backscatter diffraction(EBSD)method was used to track the GG process during static recrystallization(SRX)annealing.The studied alloy was cold-rolled Mg–Zn–Gd alloy sheet with special elliptical annular texture[25].The detailed microstructural and micro-textural evolution during annealing process were observed to explain the correlation between GG and texture evolution.Moreover,whether PGG exists and the mechanism for it will be discussed.
2.Experimental procedure
The experimental material was hot-rolled Mg–1.73Zn–0.78Gd(wt.%,ZG21)sheet(the detail information of hotrolling can be seen in Ref.[26]).The consecutive multi-passes cold-rolling was performed on hot-rolled ZG21 sheet and the cold rolling direction(RD)was parallel to the RD of the hot-rolled sheet.The per-pass and accumulated reduction is 5% and 20%,respectively.A rectangular sample 12(RD)×8(transverse direction,TD)×2(ND)mm3was cut from the cold-rolled sheet and annealed at 350 °C for 60min to get fully recrystallization microstructure.
We use quasi-in-situ EBSD to track the grain growth process.The EBSD scans were taken after 60,65,75,85,100,130 and 190min annealing at 350 °C.This sample was mechanical and electrochemical polished for first EBSD scan,then annealed for additional 5min and ion etched using Leica RES101 to remove oxide layer or tarnish for the second scan,and done same treatment for rest scans.Fiducial marks were made on the sample surface before the first scan,so that the same area could be accurately captured each time.The EBSD test and data processing is the same as used in Ref.[27]except the magnification and step length are 500×and 0.6μm,respectively.
In addition to EBSD,transmission electron microscope(TEM)is used to observe the segregation of solute atoms.The TEM test is processed on JEOL JEM-2100F equipped with energy-dispersive X-ray spectroscopy(EDX)operating at 15kV.The observation plane in not only EBSD but also TEM experiments is RD-TD plane.
3.Results
3.1.The quasi-in-situ microstructural and micro-textural evolution during annealing
After annealing at 350 °C for 60min,fully SRX microstructure is achieved(Fig.1a).The quasi-in-situ microstructural evolution during annealing from 60 to 190min is shown in Fig.1(a–g).With the annealing time increasing,the number of grains decreases from 2042 to 1717 while the average grain diameter increases from 4.9 to 5.4μm(Fig.1h).Fig.1i provides the number fraction of grains with different size under each annealing state.After 60min annealing,the grains with size around 3μm occupy the highest fraction.As annealing time increases(190min),the fraction of 3μm grains decreases obviously and that of grains over 3μm(5–21μm)increases a little,which indicates the grain size distribution tends to be more uniform.According to the above results,we can say that the GG belongs to normal GG process during the 60–190min annealing process.
Fig.2 presents the micro-textural evolution of the coldrolled ZG21 alloy during annealing.After 60min annealing,the texture is a TD-split texture with two obvious poles tilting 40° from ND towards TD and the high-intensity area(with red and yellow color)is concentrated within 30–60°(the black dotted circle)along TD in the(0002)PF.With annealing time increasing,the texture type maintains the same.However,three changes should be noticed.Firstly,the tilting angle gradually increases to 50°.Secondly,the pole intensity decreases from 5.40 to 4.27.Thirdly,the distribution of highintensity area(indicated by a black dotted circle in Fig.2(a,d,g))is widened(around 30–80°).
3.2.The PGG during annealing
It is reasonable to link the normal GG process to the texture evolution.In order to ensure this relationship,the texture is subdivided to four different texture components(TCs)-TCA,TCB,TCC and TCD,the tilting angle from ND of which is 0–20°,20–45°,45–70° and 70–90°,respectively.Figs.3-6 provide the(0002)PF sheets and corresponding IPF maps of TCA-TCD grains during 60–190min annealing.As the(0002)PF displays the c axis distribution of grains,we can say that the angle between c axis of TCA grains and ND is 0–20°.That is,TCA-TCD represent grains with different c axis orientation.
Grains with TCA orientation distribute homogeneously within the area of 0–20°(Fig.3).For grains with TCB orientation(Fig.4),they distribute toward not only TD but also RD,and the intensity of the latter is a little weaker than that of the former.For TCC grains(Fig.5),they are oriented towards TD preferentially and almost all TCD grains exhibit TD orientations(Fig.6).During the whole annealing process,no obvious change is observed in the orientation distribution of TCA-TCD grains.As shown in Fig.3,many fine grains with TCA orientation can be seen at the initial state(Fig.3a)and the number of them is decreased(Fig.3g)during the GG process.Similarly,the decrease of the number of grains was also observed in the other three type of grains(Figs.4-6).
In order to explore whether PGG exists among these four orientation grains,the change in average grain size with annealing time of TCA-TCD grains is shown in Fig.7a.With annealing time increasing,the size of TCA-TCD grains gradually increases,among which grains with TCC orientation show obvious growth(from 5.1 to 5.8μm).At 60,65 and 190min annealing states,the order of average grain size is TCD>TCC>TCB>TCA while the order is TCC>TCD>TCB>TCA in the other annealing states,indicating that grains with TCC and TCD orientation show size advantage in the initial state(60min annealing),and thus it is not certain whether there is preferential growth during 60–190min annealing process.
For further study,the grain number fraction as a function of annealing time is present in Fig.7b.With annealing time increasing,the number fraction of TCA and TCB grains decreases while that of TCC and TCD grains increases,which indicates grains with the former two orientation are swallowed during the GG process.
Fig.7c shows the change in area fraction with annealing time of TCA-TCD grains.With annealing time increasing,the area fraction of TCA and TCB grains is decreased while that of TCC and TCD grains is increased which is consistent with the change of number fraction.Therefore,it is reasonable to say that two factors can be associated with the change tendency of area fraction.One is the change of number fraction and another is the preferential growth of TCC and TCD grains relative to TCA and TCB grains.If only the former has effects,assuming that all grains grow uniformly,the order of area fraction should be consistent with that of the number fraction among TCA-TCD at the initial(60min)and the final state(190min).However,the actual result is not like this.The number fraction of TCB grains is larger than that of TCC grains during the whole process whereas the area fraction of TCC grains is larger than that of TCB grains after 100min annealing,which indicates the faster growth of TCC grains than TCB grains and thus we can ensure the PGG of TCC grains during 60–190min annealing.In addition,it seems that TCD grains do not show obvious preferential growth based on the current results and they have limited effect on texture because of the low area percentage(Fig.7c).Thus it is not necessary to spend too much energy on TCD grains.

Fig.2.Quasi-in-situ(0002)PF sheets displaying textural evolution of cold-rolled ZG21 during annealing at 350 °C with various time:(a)60min,(b)65min,(c)75min,(d)85min,(e)100min,(f)130min,(g)190min.

Fig.3.Quasi-in-situ IPF maps and corresponding(0002)PF sheets of TCA(tilted 0–20° from ND)grains during annealing at 350 °C with various time:(a)60min,(b)65min,(c)75min,(d)85min,(e)100min,(f)130min,(g)190min.
Then the three texture changes mentioned in Section 3.1 can be explained.During the annealing process,TCC grains with 45–70° from ND grow preferentially leading to the increased texture pole angle.At the initial state,TCB grains have the highest area fraction so that the high-intensity area is concentrated mainly within 30–60°.However,with annealing time increasing,the area fraction of TCC grains increases up to near that of TCB grains until 85min annealing and thus the high-intensity area includes not only 20–45° but also 45–70° away from ND,which leads to the widen distribution of high-intensity area.During 85–190min,the area fraction of TCC grains is a little higher than that of TCB grains and thus the tilting angle of the texture increases to 50°.Considering that the pole intensity is a relative value,the area fraction change caused by faster growth of TCC grains can also explain the deceased texture intensity.
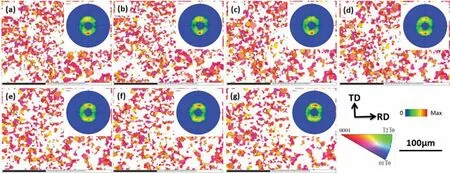
Fig.4.Quasi-in-situ IPF maps and corresponding(0002)PF sheets of TCB(tilted 20–45°from ND)grains during annealing at 350 °C with various time:(a)60min,(b)65min,(c)75min,(d)85min,(e)100min,(f)130min,(g)190min.

Fig.5.Quasi-in-situ IPF maps and corresponding(0002)PF sheets of TCC(tilted 45–70° from ND)grains during annealing at 350 °C with various time:(a)60min,(b)65min,(c)75min,(d)85min,(e)100min,(f)130min,(g)190min.
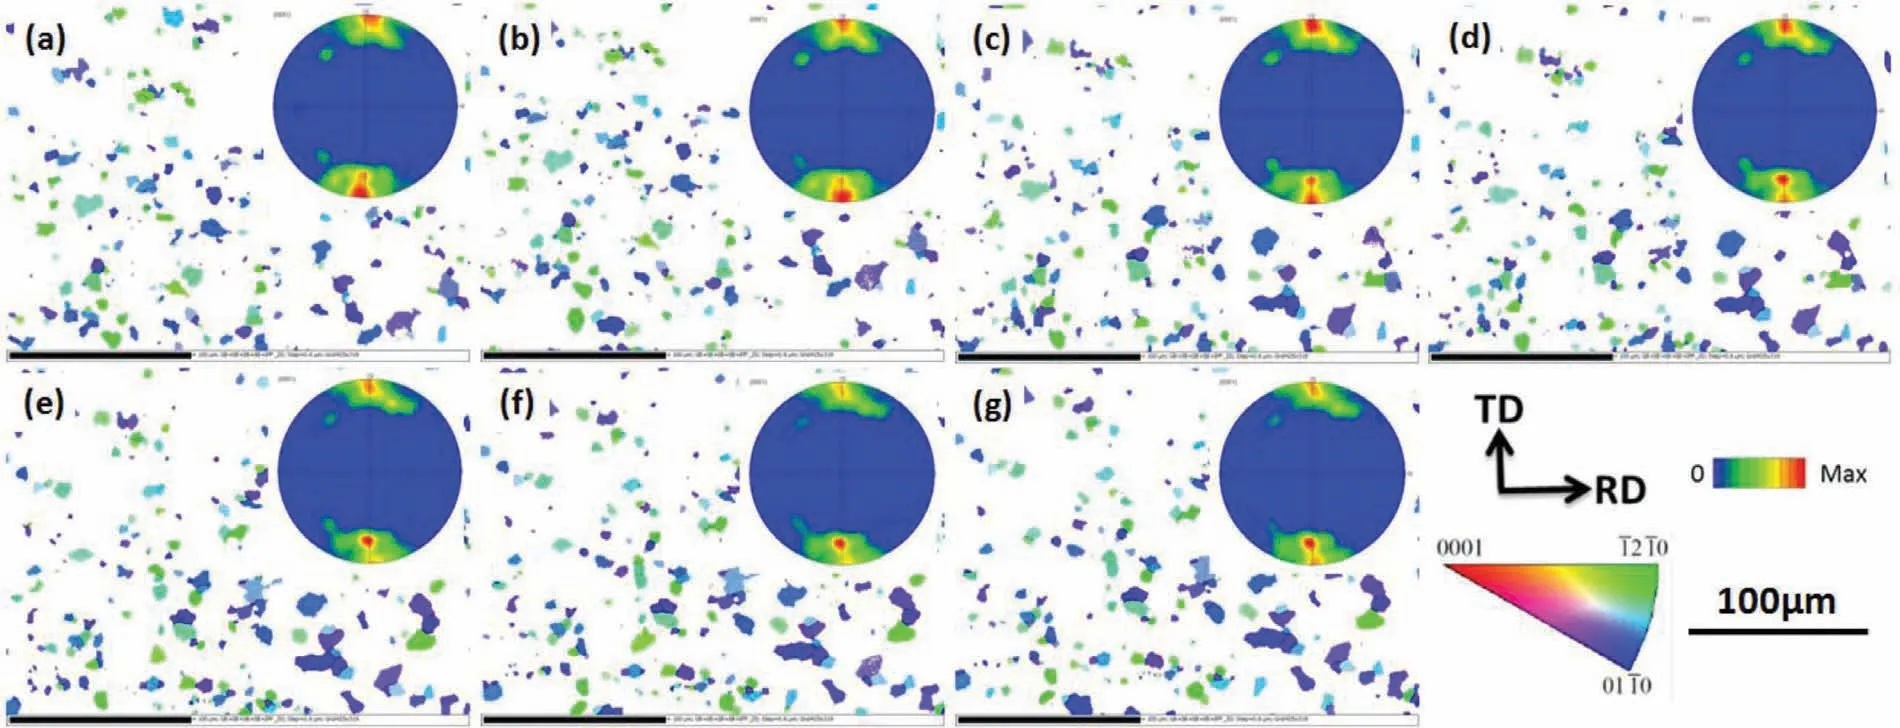
Fig.6.Quasi-in-situ IPF maps and corresponding(0002)PF sheets of TCD(tilted 70–90° from ND)grains during annealing at 350 °C with various time:(a)60min,(b)65min,(c)75min,(d)85min,(e)100min,(f)130min,(g)190min.

Fig.7.(a)Grain number fraction,(b)grain area fraction and(c)average grain diameter of each texture component as a function of annealing time..
4.Discussion
Considering that the PGG of TCC grains plays an important role in the texture evolution,it is necessary to give further study on it.As stated in theIntroduction,many factors associated with PGG were reported in papers.This section discusses possible reasons.
4.1.The size difference
Due to the curvature driven process during normal GG,the grain size difference can contribute to the phenomenon that larger grains will grow whereas smaller grains will shrink[20].Steiner et al.reported grains with{0001}[110]orientation grow faster than grains with{0001}[100]orientation in AZ31 and took the size advantage as the key reason[21].Basu et al.found that grains with non-basal orientation have a larger size than grains with basal orientation and thus believed that non-basal grains show advanced growth behavior[9]in Mg-1Gd alloy.In the current study,TCC grains are larger than TCB and TCA grains in the initial state(60min annealing)as shown in Fig.7a and thus it is reasonable to consider that the original size advantage is an important factor for faster growth of TCC grains during 60–190 min annealing.
4.2.The storage energy
Wu et al.[14]indicated that grains with[21]//ED orientation have the advantage to grow over[100]//ED grains and the kernel average misorientation(KAM)map was used to characterize the storage energy.The results show that DRX regions with high KAM value display[21]//ED orientation while DRX regions with low KAM value have mainly[100]//ED orientation.Therefore,the authors deemed that[21]//ED grains with low storage energy can grow toward[100]//ED grains with high energy.The results in Ref.[16]supported this criterion.A similar method to Ref.[14]is used to characterize the correlation between the storage energy and GG.The local misorientation(LocMis)maps which have the same meaning to KAM maps are used to characterize TCA-TCD grains at 85min annealing,as shown in Fig.8.If the above mentioned criterion works in this study,TCC grains should have the lowest LocMis value while other grains occupy higher LocMis value.However,the actual result is not like this-grains are almost always with low energy regardless of texture components(Fig.8).No direct relation can be established between PGG and the storage energy during 60–190min annealing.

Fig.8.The maps corresponding to LocMis value displaying storage energy in grains of different texture components:(a)TCA,(b)TCB,(c)TCC,(d)TCD after 85min annealing.
4.3.The property of GBs
The GG is essentially the process of GB migration.On one hand,the reduction in GB energy is the driving force and thus GBs with low energy tend to be reserved during growth based on simulation results[22].On the other hand,GG rate is closely related to the migration ability of GB[23].Some coincident site lattice(CSL)boundaries were studied to have high migration ability,such asΣ7(38.2°[111]),Σ13a(22.6°[100]),Σ13b(27.8°[111])andΣ17(28.1°[100])infccmetals(Al,Cu,Pb,et al.)as well asΣ13b(27.8°[111])andΣ19(26.5°[110])inbccmetals(Nb,Fe-Si,et al.)[28].As forhcpmetals,just like Mg,Zn,Cd,et al.,onlyΣ13(30°[0001])[29]was reported.
In order to investigate whether the misorientation angle does effect on the PGG of TCC grains or not,the GB misorientation distribution(GBMD)graphs of four types texture components TCA-TCD at 60,85 and 190min are provided in Fig.9(a–c)and GBMD of total grains is also given as a reference.The GBMD is quite different among TCA-TCD during the whole annealing process and thus it is reasonable to suppose that the misorientation affects the GG.Detailed characterization on GBMD of TCC grains is shown in Fig.9d.From 60 to 190 min annealing,the GB length fraction of the misorientation angles,including 20–30°,50–60°,60–70° and 70–80°,is increased which indicates GBs with these misorientation angles may migrate faster.
Fig.10 presents the quasi-in-situ GB migration process between grains with no obvious size difference during 85–130min annealing.On one hand,the obvious growth of grain 1 toward grain 2,3,4,7(85–100min),grain 13 toward 12,14(85–100min)and grain 15 toward 14(100–130min)are observed.On the other hand,GBs between grain 1,10(100–130min)and 4,16(85–130min)are relatively stable.From corresponding misorientations shown in Fig.10d,it is obvious to see the GB angles of the former are all distributed within while that of the latter(30–40°)are beyond the abovementioned fast migration angle range in Fig.9d,which is an evidence for our speculation in the previous paragraph.
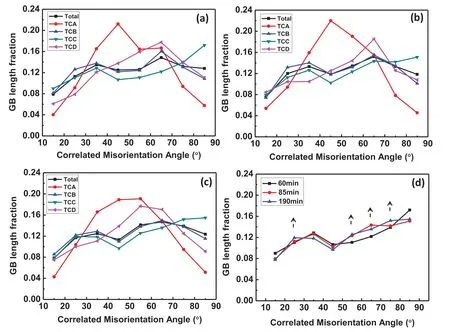
Fig.9.The GBMD among grains of different texture components at different annealing states:(a)60min,(b)85min,(c)100min,and(d)the GBMD change of TCC grains with annealing time increasing.

Fig.10.(a-c)The quasi-in-situ IPF maps displaying the growth between grains with no obvious size difference and(d)corresponding misorientation.

Fig.11.The misorientation axis distribution of(a-c)20–30°,(d-f)50–60°,(g-i)60–70° and(j-l)70–80° among different texture components(a,d,g,j)total,(b,e,h,k)TCC,(c,f,i,l)other(including TCA,TCB and TCD).

Table 1The possible near-CSL boundaries in Mg alloy(c/a=1.633)[29].
Comparing the misorientation axis corresponding to the misorientation angles favorable for migration between TCC grains and other grains(TCA,TCB and TCD)in Fig.11,the favorable axes[0001]for 20–30°,[20]and[70]for 50–60° and 60–70°,[20]and[100]for 70–80° among TCC grains are observed.Relative to other grains,the misorientation of TCC grains show preferred 50–60°[20],50–60°[70],60–70°[20],and 70–80°[100]boundaries.Aligning with the reported possible near-CSL boundaries in Mg alloy listed in Table 1[29],Σ10(70–80°[100])andΣ18b(60–70°[1210])may exist and have high migration ability.
4.4.The solute atoms segregation
The solute atoms segregation can have a drag effect on GB migration[15,30-32].PGG of basal grains was reported and attributed to the rapid migration of 30°[0001]GBs in commercial AZ31 alloys[12,29,33,34].With respect to AZ31 alloy,the grain growth was restricted in RE contained Mg alloys[1,35].Zeng et al.[24]speculated that solute atoms are prone to segregate into this special 30°[0001]GB and hinder its migration[16],and then suppress the growth advantage of basal grains,leading to relative PGG of non-basal grains.However,some simulation results indicated that RE solute atoms are preferentially segregated into high-energy GBs to reduce the GB anisotropy and resulting in uniform growth[17].That is,the solute atoms segregation can produce two effects.One is to inhibit GB migration and the other is to reduce GB energy.

Fig.12.The segregation on different GBs:(a)the STEM image of the grain boundaries GB1-GB6,(b-g)TEM-EDX results displaying the distribution of solute atoms along L1-L6,respectively.
In our study,the fraction of 30° GB in the GBMD at 60min annealing is small(Fig.9a),which is in agreement with the results in Ref.[36].TEM-EDX results of ZG21 annealed at 350 °C for 1h(Fig.12)presents the segregation of solute atoms on the GB(Fig.12c,GB2)and this segregation is Zn/Gd co-segregation.The co-segregation result of Zn/Ca was reported previously[24]and can produce a stronger drag force.Based on the above two results,the mentioned speculation in the previous paragraph reported in Ref.[24]can also be used to explain the growth advantage of grains with nonbasal orientation(i.e.TCB,TCC and TCD)in ZG21 alloy but can not explain the PGG of TCC grains during annealing for 60–190min.
However,an interesting phenomenon is displayed in our TEM-EDX results-some GBs(GB1 and GB6 in Fig 12a)show no segregation(Fig.12(a,g))and even if there is segregation,the degree of segregation is not the same(by comparing the segregation of GB2,GB3,GB4 and GB5 in Fig.12(cf),respectively).Although no specific information of misorientation is given,it is reasonable to speculate that the high mobility of GBs mentioned in Section 4.3 may be related to their disadvantage to the solute atoms segregation.
Conclusions
The grain growth process,including microstructural and micro-textural evolution,of cold-rolled ZG21 was tracked by quasi-in-situ EBSD method during static recrystallization(SRX)annealing at 350 °C for 60–190min.The influence of PGG on textural evolution and the reasonable factors for PGG are discussed.
1.This annealing process presents the normal grain growth during SRX.The TD-split texture in the initial state maintains the texture type but changes in three aspects-the increased tilting angle,the decreased pole intensity and widened distribution of high-intensity area.
2.Grains with c axes tilting 45–70° from ND show PGG according to the comprehensive results including the change of average grain size,number fraction and area fraction with annealing time increasing.Moreover,this PGG is the key factor for the above three texture changes.
3.The effect of size difference,storage energy,GB property and solute atoms segregation on PGG is discussed.The original size advantage plays an important role in PGG.Moreover,some special GBs,such as 50–60°[20],50–60°[70],60–70°[20](Σ18b),and 70–80°[1010](Σ10)show preferred distribution in grains with growth advantage and may lead to the PGG because of their high migration ability and the absence of solute atoms segregation.
Declaration of Competing Interest
The authors declare that they have no known competing financial interests or personal relationships that could have appeared to influence the work reported in this paper.
Acknowledgments
The authors gratefully acknowledge the financial supports from the National Natural Science Foundation of China(NSFC,No.51601193),State Key Program of National Natural Science of China(No.51531002),National Key Research and Development Program of China(No.2016YFB0301104),National Basic Research Program of China(973 Program,No.2013CB632202).
 Journal of Magnesium and Alloys2021年3期
- Journal of Magnesium and Alloys的其它文章
- Modifying microstructures and tensile properties of Mg-Sm based alloy via extrusion ratio
- The effects of Ca and Mn on the microstructure,texture and mechanical properties of Mg-4 Zn alloy
- H2 generation kinetics/thermodynamics and hydrolysis mechanism of high-performance La-doped Mg-Ni alloys in NaCl solution—A large-scale and quick strategy to get hydrogen
- The slip activity during the transition from elastic to plastic tensile deformation of the Mg-Al-Mn sheet
- Rotational and translational domains of beta precipitate in aged binary Mg−Ce alloys
- Does acid pickling of Mg-Ca alloy enhance biomineralization?