
Super Resolution Sensing Technique for Distributed Resource Monitoring on Edge Clouds
2021-10-26 08:36:30YANGHanCHENXuZHOUZhi
ZTE Communications 2021年3期
YANG Han,CHEN Xu,ZHOU Zhi
(Sun Yat-Sen University,Guangzhou 510275,China)
Abstract:With the vigorous development of mobile networks,the number of devices at the network edge is growing rapidly and the massive amount of data generated by the devices brings a huge challenge of response latency and communication burden.Existing resource monitoring systems are widely deployed in cloud data centers,but it is difficult for traditional resource monitoring solutions to handle the massive data generated by thousands of edge devices.To address these challenges,we propose a super resolution sensing(SRS)method for distributed resource monitoring,which can be used to recover reliable and accurate high-frequency data from low-frequency sampled resource monitoring data.Experiments based on the proposed SRS model are also conducted and the experimental results show that it can effectively reduce the errors generated when recovering low-frequency monitoring data to high-frequency data,and verify the effectiveness and practical value of applying SRS method for resource monitoring on edge clouds.
Keywords:edge clouds;super resolution sensing;distributed resource monitoring
1 Introduction
I n recent decades,with the advent of the era of Internet of Things and the rapid development of mobile networks,the number of edge devices and the number of data generated at the edge have been growing exponentially,leading to higher and higher requirements for network bandwidth.At the same time,driving modern intelligent mobile applications,deep learning has attracted much attention from scientists and IT enterprises.New applications based on deep neural networks have achieved great success in computer vision,speech recognition,natural language processing and intelligent robots.Although complex computing tasks are completed and reliable and accurate results are obtained,the massive data generated by these new applications will put forward higher requirements on network bandwidth and time delay.According to IDC’s prediction,the global data volume would be more than 40 ZB before 2020,and the data generated at the edge will account for 45%of the total[1].In new edge cloud scenarios,the traditional cloud computing technologies are difficult to process the billion-scale data generated by edge devices[2],and only using the strong computing power and storage resources of the cloud data center to solve the computation and storage problems can no longer adapt to the needs of the new era,because it has two main shortcomings:high latency and bandwidth limitation.The latency requirements of deep learning-based applications at the edge are very high.Such an application needs to transfer the data to the cloud and the data will be processed and then returned to the device side,which may significantly increase the processing delay of the application.For example,a car running at a high speed has millisecond-level delay requirements,but if the processing delay of the application increases due to the change of network conditions,the consequences will be unimaginable.Besides,affected by the edge device resource limitations,the data generated by the device will be transmitted to the cloud in real time;for example,the amount of data generated by the aircraft per second will exceed 5 GB[3].However,the bandwidth limitations prevent this real-time transmission in edge cloud scenarios.
In recent years,with the development of cloud computing,virtualization and containerization technologies,companies such as eBay,Facebook,Google and Microsoft have made a lot of investment in large-scale data centers supporting cloud services[4].Servers are the core part of data centers and monitoring server resources aims to guarantee the smooth operation of data centers.At present,resource monitoring is one of the key technologies to support cloud computing platforms,which mainly includes cloud resource management,fault analysis,resource scheduling,statistical analysis and anomaly warning.The existing resource monitoring system is widely deployed in cloud data centers,but with the increasing of edge devices,resources need to be monitored on edge clouds.A large number of resource monitoring data will make the network bandwidth a bottleneck affecting system performance,but these high-frequency resource data are the basis for the monitoring system to conduct reliable and accurate early warning.
The traditional solutions to recovering low-frequency resource monitoring data into high-frequency data include linear interpolation,cubic interpolation and compressed sensingbased methods[5].However,with the rapid development of deep learning technology,the traditional methods have two obvious shortcomings.One is that they need to either collect the original high-frequency data at the edge device end or consume additional computing power to calculate the low-frequency monitoring data,and then upload the data to the cloud,which will obviously increase the computing cost of the edge device.The other one is that the accuracy of high-frequency monitoring data recovered by the reconstruction algorithm based on the traditional methods cannot meet the needs of some online services;however,with the increasing number of online services in cloud data centers,the accuracy of high-frequency monitoring data is greatly important.
To tackle the challenges discussed above,novel methods are needed to support high-frequency sensing of monitoring systems on edge clouds.In this paper,we achieve this goal by applying the super resolution sensing(SRS)technology.The SRS technology based on deep learning is used to avoid collecting original high-frequency data at the edge device and reduce unnecessary calculation cost.It only involves low-frequency data at the transmission and storage stage of monitoring data and information reconstruction can be carried out by using this technology only when high-frequency data with high precision is needed,which can significantly reduce the cost of calculation and communication.The proposed SRS process is mainly divided into three stages:feature extraction,relationship mapping and information recovery.The feature extraction module is used to obtain the intrinsic features of the low-frequency data,followed by a gated recurrent unit network based on the attention mechanism to find the potential relationship between the low-frequency data and the high-frequency data in the relationship mapping stage,and finally,the high-frequency surveillance data are recovered based on the learned feature information in the information recovery stage.
The rest of the paper is organized as follows.We briefly review the related work in Section 2.We propose an SRS system for resource monitoring and present its network structure in Section 3.Then we demonstrate the effectiveness of the proposed approach by simulations in Section 4.Finally,we provide conclusions and some future work directions in Section 5.
2 Related Work
At present,super-resolution sensing techniques can be broadly classified into three categories:interpolation,reconstruction,and deep learning-based reconstruction methods.
The interpolation-based methods are mainly based on the relationship between the values of neighboring pixel points in the image and the positions of other pixel points around them,and the missing values of the pixel points on the high-resolution image are complemented by interpolation,and finally the high-resolution image is recovered by noise reduction and deblurring.The common interpolation-based methods include nearest neighbor interpolation,bilinear interpolation based on wavelet domain[6]and cubic interpolation[7].On this basis,some researchers have further proposed interpolation based on gradient features,interpolation based on image features,etc.The interpolation based on bilateral filter proposed by TOMASI et al.[8]uses bilateral filtering as a constraint term to reduce the edge noise generated by the reconstructed image.To further reduce the effects of blurring and ringing in the recovered images,LI et al.[9]proposed an interpolation algorithm based on edge orientation,which uses a geometric pairwise method to interpolate the specified edge regions and highly textured regions in the image orientation,thus significantly improving the quality of image reconstruction.To reduce the artifacts in the recovered image,BELAHMIDI et al.[10]introduced partial differential equations and data fidelity for directional interpolation of edges,but the effectiveness of these algorithms is affected by the edge regions.Therefore,adaptive interpolation algorithms based on texture partitioning have also been proposed by some researchers[11].
Although the interpolation-based method is simple,it fails to introduce any priori knowledge and its information recovery capability is insufficient.Therefore,a reconstruction-based reconstruction method is used,which is more concerned with the image degradation itself than the interpolation method.STARK and OSKOUI proposed the convex set projection method[12],which,based on the set theory,first defines a set of convex constraint sets for the solution space of the image and seeks the points that satisfy all the conditions of the constrained convex sets by stepwise iteration to complete the reconstruction of the high-resolution image.Another typical algorithm is the maximum a posteriori(MAP)probability estimation method[13–15],a method proposed based on probability statistics,which treats the known low-resolution image and the high-resolution image to be recovered as two independent stochastic processes,and requires the design of a reasonable statistical prior model to maximize the posterior probability of image recovery after reconstruction.It has the advantages of direct incorporation of a priori constraints,high convergence stability and strong noise reduction capability,but the disadvantages are large computational effort and slow convergence speed.Another common reconstruction-based method is the iterative back-projection method[16],which back-projects the error between the degraded image and the low-resolution image of the reconstructed image and uses this error to correct the current reconstructed image.A super-resolution sensing method based on maximum likelihood estimation and convex set projection was proposed later[17],which makes full use of the prior knowledge and possesses good convergence stability.
With the continuous improvement of computer computing power,deep learning has become a popular topic for many researchers and scholars,and the application of neural networks in the field of image and signal processing has become a new development trend.Convolutional neural networks(CNN)have become a representative structure in the field of computer vision after KRIZHEVSKY et al.[18]applied CNN to image classification and achieved amazing results in 2012.In 2014,DONG et al.[19]first used CNN for super-resolution sensing of images and proposed a CNN-based super-resolution reconstruction network(SRCNN),which learns the features from low-resolution images to high-resolution images by pre-processing the input low-resolution images with linear interpolation and then recovering the high-resolution images through feature extraction,nonlinear mapping and image reconstruction.This model learns the feature mapping relationship from low-resolution images to high-resolution images,which is the pioneer of super-resolution image reconstruction based on deep learning,and has a great improvement in the quality of recovered images compared with traditional methods.In 2016,DONG et al.[20]proposed the faster SRCNN(FSRCNN),which eliminates the interpolation preprocessing step,takes the lowresolution image as the input of the model directly,and uses the deconvolution operation to enlarge the feature map at the end,which greatly reduces the computation of the model and accelerates the operation speed.Subsequently,SHI et al.[21]proposed an efficient sub-pixel convolutional neural network(ESPCN),which uses sub-pixel convolution layers instead of deconvolution to scale up the learned feature maps,further reducing the computational effort of the model and providing better image recovery quality compared with FSRCNN.Later,with the emergence of the residual network and the recurrent neural network(RNN),KIM et al.successively proposed the deeply-recursive convolution network(DRCN)[22]and very deep super resolution(VDSR)[23]models.The DRCN utilizes a recursive approach to share the parameters of the network layers and reduce the number of parameters of the model,while the VDSR model utilizes the global jump connection property of the residual structure to connect the input layer for better image recovery quality.LEDIG et al.[24]proposed super resolution residual network(SRResNet),a super-resolution sensing algorithm based on deep residual networks,which adds multiple modules for local residual learning and increases the number of layers of the network to learn more low-resolution to high-resolution feature mapping information,and achieves further improvement in the quality of image recovery.With the popularity of generative adversarial networks (GAN)[25],LEDIG also proposed the super resolution generative adversarial network(SRGAN)model with the main improvement of changing the loss function to adversarial loss and content loss,which can better recover the texture details of images.LIM et al.[26]proposed enhanced deep super resolution model(EDSR)based on SRResNet in 2017,the batch normalization layer in the model was removed,the network parameters were reduced,and it was applied to scenes with multi-scale recovery of low-resolution images.
3 Super Resolution Sensing for Resource Monitoring on Edge Clouds
3.1 System Model
At present,super-resolution sensing technology is mostly applied in the field of image and video processing,which can reconstruct low-resolution images into high-resolution images by deep learning methods and has great improvement in accuracy compared with traditional methods,but it is rarely applied to the reconstruction of low-frequency time series.Inspired by this,this paper proposes a super-resolution sensing algorithm for resource monitoring.
Fig.1 shows the framework of the algorithm on edge clouds.It can be seen that there are three main phases included in the edge cloud application scenario,which are the data acquisition phase,offline training phase and online recovery phase.First,in the data collection phase,low-frequency and high-frequency monitoring data,which can be CPU utilization,memory usage or bandwidth status,need to be collected from each edge device side in a distributed manner and then received and stored uniformly by the cloud proxy server after the collection is completed.Then,in the offline training phase,the collected low-frequency and high-frequency resource data are used to train the corresponding SRS models,which are responsible for information reconstruction tasks with different sensing factors,such as super resolution sensing models with sensing factors of 2,5,and 10.Once the training is completed,the trained models can be packaged into containers to be deployed as online services in the resource monitoring system in the cloud.Finally,the online recovery phase is to recover the reliable and accurate high-frequency data from the low-frequency data collected at the edge device side through the trained super-resolution sensing model,and the resource monitoring system will select the model with the appropriate sensing factors for recovery when and only when high-frequency data is needed,which can significantly reduce the communication and storage cost of resource data.
3.2 SRS Network Structure
Based on the attention mechanism and gate recurrent unit(GRU)network,this paper proposes a super-resolution sensing model for resource monitoring,which can extract feature information after inputting low-frequency data,reconstruct high-frequency information through relational mapping,and finally recover the corresponding high-frequency signal.The specific model structure is shown in Fig.2.This super-resolution sensing model is mainly divided into three stages:the feature extraction,relational mapping and information recovery.In the feature extraction stage,multiple one-dimensional convolutional layers act as global feature extractors of low-frequency information to extract abstract features of the input signal and represent them as feature vectors.And the relational mapping layer consists of a series of GRU network blocks dual-attention GRU(DAGRU)based on the temporal attention mechanism and feature attention mechanism,in which global residual blocks and local residual blocks are also added.The sub-network composed of many DAGRU blocks can effectively learn the intrinsic connection between low-frequency information and high-frequency information,and the information lost by low-frequency information can be made up by relational mapping.Finally,in the information recovery stage,the information inferred by the relationship mapping layer is passed through the convolutional layer for feature extraction of potential relationships,while the feature map dimension is reconstructed,and then the low-frequency information is reconstructed into the high-frequency information corresponding to the sensing factors by multiple sub-pixel convolutional layers,followed by the recovery of the complete high-frequency resource monitoring information using the fully connected layer.

▲Figure 2.The proposed super-resolution sensing network structure
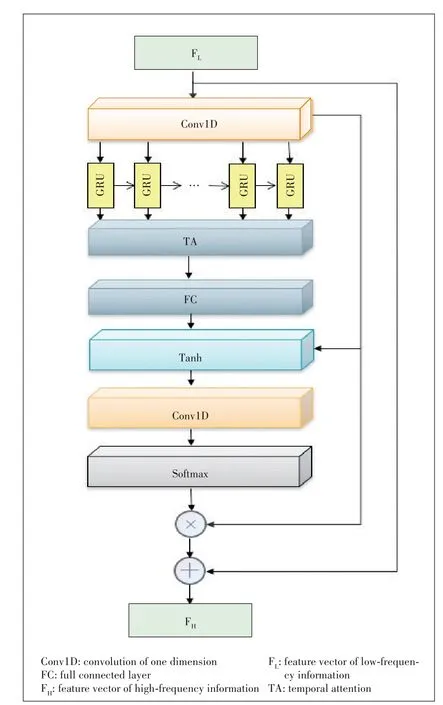
The most important part of the super-resolution sensing model proposed in this paper is the relational mapping layer and the feature information FLobtained from the low-frequency resource signal through the feature extraction layer is used as input,which can complete the missing information of the feature vector in the low-frequency data after the relational inference by multiple DAGRU networks.As a variant of recurrent neural network,GRU can solve the problem of gradient disappearance and explosion than the standard RNN structure and can extract long-term dependencies in temporal sequences.It requires less computational resources,has fewer model parameters and has good convergence than the widely popular LSTM unit.Therefore,in this paper,GRU is used as a basic unit in the relational mapping layer and the DAGRU network is designed by combining the attention mechanism(Fig.3).
The attention mechanism can be basically divided into hard attention mechanism and soft attention mechanism according to the degree of attention to important regions.The hard attention mechanism refers to the targeted selection of some features in the input information for learning while directly ignoring other unselected features.It can be implemented in two ways.One is to select input information with the highest frequency and the other can be obtained by performing random sampling on the attention distribution.Hard attention can greatly reduce the size of the parameters in a neural network and lower the requirement for computational resources by learning only some of the key regions and discarding other irrelevant information.However,it is usually based on random sampling to determine the input information,so it leads to a non-derivable relationship between the attention distribution and the loss function.Therefore,it is difficult to optimize the loss function by back-propagation methods.On the other hand,the soft attention mechanism can be used to learn the overall features according to the importance of different regions in the information by using weighted averaging without directly discarding some irrelevant regions,and the degree of each region being attended to can be expressed by a value between 0 and 1.Therefore,it is a microscopic process,which can be used in the training of neural networks by forward propagation to perform relational mapping and back propagation to perform parameter optimization.Based on the soft attention mechanism,in this paper,two attention mechanisms are designed in the DAGRU sub-network,which are the temporal attention mechanism(TA)and the feature attention mechanism.
▲Figure 3.Structure of dual-attention gate recurrent unit(DAGRU network based on attention mechanism)
Since the fluctuation of resource monitoring information is affected by the historical state,GRU network can be used to extract long-term dependencies,but this is not enough to meet the requirements for the accuracy of the trained model.After the analysis of some monitoring resource sequences,it is found that,for example,CPU utilization may rise suddenly in a period of time due to the sudden need to deal with computationally intensive tasks.This shows that the degree of influence of each historical moment on the current moment state is different,so a temporal attention mechanism is added on the basis of GRU network,which can adaptively decide the degree of influence of historical moments on the current moment information.The specific structure is shown in Fig.4.
The hidden layer state valuesh icontaining information about the historical moments are taken as inputs in Fig.4 andi∈[1,t-1].Their degrees of influence on the current momenth tare analyzed,which can be achieved by the scoring mechanism,and the scoring functionfis in the form of a dot product as follows:


▲Figure 4.Temporal attention mechanism
whereWis a weight matrix about the hidden values of the historical states,followed by a softmax function to find the degree of influence of each historical moment on the current moment defined asαiwith the following formula:

Then,according to the derived attention distributionαi,a weighted average is done for each inputh i,and the input information is encoded to obtain the context vectorc tdescribed by the formula:

After obtaining the context vectorc t,the final state valueatis obtained with the hidden layer state valueh tby an additive model and by the tanh activation function with the following formula:

It can be seen from the above equations that the temporal attention mechanism of the hidden layer states in the GRU unit can determine the degrees of correlation of historical state values at different moments.Combined with the current moment state values,this mechanism enables a kind of adaptive extraction of long-term dependency features,which can effectively suppress the less influential historical state values and help improve the quality of the recovered signal.
4 Evaluation
To verify the effectiveness of the super-resolution model for resource monitoring proposed in this paper,we select the 2018 cluster resource dataset named cluster-trace-v2018 publicly available from Alibaba Group,which contains resource monitoring information of about 4 000 servers over eight days.
4.1 Quantitative Comparison
In order to study the characteristics and effectiveness of the proposed SRS method,we conduct experiments using three metrics:the mean absolute percentage error(MAPE),peak signal to noise ratio(PSNR)and dynamic time warping(DTW)[27].MAPE is commonly used to measure the temporal similarity of different time series and a higher MAPE value means a larger difference between the true value and the recovery value.PSNR represents the ratio of the maximum power of the signal to the average power of noise and a higher PSNR value indicates that the recovery value contains a smaller noise.DTW distance is a popular metric to obtain an optimal alignment that can be used to measure the similarity of shape features,which can be relatively robust to interference factors.We compare our SRS method with traditional upsampling methods including the linear interpolation,cubic interpolation,and compressive sampling matching pursuit(CoSaMP)[28]based on compressed sensing(CS).The quantitative comparison results between SRS and the other methods are shown in Table 1.It is obvious that the proposed SRS method is significantly better than other methods in different frequencies.From the perspective of DTW distances,the results of the SRS method are smaller than the results obtained by the other methods,which demonstrates that the proposed SRS method can effectively recover the shape characteristics of high-frequency resource data.
4.2 Qualitative Comparison
Figs.5 and 6 show the qualitative comparison results.For each visualization result,it is obvious that the interpolation and compressed sensing methods cannot recover the missing details in the high-frequency data,resulting in the loss of information during the degradation process.Compared with the proposed SRS method,the other methods can only recover the rough shape of waveform,which is difficult to restore the peak values of the resource information.The proposed SRS method can effectively recover the shape of waveforms and peak value of high-frequency resource information.

▼Table 1.Comparison results attained by SRS and other methods
4.3 Analysis of Latency Under Dynamic Bandwidth
The delay variations of different algorithms under dynamic bandwidth environment with certain recovery accuracy are shown in Fig.7.It can be seen that the super-resolution sensing model proposed in this paper can reduce the delay requirement of sending monitoring data from the edge to the cloud by allowing the edge devices to collect resources at a lower frequency and guaranteeing certain recovery accuracy at a lower bandwidth.In addition,along with the increase of bandwidth,the delay variation is basically in a smooth state while the other methods will generate higher delay on low-bandwidth network.
5 Conclusions and Future Work
With the advent of the IoT era,computing power has started to gradually move from the cloud down to the edge and the traditional cloud computing models are quietly changing.The emergence of thousands of edge devices will greatly share the pressure of cloud computing,so it is also necessary to provide a perfect resource monitoring scheme for the new edge cloud scenario.However,the existing resource monitoring schemes basically serve the cloud data center and there is no need to consider the computational overhead and bandwidth cost when collecting the resource monitoring data.Therefore,this paper proposes a super-resolution sensing model for resource monitoring by studying the existing signal reconstruction techniques including compressed sensing and super-resolution sensing for the edge cloud application scenario,which is mainly divided into three structures:the feature extraction layer,the relationship mapping layer and the information recovery layer.In the feature extraction layer,the low-frequency resource monitoring information is extracted by three-layer onedimensional convolution.Then in the relationship mapping phase,the mapping relationship between low-frequency data and high-frequency data is mined by a GRU network based on the temporal attention mechanism and feature attention mechanism,which is used as the input of the information recovery layer.Finally,the low-frequency feature information is reconstructed into reliable and accurate high-frequency information in the multi-scale sub-pixel convolution layer.
Aiming at meeting the requirement of real-time monitoring,the super-resolution sensing technique for resource monitoring proposed in this paper reduces the amount of transmitted resource data by reducing the sampling frequency at the edge devices.Due to the limitation of the experimental environment,a finite number of edge devices are used in our experiments,and subsequent studies can be migrated to larger edge clusters for future experiments.In addition,in the dynamic bandwidth environment,the data acquisition module can be allowed to adjust the acquisition frequency adaptively to collect monitoring resources,and the super-resolution sensing model with corresponding sensing factors can be trained in the cloud to increase the robustness of real-time resource monitoring by adjusting the sensing factors.In addition,only a single type of resource information is used to train the model in this paper,and subsequent research can also analyze the similarity of different types of resource information to collaborate the recovery process from lowfrequency data to high-frequency data,which can also effectively improve the quality of resource information recovery and the generalization ability of the SRS model.
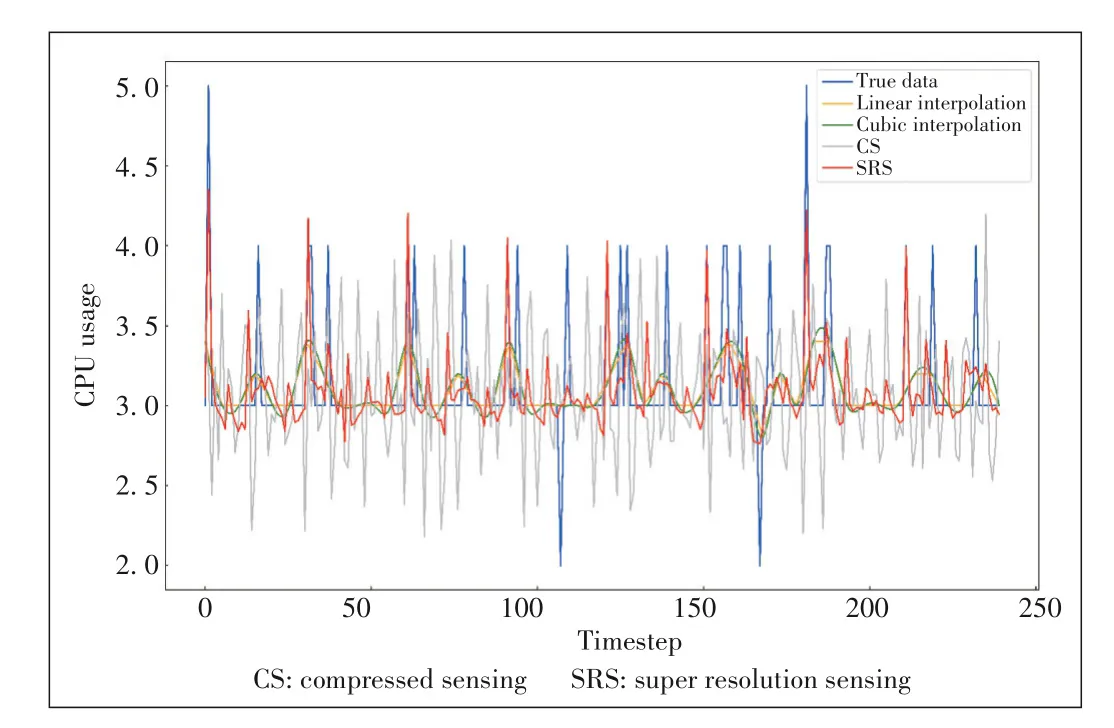
▲Figure 5.SRS results of the experiment with fl=1/50 Hz and fh=1/10 Hz

▲Figure 6.SRS results of the experiment with fl=1/200 Hz and fh=1/20 Hz
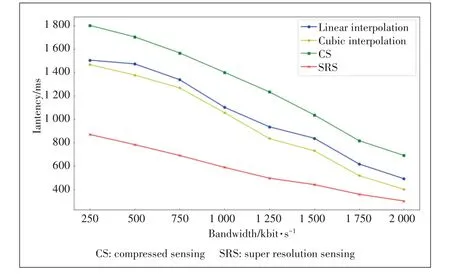
▲Figure 7.Results of latency under dynamic bandwidth obtained by SRS and other methods

- ZTE Communications的其它文章
- ZTE Communications Guidelines for Authors
- Editorial:SpecialTopic on Wireless Intelligence for Behavior Sensing and Recognition
- Feedback-Aware Anomaly Detection Through Logs for Large-Scale Software Systems
- Semiconductor OpticalAmplifier and Gain Chip Used in Wavelength Tunable Lasers
- QoE Management for 5G New Radio
- A Survey of Intelligent Sensing Technologies in Autonomous Driving