Spectroscopic and Fluorescence Studies on the Trivalent Ce, Eu, Nd and La Metal Ions Rhodamine C Florescent Dye Complexes
Moamen S. Refat, Mahmoud Salman, Akram M. El-Didamony, Hammad Fetooh,Eman S.E. Abd El-Maksoud, Mohamed Y. El-Sayed,4
1. Department of Chemistry, College of Science, Taif University, P.O. Box 11099, Taif 21944, Saudi Arabia 2. Department of Chemistry, Faculty of Science, Al-Hussein Bin Talal University, P.O. Box 20 Ma’an, Jordan 3. Department of Chemistry, Faculty of Science, Zagazig University, Egypt 4. Chemistry Department, College of Science, Jouf University, P.O. Box: 2014 Sakaka, Saudi Arabia
Abstract The four isolates solid complexes: [La(RHC)(NO3)2]·3H2O, [Nd(RHC)(NO3)2]·4H2O, [Eu(RHC)(NO3)2]·2H2O, and [Ce(RHC)(NO3)2]·5H2O that obtained by the reaction of the nitrate salts of the Ce(Ⅲ), Eu(Ⅲ), Nd(Ⅲ) and La(Ⅲ) ions and rhodamie C (RHC) ligand were interpretative using elemental analysis (C, H and N), molar conductivity, infrared, electronic, fluorescence and 1H-NMR spectra to achieve the speculated suitable formula. The low molar conductance values of the synthesized RHC complexes concluded the non-electrolytic behavior. The infrared spectra recorded the absence of stretching vibration ν(OH) of the —COOH and presence of two new vibration bands at 1 597~1 601 and 1 383~1 399 cm-1 which were assigned to νas(COO-) and νs(COO-). The difference between them revealed that the carboxylate group acts as a bidentate ligand. 1HNMR spectra of Europium and lanthanum(Ⅲ) complexes were supported the FTIR results based on the absent of proton of the carboxylic group. Therefore, the microanalytical and spectroscopic results deduced that RHC acts as a monobasic bidentate ligand, and coordinated to the central metal(Ⅲ) ions via the two oxygen atoms of deprotonated carboxylic group. Fluorescence studies were performed on the metal complexes of Ce3+, Tb3+, Th4+, Gd3+ and La3+, that referred a quenching in the fluorescene intensity of rhodamine C in the aqueous state after complexation. The antimicrobial assessment against some kind of bacteria and fungi were also checked and recorded enhancement in case of their complexes.
Keywords Rhodamine C; Chelation; Spectroscopic; Thermogravimetric; Lanthanides
Introduction
Laser dyes are very versatile[1]. Owing to the high fluorescence quantum yield, broad fluorescence in the visible region, and high absorption coefficient of rhodamine dyes, they are widely used as fluorescent probes[2]. Fluorescents are basic for researches in the clinical diagnosis of diseases, the assurance of food safety, environmental quality, the development of new drugs, and in the biological science[3-4].
Many researchers have prepared and designed several derivatives used as rhodamine-labeled oligonucleotides[5], probe in a biological environment[6], fluorescent peptides[7], induces, inhibitors[8]and protease substrates[9]. Rhodamine dyes are used in many applications including spectroscopy, medicine, analysis, biophysical probes, and chemical sensors[10-14]. Refat et al.,[15]had designed and synthesized complexes of rhodamine 640 perchlorate and rhodamine C with Cu(Ⅱ), Co(Ⅱ) and Mn(Ⅱ) ions to learn more about the thermal stability of these dyes compared with their metal complexes. The present work amid to learn more about the structural, spectral and antimicrobial properties of rhodamine C and its Ce(Ⅲ), Eu(Ⅲ), Nd(Ⅲ) and La(Ⅲ) metal chelates.
1 Experimental
1.1 Instrumental analyses
Rhodamine C (Fig.1) was purchased from Aldrich Company. Melting points were determined on a digital apparatus. The elemental analysis of C, N, and H were carried out with a Perkin-Elmer CHN 2400. Molar conductivities of solutions in SMSO solvent (10-3mol·L-1) were determined with a Jenway 4010 conductivity meter. The electronic absorption spectra of solutions in DMSO solvent (10-3mol·L-1) were measured with a Jenway 6405 spectrophotometer in the range 200~800 nm using 1 cm quartz cell. The infrared spectra of the products were collected on a Brüker FT-IR spectrophotometer within the range of 4 000~400 cm-1using KBr discs.1H NMR spectra were obtained using a Varian Gemini 200 MHz spectrometer at room temperature using tetramethylsilane (TMS) as the internal reference and dimethylsulfoxide, d6 (DMSO-d6) as the solvent. The metal content was obtained gravimetrically by converting the metal complexes to their corresponding metal oxides.
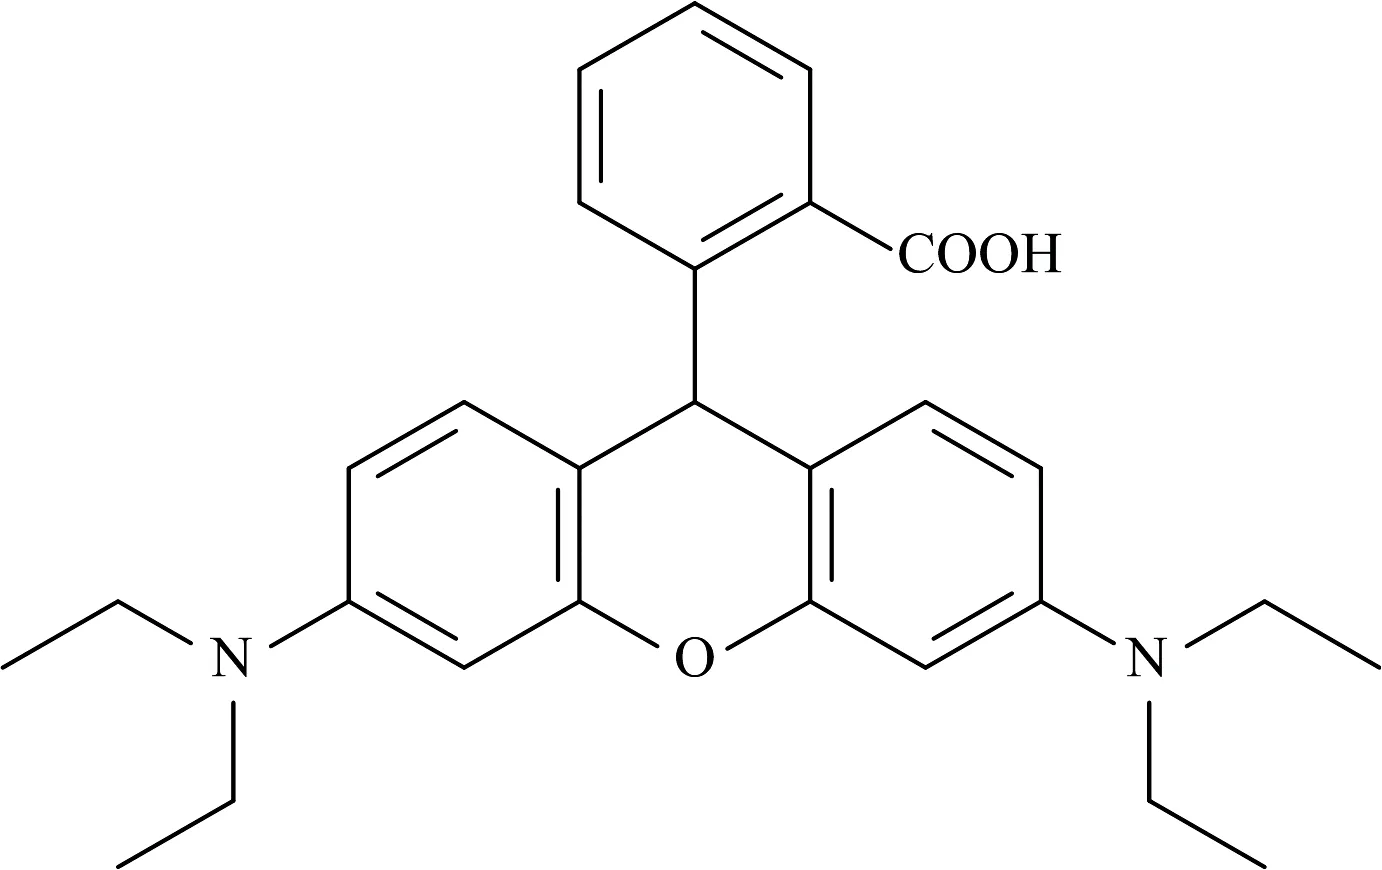
Fig.1 Structure of Rhodamine C (RHC)
1.2 Microbiological investigation
The isolates of fungi and bacteria were seeded in tubes containing nutrient Dox’s broth (DB) and broth (NB), respectively. One ml of the seeded (DB) for fungi was homogenized in a tube containing 9 mL of melted nutrient agar (DA) at 45 ℃, while 1 mL of the seeded (NB) for bacteria was homogenized in a tube containing 9 mL of melted nutrient agar (NA) at 45 ℃. The resultant suspensions were poured into Petri dishes, and the dishes were left to cool. After cooling, holes with a diameter of 0.5 cm were done, then 100 μL of the investigated complexes were added to these holes using a micropipette. The dishes were incubated in an incubator at 28 ℃ for fungi and 37 ℃ for bacteria for 24 hours. Diameters of the inhibition zone were obtained and expressed in cm. The antimicrobial activities of the investigated metal complexes as well as the pure solvent as a blank test were tested against two kinds of fungi;AspergillusnigerandPenicilliumrotatum, and two kinds of bacteria;EscherichiaColias (Gram -ve) andBacillussubtilisas (Gram +ve).
1.3 Syntheses
The Ce(Ⅲ), Eu(Ⅲ), Nd(Ⅲ) and La(Ⅲ) nitrates (1 mmol) were dissolved in 10 mL 99% methyl alcohol A.R. The nitrate solutions were added slowly to a solution containing 1 mmol of RHC in 20 ml methyl alcohol. The pH was adjusted at pH 7~9 using 0.1 mol·L-1NH4OH solution. The mixtures were stirred on a magnetic stirrer with refluxing at 60~70 ℃ for one 60 minutes. Then, the mixtures were left to evaporate slowly at room temperature to produce the products. The formed products were filtered off, washed with hot solvent several times to obtain pure products, and dried under vacuum over anhydrous CaCl2.
2 Results and discussion
2.1 Molar conductivity
The formation mechanism of RHC complexes can be summarized as following: M(NO3)3·nH2O+RHC(HL)+NH4OH→[M(L)(NO3)2]·nH2O+NH4NO3+nH2O(where, M=Eu(Ⅲ), La(Ⅲ), Nd(Ⅲ) and Ce(Ⅲ);n=2, 3, 4 and 5, respectively).
Values of the molar conductivity for the Ce(Ⅲ), Eu(Ⅲ), Nd(Ⅲ) and La(Ⅲ) complexes of rhodamine C in DMSO solvent (10-3mol·L-1) are listed in Table 1. The values are in the range from 9 to 19 Ω-1·cm2·mol-1, which indicate the synthesized complexes are non-electrolytes[16-17].
2.2 IR spectral studies


Table 1 Elemental and physical data of Rhodamine C metal complexes

Table 2 IR Frequencies of RHC and the Ce(Ⅲ), Eu(Ⅲ), Nd(Ⅲ), and La(Ⅲ) complexes
2.3 Electronic absorption spectra
The complexes exhibit two characteristics absorption peaks at the ranges 350~500 and 215~340 nm, which are attributed ton—π*andπ—π*transitions of the organic rhodamine C moiety, respectively. The synthesized complexes exhibit a bathochromic shift in their spectra compared with the free ligand withinn—π*transition region. This shift is due to the change in the electronic configuration and the place of complexation for the obtained complexes.
2.4 1H-NMR spectra
The1H-NMR spectra of the Eu(Ⅲ) and Nd(Ⅲ) complexes, respectively. The signal of the carboxylate OH which observed atδ=11 ppm in the spectrum of the free ligand, was disappeared in the spectra of the [Eu(RHC)(NO3)2]·2H2O and [La(RHC)(NO3)2]·3H2O complexes, indicating that the coordination between the RHC ligand and the M(Ⅲ) ions tacking place via the deprotonated carboxylic O group. The aromatic protons signals located atδ=6.00~8.00 ppm are present with decreasing intensities, due to different chemical environments. The signals atδ=3.58, 3.46 ppm [H, H2O] can be assigned for the water molecules of hydration.
2.5 Biology
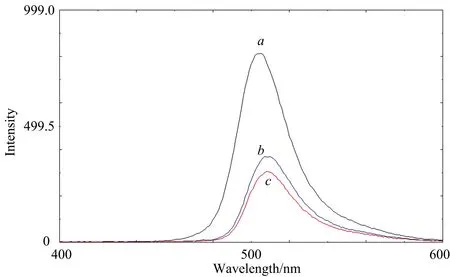
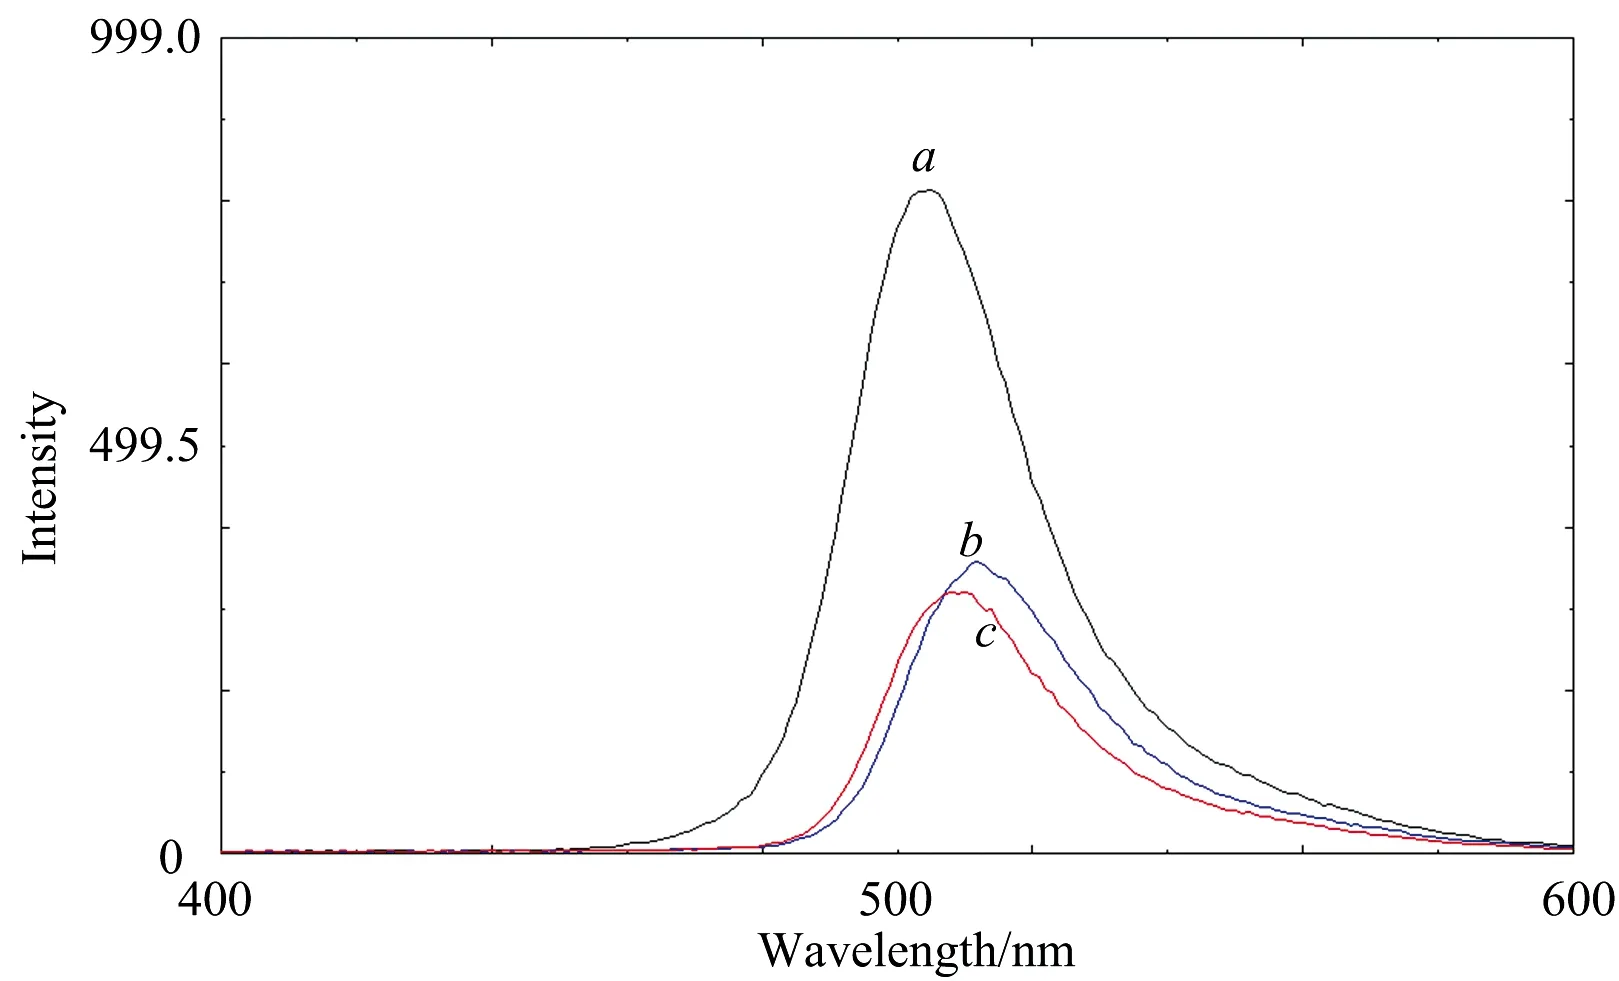
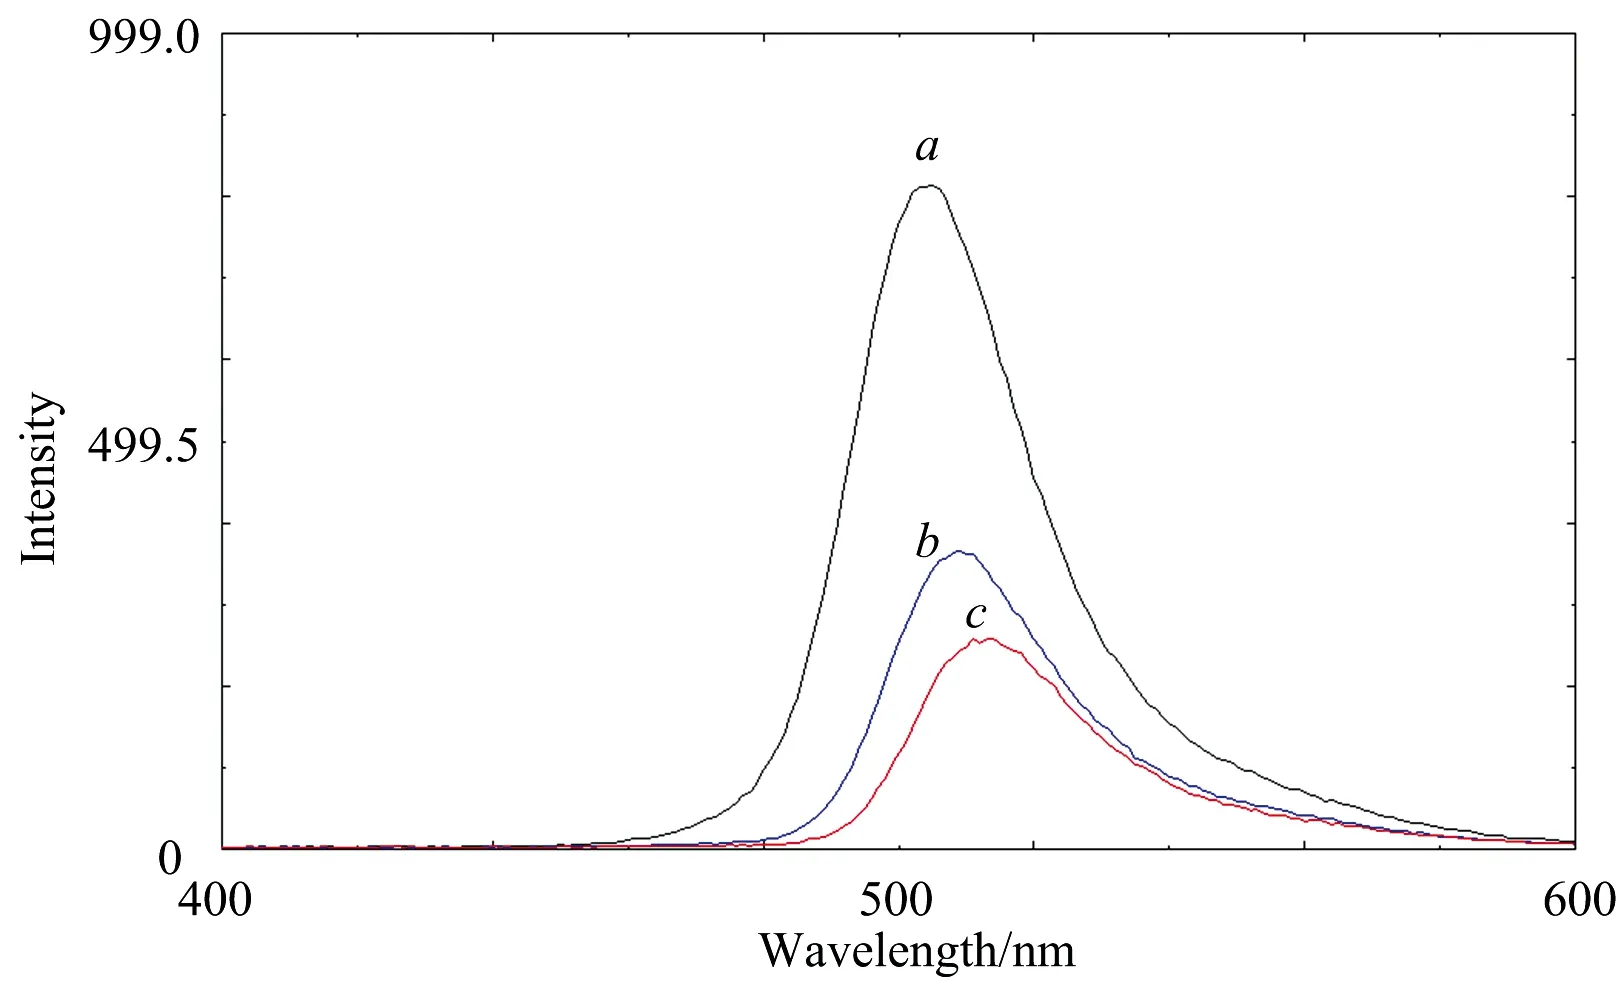
The results of the antibacterial and the antifungal activities of the synthesized complexes are presented in Table 3, and Fig.2. All the complexes have no biological activity againstE.coli, but in case ofAspergillusniger, La(Ⅲ) complex is more active than Nd(Ⅲ) complex. On the other hand, Ce(Ⅲ) and Eu(Ⅲ) complexes have no effect against Aspergillus niger. Generally, the orders of antimicrobial activity againstB.subtilisandPenicilliumrotatumfor the different complexes are: Eu(Ⅲ) Table 3 Antimicrobial activity of the synthesized complexes Fig.2 Statistical representation for antibacterial and antifungal activities of the synthesized complexes The structures of the synthesized complexes of RHC ligand with Ce(Ⅲ), Eu(Ⅲ), Nd(Ⅲ) and La(Ⅲ) ions have been established from the molar conductance, elemental analyses, UV-Vis, IR, and1H-NMR spectra. Based on these techniques, octahedral geometries are proposed for the synthesized complexes as represented in Fig.3. Fig.3 Modes of the chelation of RHC complexes (where M=Eu(Ⅲ), La(Ⅲ), Nd(Ⅲ) and Ce(Ⅲ), and X=2, 3, 4 and 5, respectively) Excitation and emission spectra of rhodamine C were recorded (Fig.4). Fig.4 Excitation and emission spectra of rhodamine Ca: Excitation spectrum (λem=508 nm);b: Emission spectrum (λex=550 nm) Metal ions of Ce3+, Tb3+, Th4+, Gd3+and La3+were found to quench the fluorescene intensity of rhodamine C in the aqueous state. The experimental results showed that the metal ions quench the fluorescence intensity of rhodamine C by forming dye-metal complexes (Figs.5—9). It was found that static quenching was the main reason of fluorescence quenching. Quenching can occur by a variety of molecular interactions, viz. excited-state reactions, molecular rearrangement, energy transfer and ground state complex formation (static quenching). Fig.5 Fluorescence spectra of rhodamine C in absence and presence of varying concentration of Gd3+(λex=550 nm) Fig.6 Fluorescence spectra of rhodamine C in absence and presence of varying concentration of La3+ (λex=550 nm) Fig.7 Fluorescence spectra of rhodamine C in absence and presence of varying concentration of Ce3+ (λex=550 nm) Fig.8 Fluorescence spectra of rhodamine C in absence and presence of varying concentration of Tb3+ (λex=550 nm) Fig.9 Fluorescence spectra of rhodamine C in absence and presence of varying concentration of Th4+ (λex=550 nm)

2.6 Proposed structure of the synthesized complexes

2.7 Fluorescence studies


