Morphology and multifractal features of a guyot in specific topographic vicinity in the Caroline Ridge,West Pacific*
Yu GAN ,Xiaochuan MA , ,Zhendong LUAN ,Jun YAN ,
1 CAS Key Laboratory of Marine Geology and Environment, Institute of Oceanology, Chinese Academy of Sciences, Qingdao 266071, China
2 Laboratory for Marine Geology, Pilot National Laboratory for Marine Science and Technology (Qingdao), Qingdao 266237, China
3 Center for Ocean Mega-Science, Chinese Academy of Sciences, Qingdao 266071, China
Abstract Massive seamounts have been surveyed and documented in the last decades.However,the morphologies of seamounts are usually described in qualitative manners,yet few quantitative detections have been carried out.Here,based on the high-resolution multi-beam bathymetric data,we report a recentlysurveyed guyot on the Caroline Ridge in the West Pacific,and the large-scale volcanic structures and smallscale erosive-depositional landforms in the guyot area have been identified.The multifractal features of the guyot are characterized for the first time by applying multifractal detrended fluctuation analysis on the surveyed bathymetric data.The results indicate that the multifractal spectrum parameters of the seafloor have strong spatial dependency on the fluctuations of local landforms.Both small-and large-scale components contribute to the degree of asymmetry of the multifractal spectrum (B),while the fluctuations of B are mostly attributed to the changes in small-scale roughness.The maximum singularity strength (α0) correlates well with the roughness of large-scale landforms and likely reflects the large-scale topographic irregularity.Comparing to traditional roughness parameters or monofractal exponents,multifractal spectra are able to depict not only the multiscale characteristics of submarine landforms,but also the spatial variations of scaling behaviors.Although more comparative works are required for various seamounts,we hope this study,as a case of quantifying geomorphological characters and multiscale behaviors of seamounts,can encourage further studies on seamounts concerning geomorphological processes,ocean bottom circulations,and seamount ecosystems.
Keyword:guyot;morphology;multifractal detrended fluctuation analysis (MFDFA);Caroline Ridge;West Pacific Ocean
1 INTRODUCTION
Seamounts are traditionally defined as isolated submarine volcanic constructs that reach at least 1 000 m in height from base to summit (Menard,1966;IHO,2008).They are ubiquitous on the ocean floor and can be found near mid-ocean spreading ridges,in plate interiors over upwelling mantle plumes,and in island-arc convergent settings(Staudigel and Clague,2010).Based on global satellite altimetry,about 25 000 potential seamounts with height >100 m was recently identified by Kim and Wessel (2011).Since the first seamount was reported in 1946 (Hess,1946),research on the morphology of seamounts has been appealing to marine geological scientists,because seamounts provide natural laboratories from which we can learn about planetary and ocean processes,ocean ecology,hazards,and deep-sea mineral resources on the Earth.As a fundamental parameter,the morphology descriptions were basically required when doing seamount relevant studies.Based on swath bathymetric data,Smoot and King (1993),Smoot(1995) and Smith et al.(1997) detailed analyzed the geometrical characteristics of guyots and seamounts in the Pacific.Recently,Bijesh et al.(2018) identified and classified 33 bathymetric high features as seamounts,knolls,or guyots from a high-resolution bathymetric map of the southwest Indian continental margin,and attributed the existence of these seamounts to hotspot volcanism.With the help of high-resolution bathymetric detections,fine-scale volcanic structures like craters and rims,as well as collapse structures on their flanks can also be studied(Passaro et al.,2010),as well as the basement outcrops and sediment cover on steep slopes of seamounts(Gusev et al.,2017).The features on seamounts and their surfaces are usually well qualitatively described,whereas few quantitative analyses have been reported,counting against the deep understanding of dynamic processes of the earth in both regional and global scale.
Landforms can be quantified by a variety of statistical characteristics and among them multiscale characteristics are the most useful in analyzing topographic variations with spatial scales (Duvall et al.,2019).Perron et al.(2008) successfully applied the two-dimensional Fourier transform on digital elevation models (DEMs) by to extract the characteristic landscape scales.The method was then used by Lallemand et al.(2018) to calculate surface roughness of the oceanic plate before entering subduction at certain specified wavelengths.The landforms with multiscale characters can also be analyzed using fractal models.Since Mandelbrot(1967) first reported the statistical self-similar phenomenon of the British coastlines,fractal parameters have become a useful substitute for quantifying the surface roughness and multiscale behavior (Smith,2014).As topography usually does not exhibit a simple monofractal scaling behavior,the multifractal models are introduced to depict the fractal characteristics (Mandelbrot,1983).Multifractal detrended fluctuation analysis (MFDFA),which was modified from the detrended fluctuation analysis(DFA) (Peng et al.,1994),is a common method to extract the multifractality of signals (Kantelhardt et al.,2002).Compared to the monofractal model,multifractal models provide varied scaling exponents to more properly describe the scaling behavior and the multiscale characteristics of landforms (Gagnon et al.,2006).Multifractal models have already been applied on different landscapes like river basins(Ijjasz-Vasquez et al.,1992),large-scale topography of Earth (Gagnon et al.,2006),Mars (Landais et al.,2015),Mercury and the Moon (Landais et al.,2019),Himalayan glacial and fluvial valleys (Dutta,2017),loess shoulder lines in the Loess Plateau of China(Cao et al.,2017),the Zagros Mountain range (Kolahi-Azar and Golriz,2018),and coral reefs in Moorea,French Polynesia (Duvall et al.,2019).Recently,MFDFA was applied to analyze the multiscale characteristics of nonstationary series (Movahed et al.,2006;Wu et al.,2018;Zhang et al.,2019).However,due to the lack of high-resolution DEMs and the diffi culties in quantifying submarine geomorphological processes,few studies focused on the multifractal characteristics of submarine landforms including seamounts.
Since 2013,the Institute of Oceanology,Chinese Academy of Sciences,has conducted several investigations on the biological systems,geological settings,and oceanographic characteristics,as well as the high-resolution bathymetric data of several seamounts near the Caroline Ridge (Liu et al.,2020;Zhang et al.,2020,2021),providing a great opportunity to investigate the multi-scale morphological characters of seamounts.In this study,based on the high-resolution multi-beam data,the morphology of the guyot and its ambient seafloor on the Caroline Ridge in the West Pacific have been described in detail.We also use MFDFA for the first time on the seamount DEMs to analyze the multifractal characteristics of guyot.The spatial variation of the multifractal features of the guyot region and its cause are furtherly analyzed.The aim of this study is to quantitatively characterize the seamount,helping better understand the character and surface processes of seamounts.
2 GEOLOGICAL BACKGROUND
The guyot (currently named M4,140°08ʹ03″E,10°28ʹ41″N) lies on the northwest edge of the Caroline Ridge,and adjoins the Mariana Trench in the north.In this region,the Pacific Plate,the Philippine Sea Plate,and the Caroline Plate interact intensely (Fig.1a).The west part of the Caroline Ridge is bounded by the Mariana Trench in the north,the north part of the Yap Trench in the west and the Sorol Trough in the south.The Mariana Trench and the north part of the Yap Trench are the convergent boundaries of the Pacific Plate and the Philippine Sea Plate,and the Caroline Ridge is thought to be subducting beneath the Yap Trench at present in an intra-oceanic subduction setting (Sato et al.,1997).The Sorol Trough is meanwhile the plate boundary of the Pacific Plate and the Caroline Plate showing strike-slip and extensional characteristics (Weissel and Anderson,1978).The Caroline Ridge is a buoyant oceanic plateau with over-thickened crust and a young geological age.Keating et al.(1984) considered that the Caroline Ridge was formed by the Caroline hotspot in late Oligocene.According to the recent research of Dong et al.(2018),the onset of the Sorol Trough began in late Miocene;therefore,the original Caroline Ridge could be split into two parts by the rifting of the Sorol Trough.
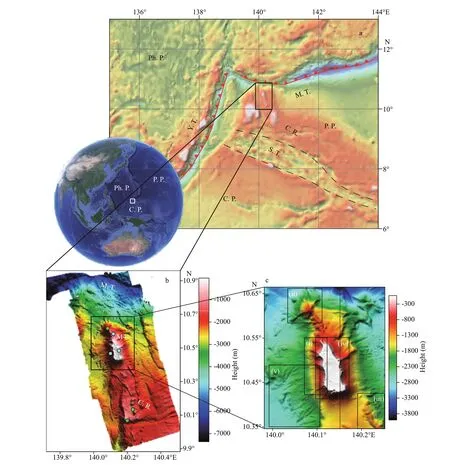
Fig.1 Bathymetric map of the study area (black boxes)
Deep Sea Drilling Project (DSDP) in the northern flank of the Caroline Ridge reports that the upper Oligocene sediments are made of nano-fossil oozes and chalks and the sediment base is demonstrated to be doleritic basalt,which is completely different from the much older Pacific oceanic basalt in the north(Heezen et al.,1971).The rocks collected in the Sorol Trough present characters of normal mid-ocean ridge basalt (MORB) dated at~7.0±1.0 Ma,indicating to have formed by spreading in the Sorol Trough(Beccaluva et al.,1986).With the help of ROV diving(Fig.1b),Our recent surveys show that the base of this guyot is covered by thick calciferous sediments and rocks,which are mostly coarse foraminifera sand and reeflimestones (Wang,2018).As a result,the study area is on the basaltic oceanic plateau formed by the Caroline hotspot in late Oligocene,and the sediment layer above the igneous bedrocks,which consists of loose foraminifera sand and reeflimestones is depositing during the subduction of the Caroline Ridge and the rifting of the Sorol Trough until now.
3 DATA AND METHOD
The M4 guyot was surveyed and mapped in April 2017 and May 2019 through an ELAC Seabeam3012 multibeam system on the R/VKexue.Raw data of the multibeam echo-sounder were processed using the software CARIS HIPS and SIPS 10,and the vertical resolution of bathymetric data after being processed reaches~10 m.The DEM of M4 guyot with a grid resolution of 100 m were built based on the postprocessing data.All the subsequent experiments and analysis are based on the DEM from the measured bathymetry data.Geomorphological analysis of the DEM was achieved using ArcGIS 10.3 and the slope,profile curvature and plan curvature data were obtained using ArcGIS surface analysis toolbox(Fig.2).In this study,longitudinal and zonal bathymetric profiles of the study area (Fig.1c) were extracted from the DEM,because these two directions are roughly parallel to the guyot axis and orthogonal to each other.MFDFA was used on each profile to analyze the multifractal characteristics of the seafloor and detect the dominant processes in different scale ranges (Fig.2).The MFDFA program was executed in MATLAB R2018a after Kantelhardt (2002) and Ihlen(2012) (Detailed procedures of MFDFA are attached in the Supplementary Material).
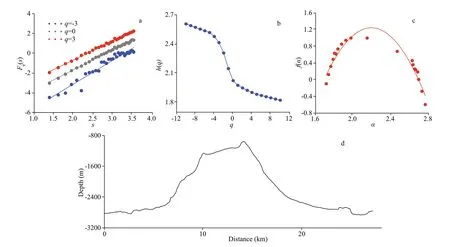
Fig.2 Procedures of MFDFA
In fractal models of topography,Hurst exponent is often calculated to represent the fractal characteristics of topographic profiles (Shepard et al.,2001),and the fractal characteristics of the monofractal topography can be described by a constant Hurst exponent.In MFDFA,the exponenth(q) is the generalized Hurst exponent and the dependence ofh(q) onqindicates the multifractality of the input profiles.To obtainh(q)of multifractal series,fluctuation functionsFq(s) with different momentsqare generated and,in this study,qwas chosen to be integers in [-10,10].For monofractal profiles,h(q) andqare independent andh(q) equals to the Hurst exponent (h(q=2)) of the profile.For nonstationary series,such as the fractal Brownian motion(fBm) noise,the relationship betweenHand the generalized Hurst exponenth(q) will beH=h(q=2)–1(Movahed et al.,2006).
By applying Legendre transform,the multifractal spectrumf(α) against the Hölder exponentαcan be obtained.The multifractal spectrum describes the multifractality of the input profile because different values ofαcharacterizes a different part of the structure of the profile,leading to the existence off(α).The multifractal spectrum can be quantified by fitting to a quadratic curve,and the width between two zero points of the quadratic function (W=αmax–αmin) indicates the degree of multifractality of the input profile.A higherWrefers to a more multifractal profile,and for a monofractal profile,the spectrum collapses into a single point.Besides,the highest point of the quadratic curveα0,referring to the maximum singularity strength,and the degree of asymmetry (B=(αmax+αmin–2α0)/W) are also crucial parameters to depict the shape of a multifractal spectrum (Chakraborty et al.,2016).As a result,the shape of a multifractal spectrum can be depicted by three parameters:the width of the spectrumW,the maximum singularity strengthα0,generally the maximumf(α),and the degree of asymmetryB,deciding the skewness of the spectrum (B>0 for right skew andB<0 for left skew).
Since the multifractal spectra calculated from each profile reflect the multifractality of the combination of different landforms on the profile,the multifractal spectra parameters cannot describe the contribution of small-and large-scale fluctuations to the multifractality.Therefore,to examine the contributions of small-and large-scale landforms to the multifractality of the topography respectively,we followed Perron et al.(2008) and applied 2D Fourier transform to separate the small-scale topographic fluctuations from the large-scale variations (see Supplementary Materials).Normalized power spectrum of the studied DEM was calculated and two characteristic scales were extracted.Then a high-pass filter was applied to separate two characteristic scales to obtain the smalland large-scale components of the topography.To quantify the roughness of both longitudinal and zonal profiles in the small-and large-scale landforms,we calculated the standard deviation of depth for each profile,and the multifractal parameters of each longitudinal and zonal profile of both the small-and large-scale components were calculated using MFDFA.Correlation analysis was applied on different series and correlation coeffi cients were calculated to examine the correlations between different parameters.
4 RESULT AND DISCUSSION
4.1 Geomorphological features in the guyot region
The study area can be divided roughly into two parts by the location and the different characters of seafloor slope and curvatures (Fig.3a–c).The north part is located at a larger water depth dipping to the Mariana Trench and the seafloor is with relatively large slopes.There are several parallel west-east oriented terraces characterized by suddenly increased slopes.The south part,being the part of the Caroline Ridge,is located at a relatively low water depth and is relatively flat.The steepest area is the hillside of the guyot.Besides,the south part of the study area can be naturally separated into three zones with diverse dominated topography.Both the west and the east sides of the terrace are characterized by cluster of gullies.The major landform units are classified as volcanic landforms and erosive-depositional landforms,and all the landform units are displayed and illustrated in Fig.3d–e.
The M4 guyot is the most prominent feature in the region which rises about 2 300 m from the basement(Fig.3d-ⅳ).The seamount is featured by an approximately north-south extending elliptical flat top and several radial ridges extending around the mountain.The height-to-basal-radius ratio of M4 guyot is 0.18,which lies in the range of 0.21±0.08(Smith and Jordan,1988).The slope angle of M4 can also be calculated as 16.2°,which is relatively low but still lies in the range of 18°±6°.Additional to the main flat-topped cone,there are two more secondary cones to the north of M4 (Fig.1b).The bigger one (named secondary cone 1,Fig.3d-ⅱ) located in the northwest of M4 have a pointy cone and five radial ridges.The south slope of the cone connects to the M4 guyot and the north slope is dipping to the axis of the Mariana Trench.A smaller pointy cone emerges at the northwest slope of secondary cone 1,indicating likely multiple episodes of volcanic activities.Secondary cone 2 locates about 20 km northeast of M4 and is much deeper and smaller than secondary cone 1.The hill chain locates on the southeast edge of the submarine terrace and elongates southward out of the study area (Figs.1c &3d-ⅲ).The east slope of the hill chain is relatively steep in an average slope of 33°,while the west slope has an average slope of 22° and a lower average height.The east slope of the hill chain is characterized by massive gullies,indicating possible intensive erosive and depositional processes.
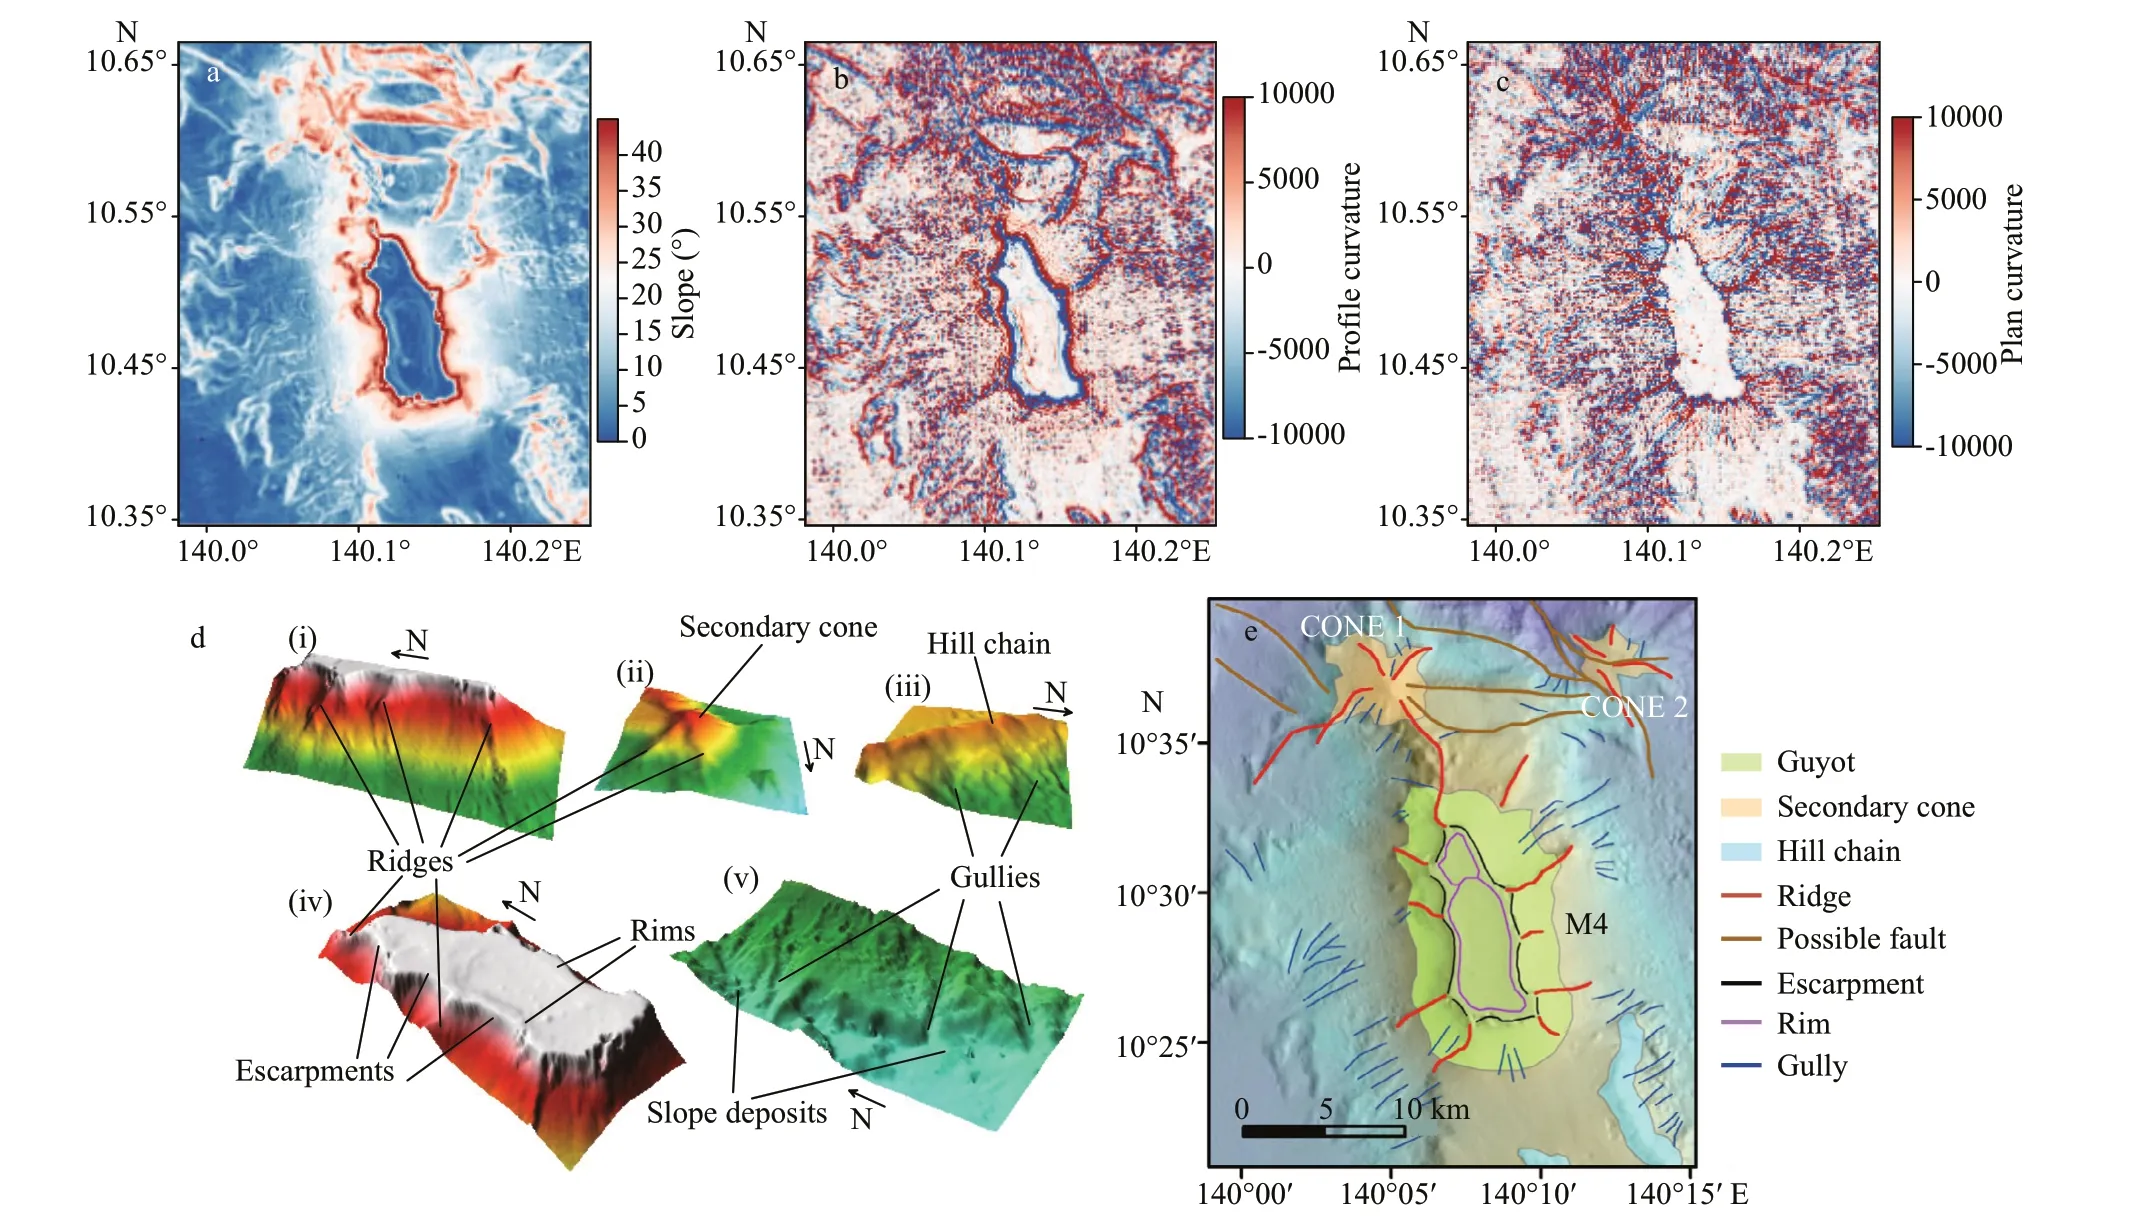
Fig.3 The slope data (a),profile curvature data (b),and the plan curvature (c),detailed 3D bathymetric maps (d) shown in black blanks in Fig.1c,and the geomorphological map (e) of the study area
Guyots are thought to be shaped by both volcanic process and intensive erosive process.Strong erosivedepositional processes have been identified in the surrounding Yap Trench,Mariana Trench,and guyot areas using multibeam detection (Kimura et al.,1989),submersible observation (Yang et al.,2018),or seismic exploration (Dong et al.,2018).Hence,similar geomorphological processes are likely to occur in the study area to reshape the landforms.Here,the slope degree of M4 guyot rapidly increases at the edge of the flat top (Fig.3a,d–i).The slope increases gradually from lower than 10° to more than 40° near the base but increases rapidly to about 55°(even more than 60°) near the top of M4.These linear features with slopes more than 25° and concave and convex forms along them over their upper limits in the profile curvature map could be regarded as escarpments (Fig.3b) (Idárraga-García and León,2019).
The top of M4 is characterized by a large bowlshaped pit in the middle circled by relatively high rims (Fig.3d-ⅳ).These rims are constrained by slope gradients between 5°–10° in Fig.3a.They can be spotted as concave and convex forms in the profile curvature map but are not so evident in the plan curvature map (Fig.3b–c).In the former studies,the guyots with similar morphologies were believed to be volcanic edifices covered by coral reefs,barriers or lagoonal patch reefs (Rougerie and Fagerstrom,1994).It has also been proved by seismic data on Mid-Pacific Mountains (Winterer and Metzler,1984),comparative research on morphologies on Geisha Guyots (Vogt and Smoot,1984),and ODP drilling evidence in Northwest Pacific (Baudin et al.,1993).Herein,the rims of M4 guyot is also inferred to be ancient coral atolls as the shallow depth of the present guyot above the local carbonate compensation depth(CCD) and the abundant reeflimestones found by ROV diving (Wang,2018) and also the rim depth is shallower than local CCD and can be preserved.
Gullies commonly with V-shape sections are also widely-distributed in the study area (Fig.3d-ⅲ &v).Existence of clusters of gullies has been reported on seamounts by former studies (Palomino et al.,2016;Spatola et al.,2018;Idárraga-García and León,2019).Here,gullies have clear negative and positive plan curvature values (Fig.3c),which possibly indicate intense erosive (positive areas) and depositional processes (negative areas) on the guyot.There are two main regions featured by clusters of gullies in the study area.The bigger region locates at the southwest piedmont of the M4 guyot,where gullies have an average length of about 3 km.The smaller region with clusters of gullies adjoins the east slope of the hill chain,with an average length of about 1.5 km heading northeast.The source of sediments of this region may come directly from the hill chain,and the relatively short average length compared with the other region might be attributed to less gravity potential energy of the hill chain landform.
4.2 Multifractality of the seafloor
To describe the multifractality of the seafloor,the study area was divided into six different zones (L1,L2 and L3 for longitudinal profiles;Z1,Z2,and Z3 for zonal profiles).The criterion of division was to separate the M4 guyot from its surrounding flanks.According to the geomorphological map in Fig.3e,the main edifice of M4 is roughly enclosed by contours of 2 000 m and 1 400 m,so the study area was divided by zonal or longitudinal lines approximately tangent to these contours.Three parameters of multifractal spectra (Fig.4),W,α0,andB,for both longitudinal and zonal profiles are calculated and plotted in Fig.5a–b against the profile positions (in km),and different zones were highlighted by distinct colors.Representative bathymetric profiles from different zones were numbered in Fig.5 in low-case letters and shown in Fig.6.The multifractal analysis result reveals that different zones have distinct multifractal spectrum features.The multifractal spectrum parameters have strong spatial dependency on the fluctuations of local landforms.
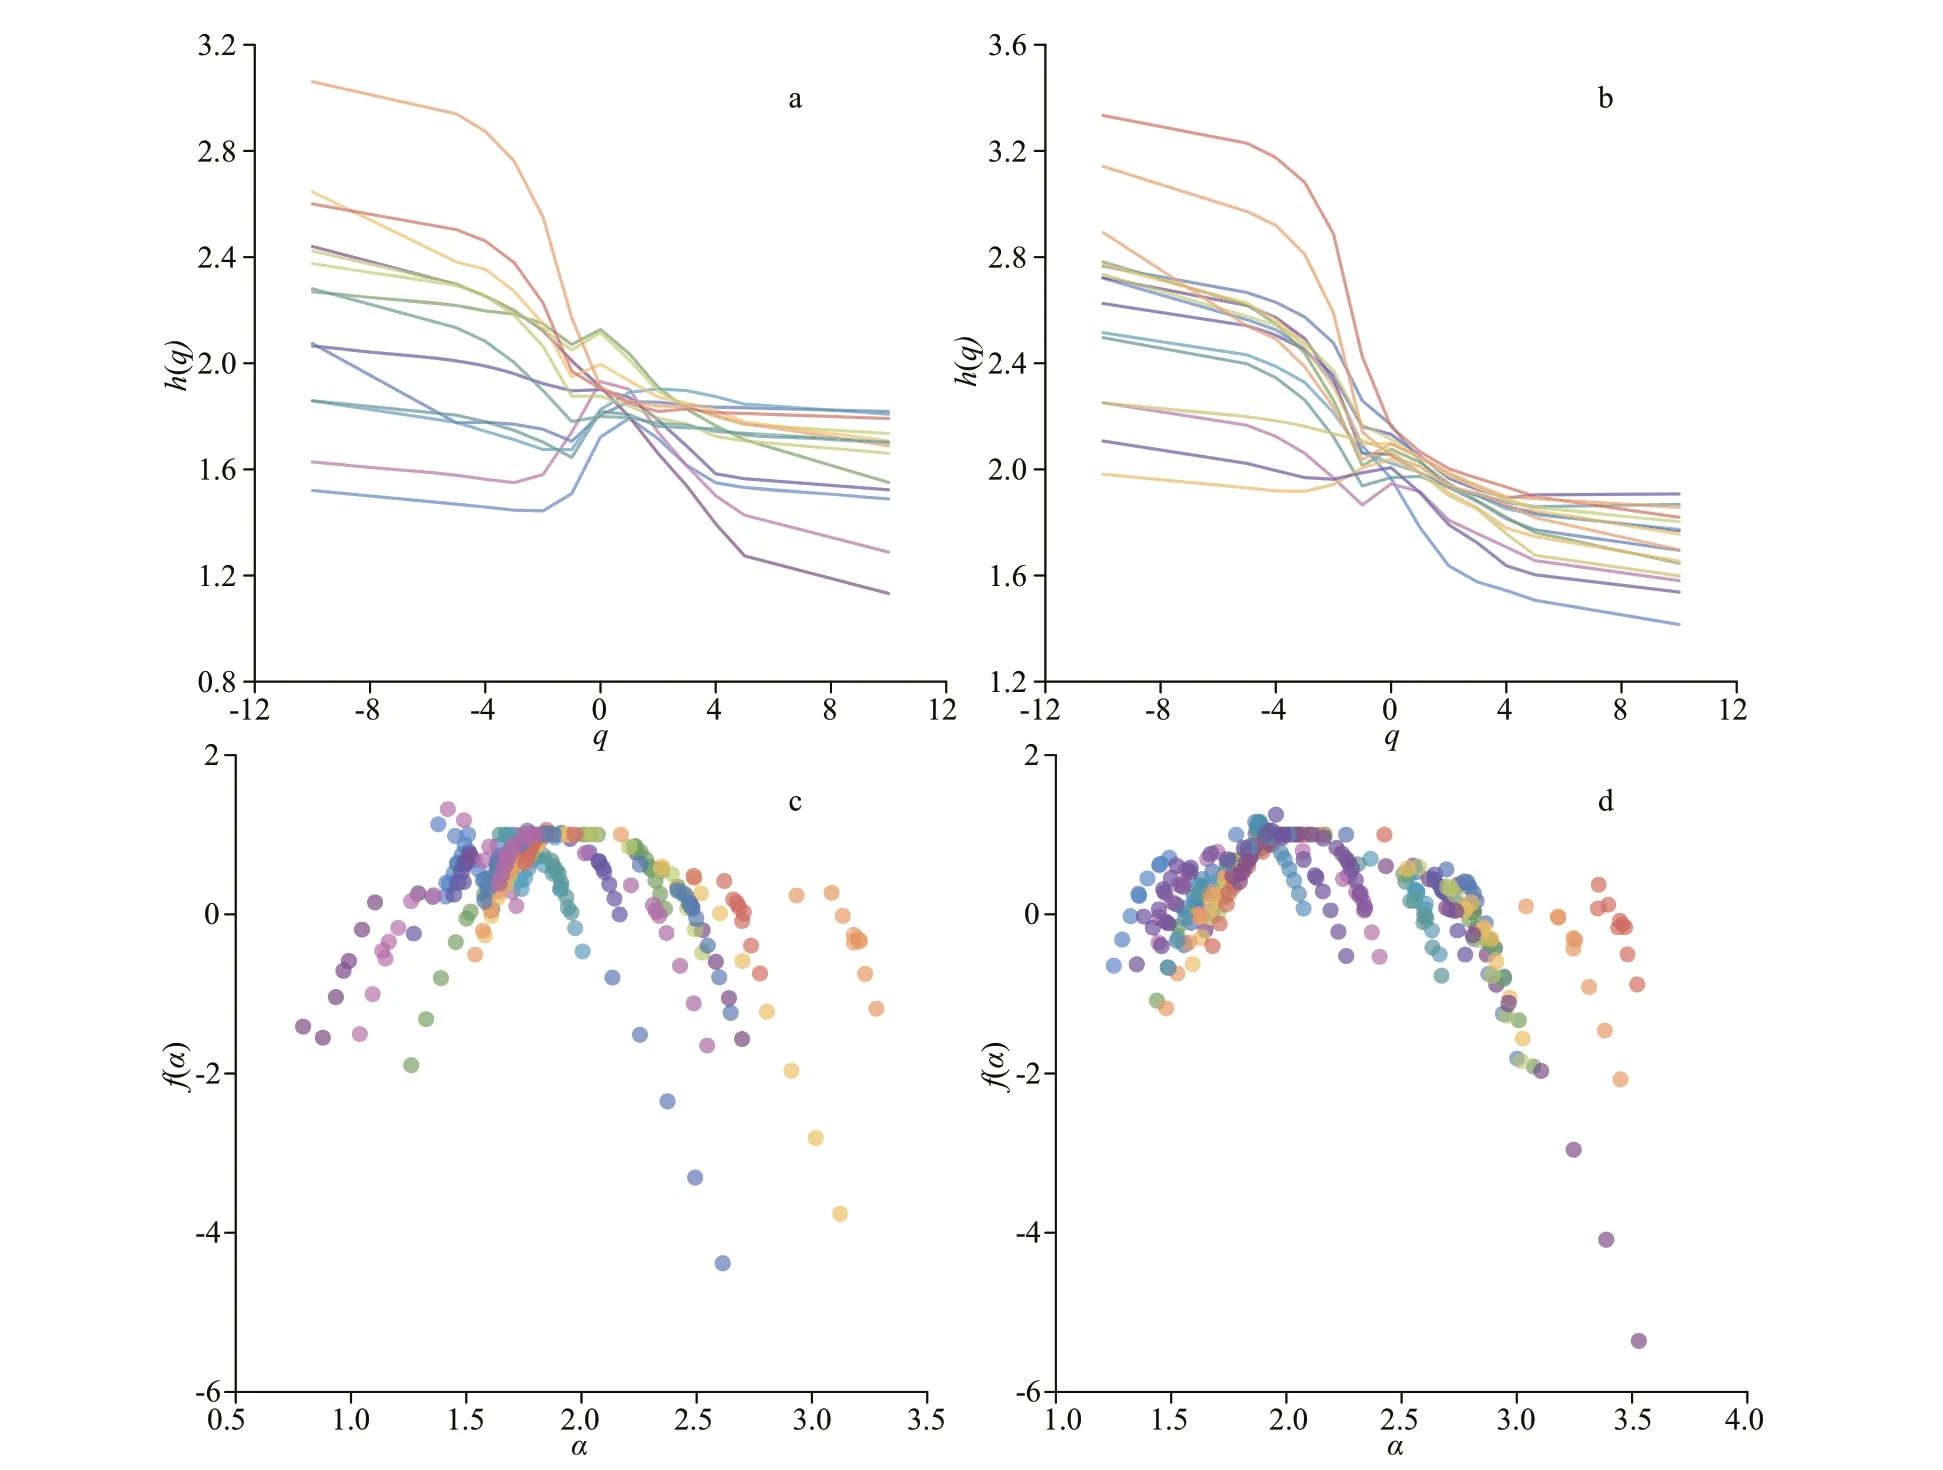
Fig.4 h(q) plots of longitudinal (a) and zonal (b) bathymetric profiles; f(α) plots of longitudinal (c) and zonal (b) bathymetric profiles (distance between profiles is 2 km)
Whas been reported to be a measure of the multifractal degree (Ijjasz-Vasquez et al.,1992;Dutta,2017).In the study area,values ofWvary strongly with locations of different profiles (Fig.5a–b) and the variability ofWfor longitudinal profiles is larger than that of zonal profiles.For longitudinal profiles,values ofWfirst rise then drop to near 0 for profiles in the west side,but fluctuate slightly around 1.0 in the east.Profiles cutting the pointy secondary cones and the hill chain have relatively greater values ofW.The highest values ofWlocate at the edges of the flat top of M4,characterized by escarpments and radial ridges.In contrast,most of other profiles passing through the flat top has relatively lower values ofW(Fig.6b).For zonal profiles,Z1 zone is characterized by intense fluctuations,which might be caused by the fractured landforms with faults and ridges (Fig.6d).Z2 zone have relatively high values ofWand relatively gentle fluctuations.The values ofWfor Z3 zone are relatively low and have a tendency of first increasing and then decreasing.To summarize,profiles with higher degree of multifractality mostly cut through highly rugged geomorphological units,such as the secondary cones,gullies on the flanks and the edges of the M4 top.On the contrary,profiles cutting the relatively smooth topography (e.g.,the top of M4)show weak multifractality.
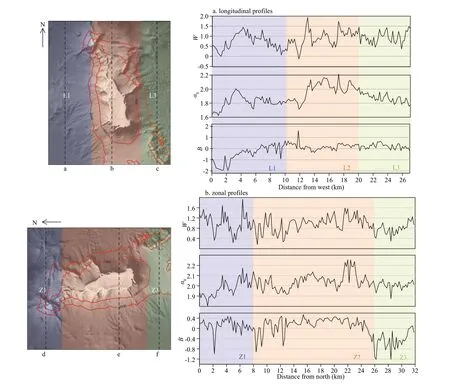
Fig.5 The alternations of W,α 0,and B against the profile position for longitudinal (a) and zonal (b) profiles,respectively
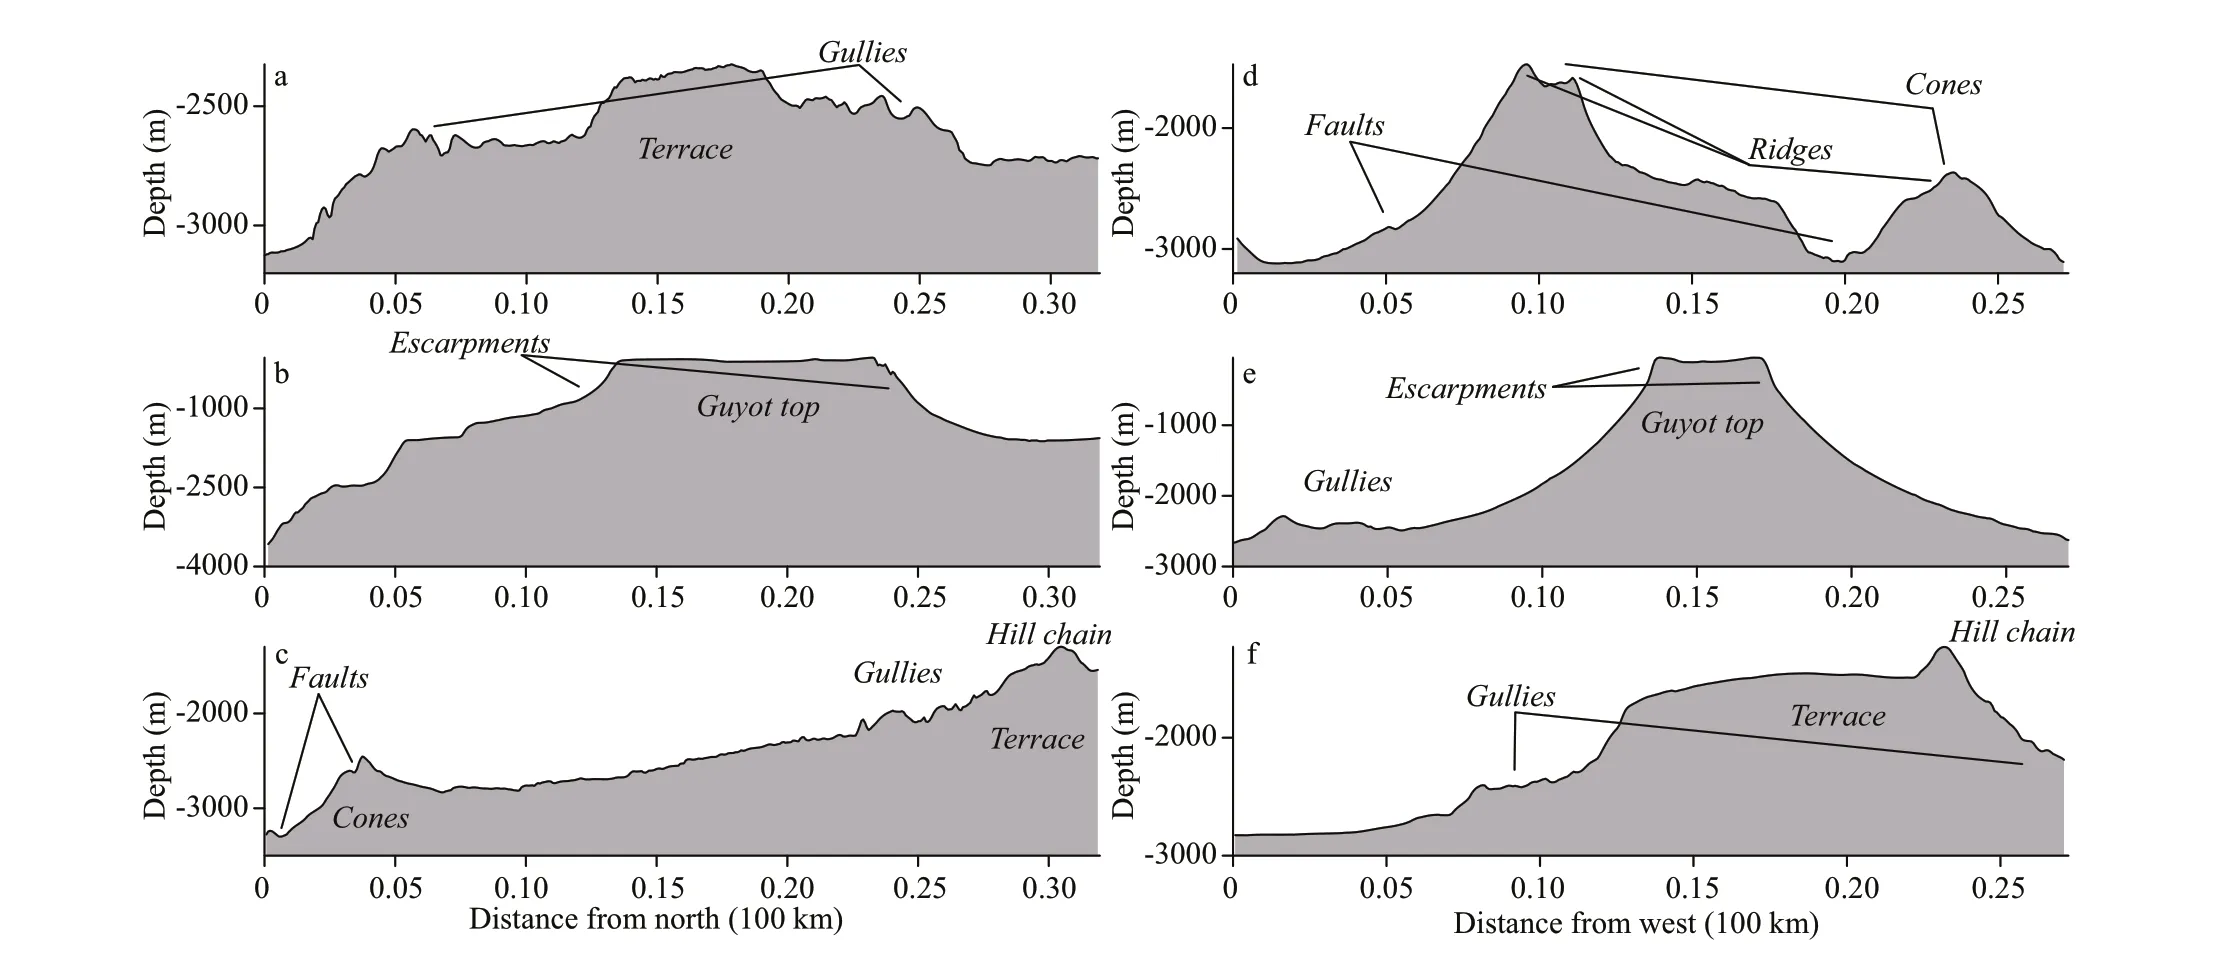
Fig.6 Depth plots of profiles a–f mentioned in Fig.5
α0represents the regularity of the origin data.A lowα0stands for processes“losing fine structures”and becoming more regular in appearance (Telesca et al.,2003).In Fig.5a,data from L2 have a distinct higherα0(mean value:2.01) in contrast to the other areas (1.82 for L1 and 1.87 for L3),suggesting a higher degree of irregularity.The edifice of guyot is the most significant landform and contributes to the intense fluctuation in L2 zone,leading to more topography irregularity and thus a higherα0.However,the mean value ofα0of Z2 zone (2.11) is not significantly different from that of Z1 zone (1.98) and Z3(1.99) (Figs.5b &6d–f),and,similar to L2,they are all higher than L1 and L3.This phenomenon could be attributed to the existence of the submarine terrace,which elongates in north-south direction.Zonal profiles cutting the submarine terrace are all featured by topographic height in the middle,just like profiles in L2 and Z2,leading to higher irregularity.Therefore,the edifice of M4 and the submarine terrace is featured by a higherα0in multifractal spectra.
In the study area,Bfor L1 (mean value:-0.48) is more negative than those for the other longitudinal areas (0.14 for L2 and 0.20 for L3) (Fig.5a).According to former studies,Binforms the dominance of high(B>0) or low (B<0) fractal exponents respect to the other.Concretely,a negative value ofBindicates smaller roughness in the terrain (Dutta,2017) and maybe weaker erosive processes (Cao et al.,2017).Hence,longitudinal profiles in L1 zone tend to be smoother comparing to those in L2 and L3 (Fig.6a–c).Similarly,zonal profiles in Z3 are also characterized by smoother terrain and have the negative mean ofB(-0.42 for Z3,0.11 for Z1,and 0.12 for Z2) (Fig.5b).
The multifractal spectra parameters quantify the multifractal characters of the regional landforms,however,cannot describe the relative contribution of landforms with different scales in each profile.Since the landforms in the study area is a mixture of both small-and large-scale geomorphological units,and small-scale landforms such as gullies and ridges are scattered on each flank of the M4 guyot.It is necessary to evaluate the contribution of small-and large-scale of landforms to the multifractal character.
4.3 Contributions of small-and large-scale landforms to the multifractality
As mentioned in Section 4.1,major landforms in the study were classified as volcanic landforms and erosive-depositional landforms with distinct scale ranges.For example,the M4 guyot is 2 346 m in height with a base area of 301.4 km2;and the gullies scattered on the guyot flanks are only 1.5–3 km in length and hundreds of meters in width.To examine the contributions of small-and large-scale fluctuations to the multifractality of topography respectively,the small-scale topographic fluctuations were separated from the large-scale variations.Herein,small-scale length of landforms is defined to be 0.3–2 km while large-scale length is 7–20 km from the normalized power spectrum (Fig.7).Thus,gullies on the guyot flanks and the submarine terrace,radial-distributed ridges,faults,and escarpments around the flat top of guyot can be extracted in the small-scale bathymetric map (Fig.8a).
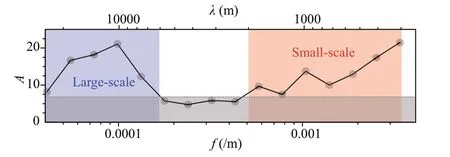
Fig.7 Normalized 1D power spectrum of the DEM of the study area
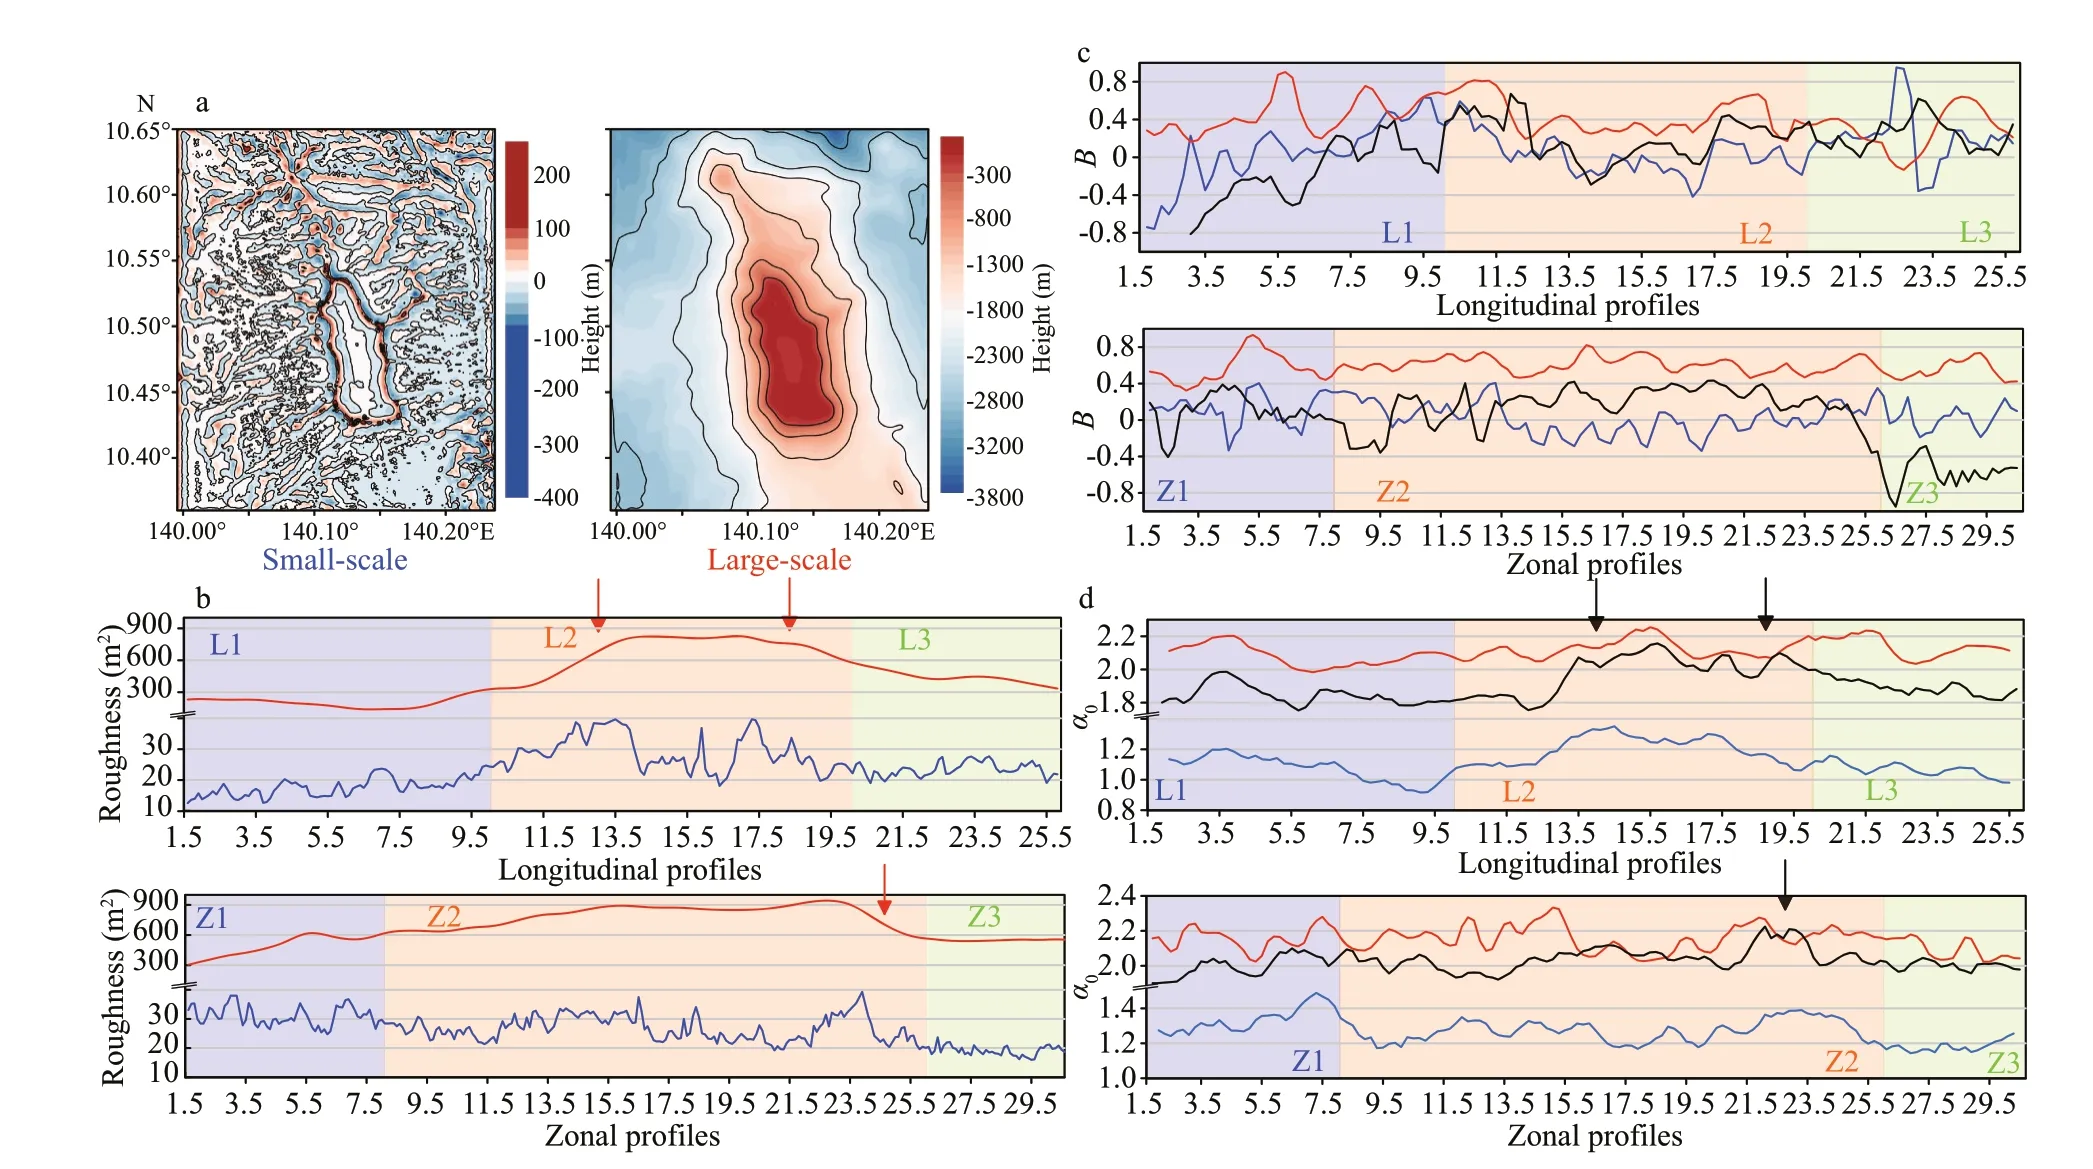
Fig.8 Contour maps of small-scale (left) and large-scale (right) landforms extracted from the original DEM (a),in which areas of 1.5 km in width near boundaries were cut to eliminate the boundary effects of the Fourier transform.The roughness of each profile quantified by the standard deviation of depth (b);the variation of B (c) and α 0 (d) of each profile after running averaged
Bof the small-and large-scale component are different in the mean values and the intensities of variation (Fig.8c).The mean values of the small-scale component are 0.07 and 0.03 for longitudinal and zonal profiles respectively,while the mean values of the large-scale component are 0.40 and 0.59.As a result,both the original data and the small-scale component haveBvalues near 0 while the large-scale component has positiveB.Bof the original data fluctuates intensely for both longitudinal and zonal profiles with standard deviations of 0.53 and 0.39.The intense fluctuations are inherited byBof the small-scale component,but the standard deviations ofBof the large-scale component become lower (0.24 for longitudinal profiles and 0.12 for zonal profiles).Hence,it is convincing that the variations ofBare related to the fluctuations in small-scale landforms.However,notice that in Z3,Bof the small-scale component deviates from the original data,so it is more convincing that both small-and large-scale components contribute toBof the original data,while the fluctuations ofBare attributed mostly to the changes in small-scale roughness.Another abnormal phenomenon in Z3 is thatBof origin data show intense negative values even thoughBof the two components is slightly positive.NegativeBindicates the dominance of low fractal exponents in the origin data,but the dominance of low fractal exponents may be attributed to different reasons.It may be caused by either the negative B in small-scale components (such as in L1),or the interactions between small and largescale components (such as in Z3).
α0of the large-scale component showed similar mean to that of the original data,but was distinct from that of the small-scale component.In Fig.8b &d,the variation ofα0of the original data and the roughness of the large-scale component have similar trends.Curves ofα0of the original data rise where the roughness of the large-scale component changes intensely.The correlation coeffi cients of these two series also show that they are highly correlated for both longitudinal (0.78) and zonal profiles (0.54).The singularity of a bathymetric profile is related to the long-range correlations within the series and tend to be preserved in the large-scale component.As a result,the fluctuations ofα0reflect the large-scale roughness of landforms.
Bindicates the dominance of high (B>0) or low(B<0) fractal exponents respect to the other andα0represents for the most common fractal exponent(Duvall et al.,2019).WhenB>0,fractal exponents larger thanα0are dominant and whenB<0,fractal exponents smaller thanα0are dominant.Sinceα0is the most common fractal exponent,it reflects the most significant long-range correlation tendency,or the global regularity of a profile.In mountainous area,the most significant long-range correlation trend was thought to be related to the large-scale topographic changes and endogenetic processes (Kolahi-Azar and Golriz,2018).Thus,the fluctuations ofα0in this study are related to the large-scale landform changes.On the other hand,Bshows whether the local dominant fractal exponents are larger or smaller than the most common exponent,and it reflects the roughness of the studied profile.The roughness of the small-scale component is intensely fluctuating,while large-scale roughness tends to be more static (Fig.8b).Although the weak amplitudes of the small-scale component hardly influence the global long-range correlation trend or the regularity of a topographic profile,they can make a difference in the local fractal exponents and local correlation trends.As a result,Bof original data also fluctuates intensely asBof the small-scale component.
4.4 Implications for the application of MFDFA on seamounts
By applying MFDFA on bathymetric data of M4 guyot and its vicinity,different landforms were characterized by distinct multifractal features.Since differences in fractal characteristics can be attributed to transitions in dominance of different geomorphological processes (Bishop et al.,1998),differences in multifractal features also reflect the transitions in geomorphological processes in a detailed way.In Section 4.2,landforms such as the secondary cones,gullies on the flanks,and the edges of the M4 top were characterized by higher degree of multifractality.All these landforms were formed under strong geomorphological processes,either volcanic or erosive-depositional.Most large-scale landforms,such as M4 and the submarine terrace were formed by volcanic processes,and they could be interpreted by higherα0in multifractal spectra.As for small-scale processes,erosive-depositional processes were weaker than volcanic processes.In L1 where volcanic landforms were almost absent yet gullies were widely separated,Bturned to be negative,indicating much smoother terrain.However,in Z1 where most small-scale landforms were generated by faults and volcanic forces,Bremained slightly positive.Profiles with largest multifractality located at the edges of M4,where volcanic processes and erosive processes interacted and formed landforms such as radial ridges and escarpments.Both smalland large-scale roughness rose here andα0reached local maximum,indicating profiles there were characterized by higher roughness and irregularity.Unlike cony seamounts,which could be analogous to the secondary cone 1,the top of guyot M4 became flat by erosive forces.As a result,the multifractality of profiles cutting a guyot would have local maximum values at the edges while local minimum values on the flat top.This spatial variation pattern of multifractality might be helpful in distinguishing flattopped mountains in different geological settings.
Comparing to traditional roughness parameters or monofractal exponents,multifractal spectra are able to depict not only the multiscale characteristics of submarine landforms,but also the spatial variations of scaling behaviors.Traditional roughness parameters like the standard deviation of depth are restricted to certain scale ranges and the interactions between small-and large-scale components remain obscure(Perron et al.,2008).Similarly,monofractal exponents(H) can be distinct in different scale ranges (Shepard et al.,2001),hence it is not adequate to describe the scaling characteristics of topographic profiles with only the traditional roughness parameters or monofractal exponents.However,in this study,multifractal spectra are proved to be possible to depict the roughness information of both small-and largescale components,and the variations of fractal exponents against different scales.Moreover,as multifractality has strong spatial dependency and is related to fluctuations of local landforms in this study,multifractal spectra are able to demonstrate the spatial variations of scaling behaviors.The ability of analyzing different scaling behaviors at different locations by multifractal methods were recently reported in Zagros mountains (Kolahi-Azar and Golriz,2018) and coral reefs (Duvall et al.,2019).Multifractal parameters can quantify the irregularity and the spatial heterogeneity of topographic profiles,which is especially helpful in studying isolated terrain heights like guyots and cony seamounts.
On the other hand,the topography of deep ocean bottom also interacts with water motion and the evolution of abyssal ecosystems.Therefore,studying the multifractal characteristics of M4 guyot and its vicinity can shed light on the simulation of water circulations around the seamount,and the understanding of geomorphological factors in a guyot ecosystem.The existence of seamounts on the seafloor is thought to heavily affect the bottom water circulation and contourite drifts,Taylor column circulation and other dynamic phenomena were reported to take place in seamount areas globally(Mohn and Beckmann,2002;Juan et al.,2018).Since multifractal parameters of seamount landforms can provide information about both the multiscale roughness and the spatial variability of scaling behaviors,multifractal analysis is necessary in the simulation of bottom drag strain and water circulation dynamics.Seamount landforms can also influence the local ecosystem dynamics by trapping the vertical migrating organisms (Fock et al.,2002).It was observed on Great Meteor Guyot,northeast Atlantic that a Taylor column was formed that might retain larvae,plankton,or nutrients around the guyot(Morato et al.,2013).In hydrothermal fields in the Okinawa Trough,geomorphometric parameters were reported to be related to the habitats of certain megafaunal species (Takeuchi et al.,2019).Nowadays,as several interdisciplinary investigations on biology,geology,and oceanography have been accomplished near M4 guyot in the Caroline Ridge,it is fundamental to have a clear understanding of the multiscale geomorphological characteristics of the guyot and its vicinity,and in this case,study applying MFDFA on bathymetric data has shed light on a new multiscale method to achieve this goal.
5 CONCLUSION
Based on recently-acquired multibeam bathymetric data,the geomorphological characteristics of M4 guyot have been well documented and the multifractal features of the seafloor in the study area have been calculated through MFDFA method.The result shows that landforms in the study area can be categorized into two classes:volcanic landforms and erosivedepositional landforms.The study area was divided into six zones (L1,L2,L3 and Z1,Z2,Z3) in order to separate M4 from its surrounding flanks.Multifractal analysis indicates that the multifractal spectrum parameters have strong spatial dependency and are related to fluctuations of local landforms.Profiles from L2 and Z2 acquire distinct higherα0,while profiles from L1 and Z3 are featured by negativeB.
By separating the small-scale fluctuations of the original bathymetric data from large-scale landforms and quantifying the surface roughness of both,the multifractal features of the study area were attached to geomorphological characteristics.Both small-and large-scale components contribute toB,while the fluctuations ofBare attributed mostly to the changes in small-scale roughness.α0reflects the large-scale topographic trends since the parameter correlates well with the roughness of large-scale landforms.The relatively weak multifractality and high correlation betweenα0of small-and large-scale components in L1 explain the special cause of multifractality in this zone.
As methodology and DEM resolution both have strong influence on the results of multifractal analysis,other multifractal methods,as well as two-dimensional MFDFA should be realized,and procedures of error estimating should be established based on the grid resolution of DEMs in further studies.More specificdata are demanded to model the evolution of local topography and to verify the presumptions about geomorphological processes in our research.Further studies could also be focused on the comparative study of multifractal characteristics between seamounts and other analogue volcanic topography,to explore the discrepancy of geomorphological processes triggered by distinct forces in different environments.In addition,studies on multifractal characteristics of seamounts will benefit the research on ocean bottom circulations and seamount ecosystems.
6 DATA AVAILABILITY STATEMENT
The data that support the findings of this study are available from the corresponding author upon reasonable request.
7 ACKNOWLEDGMENT
We thank the support from the Center for Ocean Mega-Science,Chinese Academy of Sciences,Qingdao,China.All the data and samples were collected onboard R/VKexue.Thank the precious advice given by the two anonymous reviewers.
 Journal of Oceanology and Limnology2021年5期
- Journal of Oceanology and Limnology的其它文章
- Screening of stable internal reference genes by quantitative real-time PCR in humpback grouper Cromileptes altivelis*
- Geochemical characteristics and geological implication of ferromanganese crust from CM6 Seamount of the Caroline Ridge in the Western Pacific*
- Deep-sea coral evidence for dissolved mercury evolution in the deep North Pacific Ocean over the last 700 years*
- Physical oceanography of the Caroline M4 seamount in the tropical Western Pacific Ocean in summer 2017*
- Characteristics and biogeochemical effects of oxygen minimum zones in typical seamount areas,Tropical Western Pacific*
- Analysis of differences in nutrients chemistry in seamount seawaters in the Kocebu and M4 seamounts in Western Pacific Ocean*
