城市化影响杭州城市热环境的数值模拟研究
张 含,张小伟,樊高峰
城市化影响杭州城市热环境的数值模拟研究
张 含,张小伟,樊高峰*
(1.浙江省气候中心,浙江 杭州 310052)
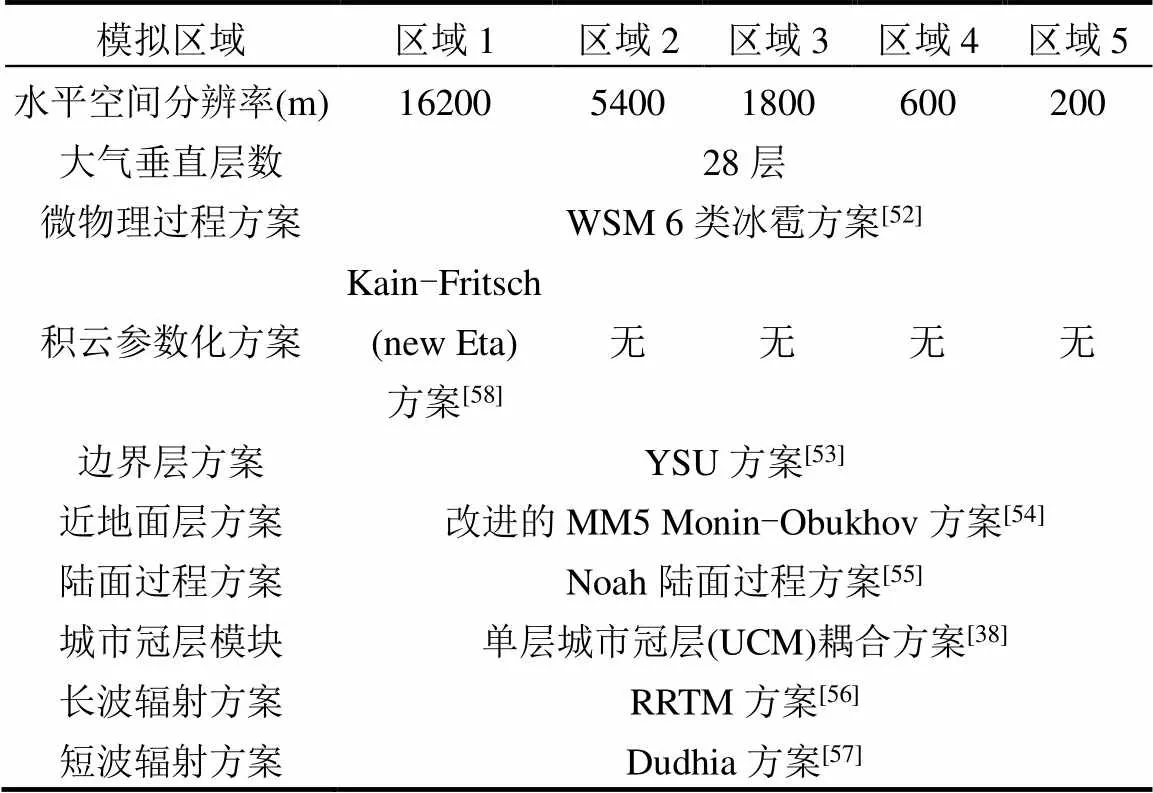
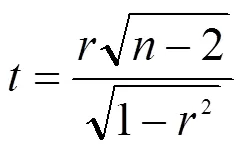
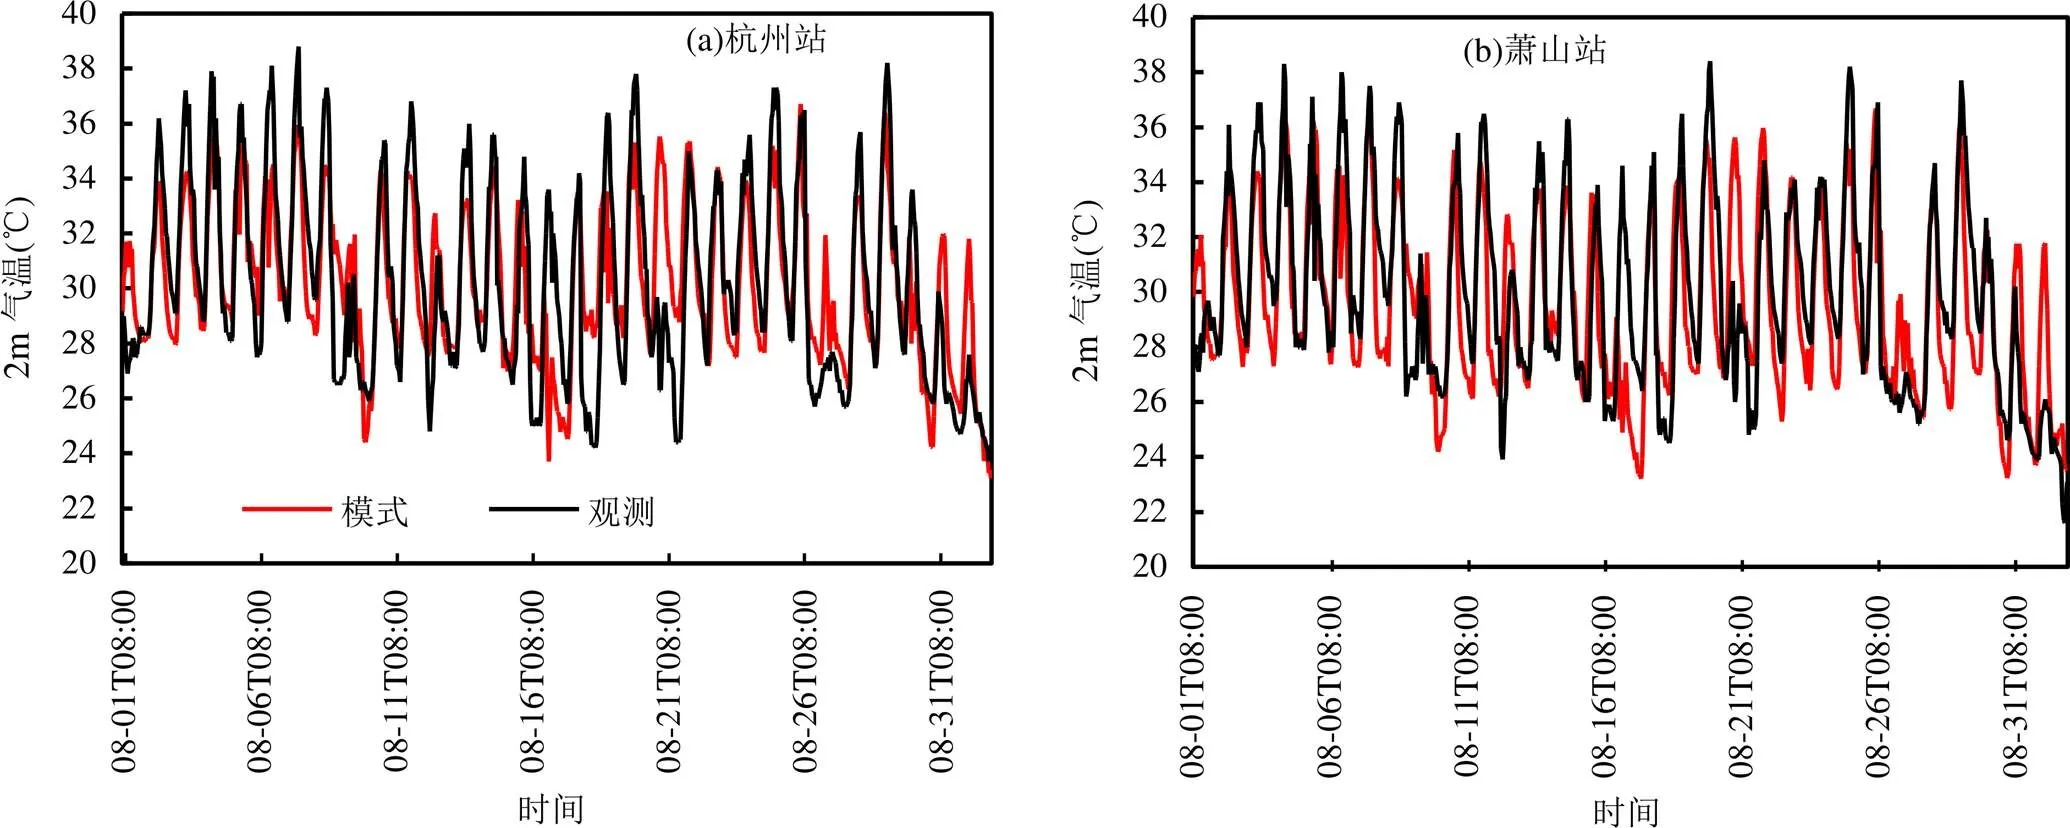
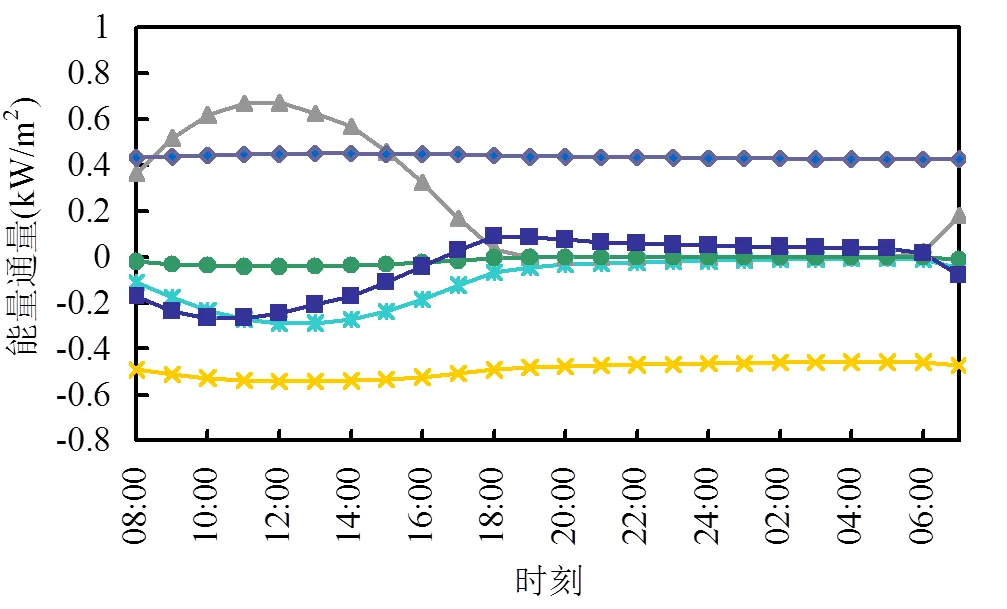
通过对城市区域的气候要素进行精细化数值模拟,可以研究城市化对城市热环境的重要影响.利用WRF/UCM模式,以杭州为例,通过采用不同的下垫面土地利用分类数据,分析量化历史城市化进程对月尺度城市热环境的影响,并进一步设计了敏感性模拟试验,研究杭州地区在理想化条件下城区面积增加约2倍时,城市热环境的变化情况.模拟结果表明,杭州地区在2010~2017年的城市化进程中,城区面积约增加了1倍,导致8月热岛强度等级高于”无”(Ht>0.5℃)的区域扩大了91%,且主城区的2m平均气温增加了0.4℃,但中心城区热岛强度等级没有明显提升.杭州城区面积在2017年基础上约增加2倍时,8月热岛强度等级高于”无”的区域扩大157%,1846.4km2的中心城区热岛强度等级由”弱”或”无”(Ht≤1.5℃)提升为”中等”(1.5 城市化;城市气候学;城市热岛;数值模拟 人口和经济的快速增长导致了大规模的城市化现象[1-2].城市区域建筑材料引起的地表储热能力和导热性的增强,加上建筑垂直方向的结构特征,以及人类活动放出的热量,导致城区地表储存了更多的能量[3-5].这种城区与郊区地表热量平衡特征的差异,会导致城区大气及地表温度高于周边郊区,产生”城市热源”[4,6],这种现象被称为城市热岛效应(UHIE).城市热岛效应所引起的城市区域增温现象,可导致城市热环境变化,提高城市极端高温天气出现的可能性,从而增加气候风险,影响生态环境质量、人体舒适度和健康[7-11].近年来,随着城市化进程的加快,城市热岛问题也越来越突出. 预测城市热环境变化和预防高温灾害的需要,引起了学者们对城市热岛效应的研究热情.一些研究利用统计模型处理站点观测资料[7-11],以及遥感影像反演[16-21]等方法来分析城市化对城市热环境的影响.虽然统计方法可以用于对城市热岛区域的时空分布和影响因素的分析,但站点观测资料的空间分辨率有限,不能很好地满足城市尺度气候要素变化的精细化研究需求.遥感影像只能反演出地表温度,而不是与人体舒适度和城市区域气候直接相关的近地表气温,这两个变量场虽相似但有实际差别[22-23];且遥感影像资料受限于其采集频率,在时间分辨率上不能很好地满足城市热环境变化的精细化研究需求.因此,利用数值模式对城市区域的中尺度天气系统和气候要素进行精细化模拟成为了城市热环境和城市气候系统领域很重要的研究方法. 近年来,一些研究利用数值模式进行模拟试验,考察了城市化对城市热环境的重要影响.例如,Jiang等[24]利用TEB-RAMS (Town Energy Budget- Regional Atmosphere Modeling System)模式模拟了北京城区2003年7月2日的热岛状况(空间分辨率为1km),模拟得到的2m气温与观测具有良好的相符性.Jiang等[24]的模拟结果显示,城市化造成的下垫面土地利用类型改变对城市热岛的形成有关键作用.Morris等[25-26]利用WRF模式(Weather Research and Forecasting Model)评估了马来西亚布城(Putrajaya)和巴生谷(Klang Valley)的城市热岛状况,研究结果显示城市下垫面状况对城市区域气候有重要作用,并且夜间的热岛效应比日间更明显.前人的相关数值模拟研究通常针对某次天气过程,较少有模拟时间超过一个月、可以反映月际及更长时间尺度气候变化情况的研究[27-32].并且前人相关研究大多仅关注历史上的天气个例过程,忽略了未来可能的城市化对城市热环境的影响. 在前人研究的基础上,本研究利用中尺度天气模式,设计一系列敏感性模拟试验,进一步对不同下垫面条件下,月尺度气候的变化情况进行定量研究.首先,利用2010~2017年的下垫面分类资料进行模拟试验,以研究历史城市化进程对区域气候的影响,同时将模拟结果与气象观测站的历史资料进行对比,以验证模拟结果的可靠性.在分析历史城市化进程对城市热环境影响的基础上,设计了敏感性模拟试验,研究杭州地区在理想化条件下城区面积增加约2倍时,城市化进程对城市热环境的潜在影响.同时,对比不同模拟试验结果中地表能量平衡的差异,分析城市热环境的形成机制.本研究结果可对城市热环境和城市气候系统领域的相关模式模拟研究等提供参考.另外,杭州作为浙江的省会城市,是华东沿海地区最发达、人口密度最大、城市化最集中的地区之一,且还具有较大的发展空间[33-34].因此,本研究以杭州为例进行城市化对城市热环境的影响研究,也对其它城市的城市化发展规划具有其参考价值和现实意义.对城市热环境变化影响因素的精细化研究,有助于更好地预测未来的城市高温灾害与气候系统变化情况,做好防灾减灾工作. 使用的模式为中尺度天气模式WRF (Weather Research and Forecasting Model) 3.6.1版本[35].WRF模式的开发始于20世纪90年代后期,由美国大气科学研究中心(NCAR)、美国国家海洋和大气管理局(NOAA)、俄克拉荷马大学、联邦航空局(FAA)等机构联合开发,现已被广泛应用于生态、水文和大气科学许多领域的研究和业务中. 为了研究城市化进程对城市热环境的影响,模拟试验激活了WRF中的单层UCM (Urban Canopy Model)城市冠层模块.这里的单层UCM模式最初由Kusaka等[36]开发,由Kusaka等[37]改进,并在此基础上,被耦合到了v2.2及以后版本的WRF模式中[38].这里的UCM城市冠层模块主要包括以下几个部分:(1)描述城市几何特征的街道峡谷参数化方案,(2)建筑阴影及冠层反射辐射,(3)街道峡谷朝向及太阳方位角日变化,(4)包含八种街道峡谷(不同朝向)的下垫面,(5)Inoue的冠层流场模式[39],(6)建筑物顶、墙体与道路表面温度的多层热量方程,(7)人类活动消耗能量造成的加热效应,(8)一个描述水文过程的简单水箱模型等[38].由此,UCM模块可以模拟建筑物顶、墙体及道路表面的热量通量及表面温度,并计算城市表面与大气之间的能量与动量交换. UCM模式已在针对许多城市的模拟研究中成功应用并得到评估,这些城市包括日本的东京[37]、美国奥克拉荷马州的奥克拉荷马[40]、马来西亚的布城和巴生谷[25-26]以及中国的北京-天津-河北都市圈[41-42]和南京[43]等.另外,有关城市热环境等方面的研究显示,WRF/UCM模式对城市下垫面主要特征能进行较好的描述,模拟结果与观测具有良好的相符性[24-25,44-47].通过在中尺度天气模式中耦合UCM模式并进行敏感性模拟试验,有助于更好地研究城市热环境变化及其热力学与动力学机制. 1.2.1 格点数据 GFS(Global Forecast System全球预报系统)分析场数据[48].GFS是NCEP(National Centers for Environmental Prediction,美国国家环境预报中心)开发的天气预报模式,可提供大气和土壤中的许多气候要素数据,包括温度、风场、降水和土壤湿度等.本研究中所使用的GFS数据为模拟时段(2017年7月31日~8月31日,北京时,下同)的分析场资料,其水平空间分辨率为0.5°×0.5°,时间分辨率为6h.该GFS分析场资料经WRF的WPS(WRF Preprocessing System)前处理模块处理后,为模拟试验提供了初始条件和边界条件. 图1 模拟区域 图中(b)显示了杭州站、萧山站、余杭站和富阳站4个国家一般气象站、(c)显示了其他52个区域自动气象站的位置分布 1.2.2 下垫面数据 对应于模式模拟中不同嵌套区域的不同分辨率下垫面数据.模拟所使用的下垫面数据,包括了WRF模式自带的2min和30s分辨率的高程数据、土地利用分类数据和土壤分类数据[49].另外,还利用了浙江地区3s分辨率的高程数据[50],以及500m分辨率的MODIS (Moderate Resolution Imaging Spectroradiometer,中分辨率成像光谱仪)逐年土地分类数据[51].并且,本研究还针对模拟区域的实际情况对土地利用分类数据进行了人工修正. 1.2.3 气象站观测数据 杭州站(区站号:58457,经纬度:120.17°E,30.23°N)、萧山站(区站号:58459,经纬度:120.28°E,30.18°N)、余杭站(区站号:58444,经纬度:120.28°E,30.42°N)和富阳站(区站号:58449,经纬度:119.95°E,30.05°N)4个国家一般气象站和52个区域自动气象站的2m高度气温数据(数据来源:浙江省气候中心,图1b, c).利用56个站点在模拟时段逐小时平均的2m气温数据,将模式模拟结果与观测数据进行对比,以检验WRF/UCM模式的模拟效果. 利用WRF/UCM模式进行了3组模拟试验(表1,试验Geo_10, Geo_17与Ideal_urb).所有模拟试验采用相同的5层嵌套网格方案,模拟区域如图1所示,模拟所使用的GFS分析场时段均为2017年7月31日~8月31日.3组模拟试验使用相同的GFS分析场生成的初始场和边界条件(1.2.1节). 表1 模拟试验方案设计 图2 试验Geo_10,Geo_17,和Ideal_urb的下垫面土地利用主要分类情况 图中(a, c, e)的模拟区域为区域4,(b, d, f)的模拟区域为区域5 如表1所示,模拟试验Geo_10和Geo_17分别利用了2010年和2017年的土地利用分类数据,杭州地区2010~2017年间的城市化进程中,在图2(a, c)所示的区域,下垫面土地利用类型为城市的区域面积增加了约1倍.模拟试验Ideal_urb所使用的下垫面土地利用分类数据,表示了一种理想化的高度城市化状况,即在2017年的城市化状况基础上,在图2(c, e)所示的区域,下垫面土地利用类型为城市的区域面积增加了约2倍.因此,通过分别对比Geo_10和Geo_17,以及Geo_17和Ideal_urb的模拟试验结果,可以研究模拟区域2010年至2017年(城区面积增加约1倍),以及理想化的高度城市化(城区面积在2017年基础上再增加约2倍)对城市热环境的影响. 3组模拟试验的其他主要参数设置见表2.模拟试验选择的主要物理过程参数化方案包括:WSM (WRF Single-Moment)6类冰雹微物理过程方案[52], YSU (Yonsei University)边界层方案[53],改进的MM5 (Mesoscale Model 5)Monin-Obukhov近地面层方案[54], Noah陆面过程方案[55],单层城市冠层(UCM)耦合方案[38], RRTM (Rapid Radiative Transfer Model)长波辐射方案[56], Dudhia短波辐射方案[57].模式最外层(区域1)采用了Kain-Fritsch (new Eta)积云参数化方案[58],内层没有采用积云参数化方案. 表2 模拟试验主要参数设置 图3为2017年8月杭州站、萧山站、余杭站和富阳站观测和模拟(试验Geo_17,见1.3节)得到的2m高度逐小时平均气温变化时间序列.对比结果表明,WRF/UCM模式的模拟结果与观测数据具有良好的相符性.模式能够较好地模拟出气温的日变化特征,以及月际气温的整体变化趋势. 图4显示了2017年8月杭州主城区的气象站[56个站点,见1.2节(3)]观测和模式模拟(试验Geo_ 17)得到的2m高度平均气温的空间分布情况.对比结果表明,不论是对于8月份的全时段平均、日间或夜间平均,WRF/UCM模式均能够较好地模拟出气温的空间分布情况. 杭州地区在2010~2017年的城市化进程中,在图2(a, c)所示的区域,城区面积扩大了约1倍(见1.3节).对比模拟得到的2010年和2017年8月2m高度平均气温的分布图[图5和图6中的(a, b, c)与(d, e, f)],可以发现,在相同的大气背景场条件下[2017年8月GFS资料,见1.2节(1)],杭州地区在2010~2017年间的城市化进程造成了模拟区域8月平均气温的明显升高. 图4 2017年8月区域5的气象观测站和模式模拟(试验Geo_17)得到的2m高度平均气温分布 图5 试验Geo_10, Geo_17,和Ideal_urb中,区域4的8月2m高度平均气温分布 图6 试验Geo_10, Geo_17,和Ideal_urb中,区域5的8月2m高度平均气温分布 分析图6所示的主城区的热环境变化情况.该模拟区域的2m平均气温在试验Geo_10中为29.6℃,在试验Geo_17中则增加至30.0℃(增加约0.4℃)(图6a, d).该模拟区域中,2m平均气温高于30℃的区域面积由235.6km2(试验Geo_10)扩大至468.3km2(试验Geo_17),增加了99%(图6a, d).并且,与试验Geo_10相比,试验Geo_17中,该模拟区域日间(07:00~18:00)的2m平均气温从31.6℃增加至31.9℃(增加约0.3℃)(图6b, e),夜间(19:00~次日06:00)的2m平均气温从27.6℃增加至28.1℃(增加约0.5℃)(图6c, f).因此,不论是对于8月份的全时段平均、日间或夜间平均,2010~2017年间的城市化进程均使模拟区域的2m平均气温明显升高,高温区域明显扩大,且夜间的增温趋势强于日间. 分析2010~2017年杭州地区城市化进程对热岛强度的影响.将远离城市的农田地区2m平均气温作为郊区气温,将模拟区域内2m气温与郊区气温的差值定义为热岛强度(Ht).目前,根据气温定义的热岛强度还没有统一的分级标准,参考相关文献,将热岛强度分为无、弱、中等、强、极强五个级别(表3)[59-60].根据以上标准,计算得到图7(a~f)所示的试验Geo_ 10和Geo_17模拟区域8月平均热岛强度分布. 图7(a, d)表明,在试验Geo_10和Geo_17中,杭州部分中心城区的8月平均热岛强度等级为”弱(0.5 在理想化试验Ideal_urb中,在图2(c, e)所示的区域,杭州地区的城区面积在2017年的基础上扩大了约2倍(见1.3节).对比模拟得到的2017年和高度城市化后8月2m平均气温的分布图[图5和图6中的(d, e, f)与(g, h, i)],可以发现,在相同的大气背景场条件下[2017年8月GFS资料,见1.2节(1)],杭州地区理想化的高度城市化将造成模拟区域8月平均气温的明显升高. 图6表明,该模拟区域的2m平均气温在试验Geo_17中为30.0℃,在试验Ideal_urb中则增加至30.6℃(增加约0.6℃)(图6d, g).该模拟区域中,2m平均气温高于30℃的区域面积由468.3km2(试验Geo_17)扩大至661.1km2(试验Ideal_urb),增加了约41%(图6d, g).并且,与试验Geo_17相比,试验Ideal_urb中,该模拟区域日间(07:00~18:00)的2m平均气温从31.9℃增加至32.3℃(增加约0.4℃)(图6e, h),而夜间(19:00~次日06:00)的2m平均气温从28.1℃增加至29.0℃(增加约0.9℃)(图6f, i).因此,不论是对于8月份的全时段平均、日间或夜间平均,该理想化的高度城市化均可能使模拟区域的2m平均气温明显升高,高温区域明显扩大,且夜间的增温趋势强于日间. 表3 城市热岛强度分级标准 根据热岛强度及其分级标准(表3),计算得到图7(d~i)所示的试验Geo_17和Ideal_urb模拟区域8月平均热岛强度分布.在图7所示的区域,与试验Geo_17相比,试验Ideal_urb中城区面积扩大了约208%,而模拟区域中平均热岛强度等级高于”无”的区域面积由1225.4km2扩大至3145.0km2,扩大了157%,且有1846.4km2的中心城区热岛强度等级由”弱”或”无”提升为”中等”(图7d, g).因此,城区面积扩大约2倍对杭州地区热岛强度的影响,不仅体现在城区扩大导致的热岛区域范围扩大,还体现在中心城区热岛强度等级的提升.另外,与试验Geo_17相比,试验Ideal_urb中,该模拟区域日间(07:00~18:00)平均热岛强度等级高于”弱”的区域面积增加了1613.8km2(1156.0~2769.8km2),而夜间(19:00~次日06:00)平均热岛强度等级高于”弱”的区域面积增加了2026.4km2(1634.4~3660.8km2).因此,城区面积扩大约2倍的高度城市化使模拟区域8月日间和夜间的热岛区域均明显扩大,热岛强度明显增强,且夜间的增强趋势强于日间. 图7 试验(a, b, c)Geo_10,(d, e, f)Geo_17,和(g, h, i)Ideal_urb中,区域4的8月平均热岛强度分布 图中所示均为8月区域4的平均值,正值代表能源,负值代表能汇 地表能量平衡的分析可探究城市热环境的形成机制(图8).试验Geo_17中,在图2(c)所示区域中的城区地表,日间主要的能量来源为太阳短波辐射,平均值在午间12:00为最大,达0.67kW/m2;感热和土壤热通量则为主要的能汇,最大值分别为-0.29kW/m2和-0.27kW/m2.日间的土壤热通量基本与短波辐射吸收同步变化,感热通量则相对滞后.在夜间,土壤热通量成为主要的能量来源.净长波辐射通量在一天之中均表现为能汇,平均值在午间12:00最大,为0.092kW/m2. 图8显示,在试验Geo_17中,对城区和郊区地表能量平衡差异影响最大的是日间的潜热通量,平均差值在午间12:00为最大,达0.31kW/m2.这是由于相较于郊区,城区下垫面缺少植被,水汽蒸腾作用较小,因此城区日间潜热释放较少.在夜间,相较于郊区,城区的土壤热源和感热释放较多,表明城区下垫面使土壤保留了更多的热量,并以感热形式向大气释放,维持城区夜间的热岛效应.在试验Ideal_urb中,城区和郊区地表能量平衡的差异与试验Geo_17相似,且潜热通量在城区和郊区表现出更大差异,最大差值达0.33kW/m2(图8).另外,城区比郊区在日间吸收更多的短波辐射,这是由于城区与郊区相比,下垫面的地表反射率较小,有利于吸收更多的热量,且该特征在试验Ideal_urb中比Geo_17中更明显,导致试验Ideal_urb中热岛强度更强. 本研究利用WRF/UCM模式,进行一系列敏感性模拟试验,量化研究城市化进程对杭州城市热环境的影响. 研究结果表明,杭州地区在2010~2017年间的城市化进程中,城区面积约增加了1倍.城区面积增加约1倍对杭州地区城市热环境的影响,主要体现在城区扩大导致的热岛区域范围扩大,但中心城区热岛强度等级并没有明显的提升.这可能可以归功于在这7年间,杭州的城市规划对绿地系统的设置给予了充分考虑,因此在杭州的快速城市化进程中,仍保持中心城区热岛强度等级没有明显提升.杭州地区理想化的高度城市化进程中,城区面积在2017年基础上增加了约2倍.城区面积扩大约2倍对杭州地区城市热环境的影响,不仅体现在城区扩大导致的热岛区域范围扩大,还体现在中心城区热岛强度等级的提升. 若未来的城市化进程进一步加快并向高度城市化的方向发展,则中心城区的热岛强度将可能有较大提升,增加极端高温灾害发生的可能性,影响城市生态系统.建议在未来的城市规划方案制定过程中,对生态绿地系统、通风廊道等的设置给予足够的重视,尽量减少城市化对城市热环境和城市生态系统造成的不利影响.另外,模拟结果表明,城市化进程导致的杭州主城区的升温、热岛区域范围的扩大或热岛强度的增强趋势,在夜间都比日间更为明显.这一方面是由于城区建筑材料等热力性质(如热容量、热传导率等)与郊区有很大差异[61],使城区下垫面土壤保留更多能量,在夜间以感热形式持续向大气释放;另一方面是由于相比日间,夜间的大气层结更为稳定,热量的扩散较弱,而城市化进程则进一步减弱了夜间的风场,阻止了夜间城区热量的扩散[27]. 除了城市化进程,还有许多因素会对城市热环境产生影响,如水体、地形、城区建筑结构等等[62-63].在下一步的研究中,可以对更多不同城市热环境的影响因子进行研究和比较,分析对比不同影响因子的重要性.不同的城市下垫面(如工业/居民用地等)的热力性质差异也可能对城市热环境产生重要影响[64-65].在下一步的研究中,可以利用模式进行敏感性模拟试验,探究不同城市土地利用类型对城市热环境的潜在影响.另外,本研究选取了夏季作为气候背景场,以分析城市化进程对夏季高温灾害风险的重要影响.在下一步的研究中,可以选取不同季节的背景场进行敏感性模拟试验,比较在不同气候背景场条件下,城市化进程对城市热环境的影响. 本研究利用中尺度天气模式,对城市热环境变化进行精细化模拟,量化分析了城市化进程对城市热环境的潜在重要影响.为了更好地理解影响城市热环境的重要机制,还需要进一步相关的外场观测及数值模式模拟研究等,这对更好地预测未来城市热环境变化、区域极端高温灾害等具有重要意义,并为人类活动与城市气候系统相互作用机制的研究与应用提供理论依据. 4.1 杭州地区在2010~2017年间的城市化进程中,城区面积约增加了1倍,导致杭州主城区8月平均气温明显升高,高温区域明显扩大,但中心城区热岛强度等级并没有明显的提升.例如,这7年间的城市化进程使杭州主城区(图6)的2m平均气温增加了0.4℃,2m平均气温高于30℃的区域面积增加了99%,热岛强度高于”无”的区域扩大了91%,但中心城区热岛强度仍基本保持在”弱”的等级. 4.2 杭州城区面积在2017年基础上增加约2倍时,杭州主城区8月平均气温的明显升高,高温区域明显扩大,且热岛强度增强.如,高度城市化可使杭州主城区(图6)的2m平均气温增加0.6℃,2m平均气温高于30℃的区域面积增加192.8km2,热岛强度高于”无”的区域扩大157%,且有1846.4km2的中心城区热岛强度等级由”弱”或”无”提升为”中等”.对比城区面积扩大1倍和2倍的模拟结果显示,城区和热岛区域面积的扩大不是等比例的. 4.3 城市化对杭州地区热环境的影响,主要归因于城区下垫面缺少植被,水汽蒸腾作用较小,因此潜热释放较少;且城区下垫面地表反射率较小,吸收了更多太阳短波辐射.城区和郊区的能量平衡差异在夜间更为显著,因此城市化进程导致的杭州主城区的升温、热岛区域范围的扩大或热岛强度的增强趋势,在夜间都比日间更为明显. [1] Martine G, Deligiorgis D, Fuersich C, et al. State of the world population 2007: Unleashing the potential of urban growth [M]. New York: United Nations Population Fund, 2007. [2] 雷金睿,陈宗铸,吴庭天,等.1989~2015年海口城市热环境与景观格局的时空演变及其相互关系 [J]. 中国环境科学, 2019,39(4):1734- 1743. Lei J R, Chen Z Z, Wu T T, et al. Spatio-temporal evolution and interrelationship between thermal environment and landscape patterns of Haikou City, 1989~2015 [J]. China Environmental Science, 2019, 39(4):1734-1743. [3] Oke T R. Boundary layer climates [M]. London and New York: Routledge, 1987. [4] Manley G. On the frequency of snowfall in metropolitan England [J]. Quarterly Journal of the Royal Meteorological Society, 1958,84(359): 70-72. [5] 侯春华,李富平,谷海红,等.矿业密集区地表热环境时空异质性驱动机理 [J]. 中国环境科学, 2021,41(2):872-882. Hou C H, Li F P, Gu H H, et al. The spatiotemporal heterogeneity and driving forces of surfacial thermal environment over an intensive mining region [J]. China Environmental Sciences, 2021,41(2):872- 882. [6] 潘明慧,兰思仁,朱里莹,等.景观格局类型对热岛效应的影响——以福州市中心城区为例 [J]. 中国环境科学, 2020,40(6):2635-2646. Pan M H, Lan S R, Zhu L Y, et al. Influence of landscape pattern types on heat island effect over central Fuzhou City [J]. China Environmental Science, 2020,40(6):2635-2646. [7] Fang X Y, Jiang W M, Miao S G, et al. The multi-scale numerical modeling system for research on the relationship between urban planning and meteorological environment [J]. Advances in Atmospheric Sciences, 2004,21(1):103-112. [8] Ren G Y, Zhou Y Q. Urbanization effect on trends of extreme temperature indices of national stations over mainland China, 1961~2008 [J]. Journal of Climate, 2014,27(6):2340-2360. [9] Ren G, Li J, Ren Y Y, et al. An integrated procedure to determine a reference station network for evaluating and adjusting urban bias in surface air temperature data [J]. Journal of Applied Meteorology and Climatology, 2015,54(6):1248-1266. [10] Mahmoud S H, Gan T Y. Long-term impact of rapid urbanization on urban climate and human thermal comfort in hot-arid environment [J]. Building and Environment, 2018,142:83-100. [11] 陈伯民,曾智华.上海"0185"特大暴雨过程中"城市热岛"的作用 [R]. 北京:中国气象学会, 2003. Chen B M, Zeng Z H. Effects of "urban heat island" on Shanghai "0185" torrential rainstorm [R]. Beijing: Chinese Meteorological Society, 2003. [12] Chen X, Jeong S J. Shifting the urban heat island clock in a megacity: a case study of Hong Kong [J]. Environmental Research Letters, 2018,13(1):14014. [13] Liao W L, Liu X P, Li D, et al. Stronger contributions of urbanization to heat wave trends in wet climates [J]. Geophysical Research Letters, 2018,45(20):11310-11317. [14] Guan H D, Vinodkumar, Clay R, et al. Temporal and spatial patterns of air temperature in a coastal city with a slope base setting [J]. Journal of Geophysical Research-Atmospheres, 2016,121(10):5336-5355. [15] Peng S J, Feng Z L, Liao H X, et al. Spatial-temporal pattern of, and driving forces for, urban heat island in China [J]. Ecological Indicators, 2019,96(1):127-132. [16] Zhang Y, Jiang P, Zhang H Y, et al. Study on urban heat island intensity level identification based on an improved restricted Boltzmann machine [J]. International Journal of Environmental Research and Public Health, 2018,15(2):186. [17] Silva J S, Da Silva R M, Guimaraes Santos C A. Spatiotemporal impact of land use/land cover changes on urban heat islands: A case study of Paco do Lumiar, Brazil [J]. Building and Environment, 2018,136:279-292. [18] Lin Y, Jim C Y, Deng J S, et al. Urbanization effect on spatiotemporal thermal patterns and changes in Hangzhou (China) [J]. Building and Environment, 2018,145:166-176. [19] Yao R, Wang L, Huang X, et al. Interannual variations in surface urban heat island intensity and associated drivers in China [J]. Journal of Environmental Management, 2018,222:86-94. [20] Wang J, Huang B, Fu D J, et al. Response of urban heat island to future urban expansion over the Beijing-Tianjin-Hebei metropolitan area [J]. Applied Geography, 2016,70:26-36. [21] 赵安周,裴 韬,曹 森,等.京津冀城市扩张对植被和地表城市热岛的影响 [J]. 中国环境科学, 2020,40(4):1825-1833. Zhao A Z, Pei T, Cao S, et al. Impacts of urbanization on vegetation growth and surface urban heat island intensity in the Beijing-Tianjin- Hebei [J]. China Environmental Science, 2020,40(4):1825-1833. [22] Gallo K, Hale R, Tarpley D, et al. Evaluation of the relationship between air and land surface temperature under clear- and cloudy-sky conditions [J]. Journal of Applied Meteorology and Climatology, 2011, 50(3):767-775. [23] 钱敏蕾,徐艺扬,李 响,等.上海市城市化进程中热环境响应的空间评价 [J]. 中国环境科学, 2015,35(2):624-633. Qian M L, Xu Y Y, Li X, et al. An assessment of spatial thermal environmental response to rapid urbanization of Shanghai [J]. China Environmental Science, 2015,35(2):624-633. [24] Jiang L, Lu L X, Jiang L M, et al. Impact of a detailed urban parameterization on modeling the Urban Heat Island in Beijing using TEB-RAMS [J]. Advances in Meteorology, 2014,2014:602528. [25] Morris K I, Salleh S A, Chan A, et al. Computational study of urban heat island of Putrajaya, Malaysia [J]. Sustainable Cities and Society, 2015,19:359-372. [26] Morris K I, Chan A, Morris K J K, et al. Urbanisation and urban climate of a tropical conurbation, Klang Valley, Malaysia [J]. Urban Climate, 2016,19:54-71. [27] Grossman-Clarke S, Zehnder J A, Loridan T, et al. Contribution of land use changes to near-surface air temperatures during recent summer extreme heat events in the Phoenix Metropolitan area [J]. Journal of Applied Meteorology and Climatology, 2010,49(8):1649- 1664. [28] 郑祚芳,高 华,王在文,等.城市化对北京夏季极端高温影响的数值研究 [J]. 生态环境学报, 2012,21(10):1689-1694. Zheng Z F, Gao H, Wang Z W, et al. Numerical simulation for the urbanization effects on a heat wave event around Beijing city [J]. Ecology and Environmental Sciences, 2012,21(10):1689-1694. [29] Tse J W P, Yeung P S, Fung J C, et al. Investigation of the meteorological effects of urbanization in recent decades: A case study of major cities in Pearl River Delta [J]. Urban Climate, 2018,26:174- 187. [30] 吴 佳,高学杰,张冬峰,等.三峡水库气候效应及2006年夏季川渝高温干旱事件的区域气候模拟 [J]. 热带气象学报, 2011,27(1):44-52. Wu J, Gao X J, Zhang D F, et al. Regional climate model simulation of the climate effects of the Three Gorge reservoir with specific application to the summer 2006drought over the Sichuan-Chongqing area [J]. Journal of Tropical Meteorology, 2011,27(1):44-52. [31] 房小怡,王晓云,杜吴鹏,等.我国城市规划中气候信息应用回顾与展望 [J]. 地球科学进展, 2015,30(4):445-455. Fang X Y, Wang X Y, Du W P, et al. The application of climate information in urban planning in China: Retrospect and future prospect [J]. Advances in Earth Science, 2015,30(4):445-455. [32] 于玲玲,潘蔚娟,肖志祥,等.人为热对广州高温天气影响的数值模拟个例分析 [J]. 中国环境科学, 2020,40(9):3721-3730. Yu L L, Pan W J, Xiao Z X, et al. Case studies of impacts of anthropogenic heat emissions on heat wave events in Guangzhou [J]. China Environmental Science, 2020,40(9):3721-3730. [33] Wei Y H D. Restructuring for growth in urban China: Transitional institutions, urban development, and spatial transformation [J]. Habitat International, 2012,36(3):396-405. [34] Shen T, Chow D H C, Darkwa J. Simulating the influence of microclimatic design on mitigating the urban heat island effect in the Hangzhou Metropolitan Area of China [J]. International Journal of Low-Carbon Technologies, 2016,11(1):130-139. [35] Skamarock W C, Klemp J B, Dudhia J, et al. A Description of the Advanced Research WRF Version 3 [R]. Boulder, Colorado, USA: National Center for Atmospheric Research, Mesoscale and Microscale Meteorology Division, 2008. [36] Kusaka H, Kondo H, Kikegawa Y, et al. A simple single-layer urban canopy model for atmospheric models: comparison with multi-layer and slab models [J]. Boundary-Layer Meteorology, 2001,101(3):329- 358. [37] Kusaka H, Kimura F. Thermal effects of urban canyon structure on the nocturnal heat island: numerical experiment using a mesoscale model coupled with an urban canopy model [J]. Journal of Applied Meteorology, 2004,121(9):4487-4498. [38] Kusaka H, Chen F, Bao J W, et al. Simulation of the urban heat island effects over the Greater Houston Area with the high resolution WRF/LSM/Urban coupled system [R]. Seattle, WA, 2004. [39] Inoue E. On the turbulent structure of airflow within crop canopies [J]. Journal of the Meteorological Society of Japan, 1963,41:317-326. [40] Liu Y B, Chen F, Warner T, et al. Verification of a mesoscale data- assimilation and forecasting system for the Oklahoma City area during the joint urban 2003 field project [J]. Journal of Applied Meteorology and Climatology, 2006,45(7):912-929. [41] Wang M N, Zhang X Z, Yan X D. Modeling the climatic effects of urbanization in the Beijing-Tianjin-Hebei metropolitan area [J]. Theoretical and Applied Climatology, 2013,113(3/4):377-385. [42] Wang M N, Yan X D, Liu J Y, et al. The contribution of urbanization to recent extreme heat events and a potential mitigation strategy in the Beijing-Tianjin-Hebei metropolitan area [J]. Theoretical and Applied Climatology, 2013,114(3/4):407-416. [43] Yang B, Zhang Y C, Qian Y. Simulation of urban climate with high-resolution WRF model: A case study in Nanjing, China [J]. Asia-Pacific Journal of Atmospheric Sciences, 2012,48(3):227-241. [44] Morris K I, Chan A, Morris K J K, et al. Impact of urbanization level on the interactions of urban area, the urban climate, and human thermal comfort [J]. Applied Geography, 2017,79:50-72. [45] 蒙伟光,张艳霞,李江南,等. WRF/UCM在广州高温天气及城市热岛模拟研究中的应用 [J]. 热带气象学报, 2010,26(3):273-282. Meng W G, Zhang Y X, Li J N, et al. Application of WRF/UCM in the simulation of a heat wave event and urban heat island around Guangzhou city [J]. Journal of Tropical Meteorology, 2010,26(3):273- 282. [46] Lee S H, Kim S W, Angevine W M, et al. Evaluation of urban surface parameterizations in the WRF model using measurements during the Texas Air Quality Study 2006 field campaign [J]. Atmospheric Chemistry and Physics, 2011,11(5):2127-2143. [47] Ooi M C G, Chan A, Ashfold M J, et al. Numerical study on effect of urban heating on local climate during calm inter-monsoon period in greater Kuala Lumpur, Malaysia [J]. Urban Climate, 2017,20:228- 250. [48] GFS-ANL. Global forecast system analysis datasets [EB/OL]. https://www.ncdc.noaa.gov/data-access/model-data/model-datasets/global-forcast-system-gfs. 2017 [2018-11]. [49] Wang W, Bruyère C, Duda M, et al. WRF ARW version 3 modeling system user's guide [EB/OL]. MMM, NCAR, 2015:428. [50] NASA. NASA shuttle radar topography mission 3 arc second [EB/OL]. https://dds.cr.usgs.gov/srtm/version2_1/Documentation/SRTM_Topo. pdf. 2013 [2018-11]. [51] MODIS. MODIS/terra+aqua land cover type yearly L3 global 500m SIN grid V006 [EB/OL]. https://search.earthdata.nasa.gov/. 2017 [2018-10]. [52] Hong S, Lim J J. The WRF single-moment 6-class microphysics scheme (WSM6) [J]. Asia-Pacific Journal of Atmospheric Sciences, 2006,42(2):129-151. [53] Hong S Y, Noh Y, Dudhia J. A new vertical diffusion package with an explicit treatment of entrainment processes [J]. Monthly Weather Review, 2006,134(9):2318-2341. [54] Jimenez P A, Dudhia J, Gonzalez-Rouco J F, et al. A revised scheme for the WRF surface layer formulation [J]. Monthly Weather Review, 2012,140(3):898-918. [55] Ek M B, Mitchell K E, Lin Y, et al. Implementation of Noah land surface model advances in the National Centers for Environmental Prediction operational mesoscale Eta model [J]. Journal of Geophysical Research-Atmospheres, 2003,108(D22):8851. [56] Mlawer E J, Taubman S J, Brown P D, et al. Radiative transfer for inhomogeneous atmospheres: RRTM, a validated correlated-k model for the longwave [J]. Journal of Geophysical Research-Atmospheres, 1997,102(D14):16663-16682. [57] Dudhia J. Numerical study of convection observed during the winter monsoon experiment using a mesoscale two-dimensional model [J]. Journal of the Atmospheric Sciences, 1989,46(20):3077-3107. [58] Kain J S. The Kain-Fritsch convective parameterization: An update [J]. Journal of Applied Meteorology, 2004,43(1):170-181. [59] 广东省气候中心.气候可行性论证技术指南系列之城市热岛效应评估技术指南 [Z]. 2014. Guangdong Climate Center. Technical guideline on climate feasibility justification - Technical guideline for the evaluation of Urban Heat Island Effect [Z]. 2014. [60] DB21/T 2016-2012 城市热岛强度等级 [S]. DB21/T 2016-2012 Urban heat island intensity levels [S]. [61] Oke T R. The energetic basis of the urban heat island [J]. Quarterly Journal of the Royal Meteorological Society, 1982,108:1-24. [62] 任 侠,王咏薇,张 圳,等.太湖对周边城市热环境影响的模拟 [J]. 气象学报, 2017,75(4):645-660. Ren X, Wang Y W, Zhang Z, et al. Simulation studies for Lake Taihu effect on surrounding cities thermal environment [J]. Acta Meteorologica Sinica, 2017,75(4):645-660. [63] 郝晓龙,王咏薇,胡 凝,等.太阳能光伏屋顶对城市热环境及能源供需影响的模拟 [J]. 气象学报, 2020,78(2):301-316. Hao X L, Wang Y W, Hu N, et al. Simulation of the influence of solar photovoltaic roof on urban thermal environment and energy supply and demand [J]. Acta Meteorologica Sinica, 2020,78(2):301-316. [64] 常 蓉.晋城市城区土地利用与地表温度的相关性研究[D]. 晋中:山西农业大学, 2016. Chang R. Research on the relationship between land use and land surface temperature in Jincheng District Area [D]. Jinzhong: Shanxi Agricultural University, 2016. [65] 费鲜芸,陈海燕,顾晶晶,等.土地利用类型及其单元绿地率与城市热岛效应相关性研究 [J]. 林业资源管理, 2015,(6):117-122. Fei X Y, Chen H Y, Gu J J, et al. The relationship between urban heat island and land use type and its unit greening rate [J]. Forest Resources Management [J]. 2015,(6):117-122. 浙江省网络中心的滕舟高级工程师、浙江省气象局观测与网络处的袁圣和杭州市气象信息中心的杨军高级工程师为本研究提供了数据支持,浙江大学地球科学学院的曹龙教授为本文的英文摘要、表题、图题等提供了指导与润色,在此对以上专家提供的帮助与技术支持表示诚挚的感谢. Simulated effect of urbanization on urban thermal environment in Hangzhou. ZHANG Han, ZHANG Xiao-wei, FAN Gao-feng* (Zhejiang Province Climate Center, Hangzhou 310017, China)., 2021,41(9):4107~4119 We conducted high-resolution model simulations in urban areas, to investigate the important effects of urbanization on urban thermal environment. The WRF/UCM model was used to quantify the effect of past urbanization on urban thermal environment at monthly timescale for Hangzhou city, Zhejiang province, China. We also conducted sensitivity simulations to investigate the potential effects of urbanization on urban thermal environment under an idealized scenario in which urban area is tripled. In these simulations, different land use/land cover classification data were used. Simulation results show that urbanization during 2010~2017 doubles urban area at Hangzhou, leading to a 91% increase in the area with urban heat island (UHI) intensity levels stronger than “none” (Ht>0.5℃), and a rise of 0.4℃ in 2-m air temperature in the main urban area in August. If urban area is tripled from year 2017 level, the area that UHI intensity levels stronger than “none” would increase by 157%, and for 1846.4km2of the central urban area, UHI intensity levels could be elevated from “weak” or “none” (Ht£1.5℃) to “medium” (1.5 urbanization;urban climatology;urban heat island;numerical modeling X16 A 1000-6923(2021)09-4107-13 张 含(1992-),女,浙江衢州人,工程师,博士,主要从事生态环境和气候变化研究.发表论文10篇. 2021-02-15 浙江省科技计划项目(2017C33072);浙江省基础公益研究计划(LGF18D050001,LQ20D050003);浙江省气象科技计划项目(2020YB04和2019ZD07);国家自然科学基金项目(42005027) * 责任作者, 正高级工程师, fangaofengcn@163.com1 材料与方法
1.1 模式介绍
1.2 资料简介

1.3 模拟试验


2 结果与分析
2.1 模式模拟结果与观测数据的对比

2.2 2010~2017年杭州地区城市化进程对城市热环境的影响


2.3 高度城市化对杭州地区城市热环境的潜在影响


2.4 城市化对杭州地区城市热环境的影响机制


3 讨论
4 结论

