Structural and electrical transport properties of charge density wave material LaAgSb2 under high pressure*
Bowen Zhang(张博文) Chao An(安超) Xuliang Chen(陈绪亮) Ying Zhou(周颖)Yonghui Zhou(周永惠) Yifang Yuan(袁亦方) Chunhua Chen(陈春华)Lili Zhang(张丽丽) Xiaoping Yang(杨晓萍) and Zhaorong Yang(杨昭荣)
1Anhui Province Key Laboratory of Condensed Matter Physics at Extreme Conditions,High Magnetic Field Laboratory,Chinese Academy of Sciences,Hefei 230031,China
2Science Island Branch,Graduate School of University of Science and Technology of China,Hefei 230026,China
3Information Materials and Intelligent Sensing Laboratory of Anhui Province,Institutes of Physical Science and Information Technology,Anhui University,Hefei 230601,China
4Key Laboratory of Structure and Functional Regulation of Hybrid Materials(Anhui University),Ministry of Education,Hefei 230601,China
5Shanghai Advanced Research Institute,Chinese Academy of Sciences,Shanghai 200031,China
6High Magnetic Field Laboratory of Anhui Province,Hefei 230031,China
Keywords: high pressure,charge density wave,crystal structure,electrical transport
1. Introduction
Rare-earth silver antimonidesRAgSb2(R=La-Nd,Sm,Gd-Tm) have attracted intense interests due to their peculiar physical properties,[1-11]such as anisotropic magnetism,[2,3]Dirac-cone-like band structure,[6,7]and charge density wave(CDW) order.[9-11]Among these antimonides, LaAgSb2has been paid special attention to because it hosts both CDW and Dirac fermions.[7,9]LaAgSb2crystallizes in a simple tetragonal ZrCuSi2-type structure(P4/nmm,No.129),with La atoms intercalating between Sb and AgSb layers.[6-8]As temperature decreases,LaAgSb2experiences two CDW transitions at~209 K and~185 K,respectively.[12]The former transition corresponds to a periodic charge/lattice modulation along theaaxis,while the latter one relates to a weaker modulation along thecaxis.[9]Accompanying with the CDW transitions,striking anomalies have been observed in electrical transport,magnetic susceptibility, thermoelectric power, and infrared spectroscopy measurements.[1,8,13]
More recently, angle-resolved photoemission spectroscopy investigation and first-principle calculations consistently revealed that LaAgSb2possesses linear energy bands and a Dirac-cone-like structure near the Fermi level.[7]In particular,the segments of the Fermi surface pocket that is associated with the Dirac-cone-like structure are well nested with a small wave vector, documenting a close relationship of the Dirac cone to the CDW ordering.[7]Moreover, LaAgSb2exhibits a large linear magnetoresistance (MR) due to the existence of linear band dispersion, which disappears just above the CDW transition temperature of 207 K and provides additional evidence of the correlation between the Dirac cone and CDW ordering.[6,7]These unique properties make LaAgSb2a promising material for applications in CDW-based electronic devices.
Applying external pressure and chemical substitution are two effective ways to tune the CDW order.[10,11,14]Based on earlier studies,elements doping in both La and Ag sites disfavors the CDW in LaAgSb2, which was partially attributed to the disorder generated by element substitution.[10,11]In contrast,without inducing additional impurities,applying external pressure provides a clean way for the modulation of the CDW.Previous electrical resistance measurements unveiled that the CDW is gradually suppressed by the applied pressure.[10,11,15]However, the highest pressure studied in the electrical transport measurements so far is limited to~3.8 GPa.[15]How the CDW involves and whether novel phenomena can be induced at higher pressures are not clear and deserve further investigation.
Here,using pressure as a tuning knob,we systematically investigate the evolution of structural and electrical properties of LaAgSb2single crystals throughin-situsynchrotron x-ray diffraction (XRD), Raman spectroscopy, and electrical transport measurements under pressures up to 41.6-49.0 GPa,combined with first-principles calculation. With increasing pressure, the magnetoresistance is monotonically suppressed and completely disappears at 21.5 GPa. In addition, atPC~22 GPa,the sign change of the Hall coefficient is observed at 5 K. While no evident structural phase transition is observed via XRD, the simultaneous occurrence ofc/aanomaly and new Raman peak unravels a structural modification atPC.
2. Experimental details
Single crystals of LaAgSb2were grown by Sb self-flux method.[8]After removing the excessive Sb by centrifuging,plate-like crystals were obtained, as shown in the inset of Fig. S1(b). The temperature (T)-dependent electrical resistivity(ρxx)measurements at ambient pressure were conducted in a physical property measurements system(PPMS,Quantum Design Inc.).
High-pressure electrical transport measurements were conducted in a screw-pressure-type diamond anvil cell(DAC)made of Be-Cu alloy. The culet size of the diamond was 300 μm. The T301 stainless-steel gasket was pre-indented from thickness of 200 μm to 30 μm and a hole of about 280 μm was drilled in the center of the pit. Platinum foil served as the electrical contact. Soft NaCl fine powder was used as the pressure-transmitting medium (PTM). A piece of cleaved single crystal with dimensions of~100×50×10 μm3together with some ruby powders was loaded into the chamber.ρxx(T)curve was measured by using standard four-probe method. The current was introduced along theabplane. Hall resistivityρxywas measured at 5 K via five-probe method with external magnetic field along thecaxis.
High-pressure powder x-ray diffraction experiments were conducted at beamline 15U1,Shanghai Synchrotron Radiation Facility(SSRF)at room temperature. Pressure was generated by a Mao-Bell type symmetric DAC.The culet of the diamond was 300 μm in diameter. The Re gasket was pre-indented to thickness of 30 μm and a hole of 150 μm was drilled as sample chamber. LaAgSb2powders were obtained by crushing and grinding the as prepared LaAgSb2single crystals. Pressed powder (~50×50×10 μm3) together with some ruby balls was loaded in the chamber. Daphne 7373 oil was used as the PTM.A focused monochromatic x-ray beam with wavelength 0.6199 ˚A was used for the angle-dispersive diffraction. The size of the focused x-ray beam at the sample position is 3 μm×2.5 μm. Two-dimensional area detector Mar165 CCD was used to collect the powder diffraction patterns.[16]The detector was 185.88 mm away from the sample. The Dioptas[17]and Rietica programs[18]were employed for image integrations and structure refinement,respectively.
The high-pressure Raman spectrum measurement was performed at room temperature in a Mao-Bell type symmetric DAC using a commercial Renishaw Raman spectroscopy measurement system with a 532-nm laser excitation line. The diamond culet was 300 μm in diameter. The T301 stainless-steel gasket was pre-indented from thickness of 200 μm to 30 μm and a hole of about 150 μm was drilled as the sample chamber. Daphne 7373 oil served as the pressure medium. Pressure was calibrated by using the ruby fluorescence shift at room temperature for all above experiments.[19]
3. Results and discussion
Figure 1(a) displays the temperature-dependent resistivityρxx(T)measured at ambient pressure under 0 T and 14 T,respectively. One can see that accompanying with the formation of CDW order at around 210 K, the difference of resistivity Δρ=ρxx(H)-ρxx(0 T) starts to develop and becomes pronounced with decreasing temperature, in accordance with previous reports.[6,8]Due to the simultaneous occurrence of CDW and Δρ,the onset temperature of Δρ(T*)is equal to the CDW transition temperatureTCDWat ambient pressure,see the inset of Fig.1(a). To trace the evolution of CDW under compression,we measured theρxx(T)at each pressure under 0 T and 7 T,respectively. As seen from Figs.1(b)-1(f),the Δρis suppressed gradually with increasing pressure,meanwhile theT*decreases monotonically. Both the suppression of Δρand decrease ofT*are in line with the collapse of CDW order as reported in a previous study.[15]The Δρeventually disappears at 21.5 GPa. However, it should be noted that the CDW order was found to be suppressed completely around~3 GPa according to Ref. [15], which is much smaller than the critical pressurePC~21.5 GPa and may indicate the decoupling of Δρand CDW order under high pressure. Meanwhile, as shown in Fig.S3,it can be seen that the linear range of MR is monotonically reduced upon compression and the whole curve can be fitted by a quadratic-field relation abovePC. In addition,ρxxmaintains the metallic conduction behavior and no superconductivity is observed down to 1.8 K, see Fig. 1(g).The resistivity at 300 K initially decreases with increasing pressure up to 5.1 GPa and then persistently increases upon further compression, accompanying with a sudden jump between 18.6 GPa and 21.5 GPa[Fig.1(g)]. In general,the pressure enhances the band overlapping and the resistivity should decrease with increasing pressure. The abnormal enhancement of resistivity under high pressure could be attributed to different factors, such as non-hydrostatic compression, structural phase transition/electronic phase transition, and structural distortion.[20-24]

Fig.1. (a)-(f)Temperature dependence of resistivity under 0 T(black line)and external magnetic field(red line)with H parallel to c axis at various pressures. Arrow marks the transition temperature TCDW at ambient pressure and T* under high pressure. The insets of(a)-(f)display temperature dependence of Δρ =ρ(H)-ρ(0 T).(g)Temperature-dependent electrical resistivity of LaAgSb2 in the pressure range of 0.7-44.0 GPa.

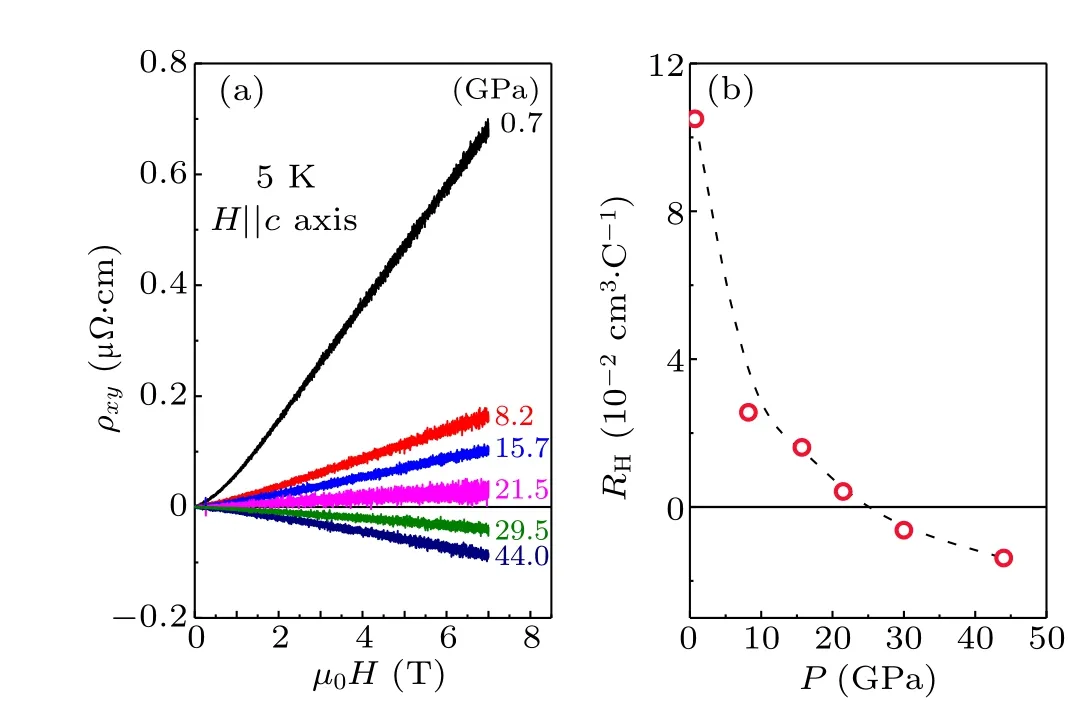
Fig.2. (a)Field-dependent Hall resistivity ρxy of LaAgSb2 single crystal under various pressures at 5 K with H parallel to c axis.(b)Pressuredependent Hall coefficient RH. The RH is determined from the initial slope of ρxy at H →0.
Figure 2(a) displays the magnetic field (H)-dependent Hall resistivityρxy(H) at 5 K and various pressures. At 0.7 GPa,ρxyshows a quadratic field dependence in the lowfield region while increases linearly at higher fields, consistent with the result at ambient pressure.[6]The nonmonotonic field dependence and positive slope ofρxy(H) indicate that LaAgSb2exhibits a multiband feature and the hole-type carriers dominate the transport behavior. Hall coefficientRHis extracted from the slope ofρxy(H) around zero field, as displayed in Fig. 2(b). Upon compression,RHdecreases monotonically and changes into negative at pressures above 21.5 GPa. The sign change ofRHdemonstrates that the holedominated conductivity maintains up to 21.5 GPa and is replaced by electron-dominated behavior at higher pressure. In general,the sign change of Hall coefficient directly reflects the modification of the Fermi surface, which could be caused by not only electronic phase transition,[25]but also the occurrence of structural instability.[26]
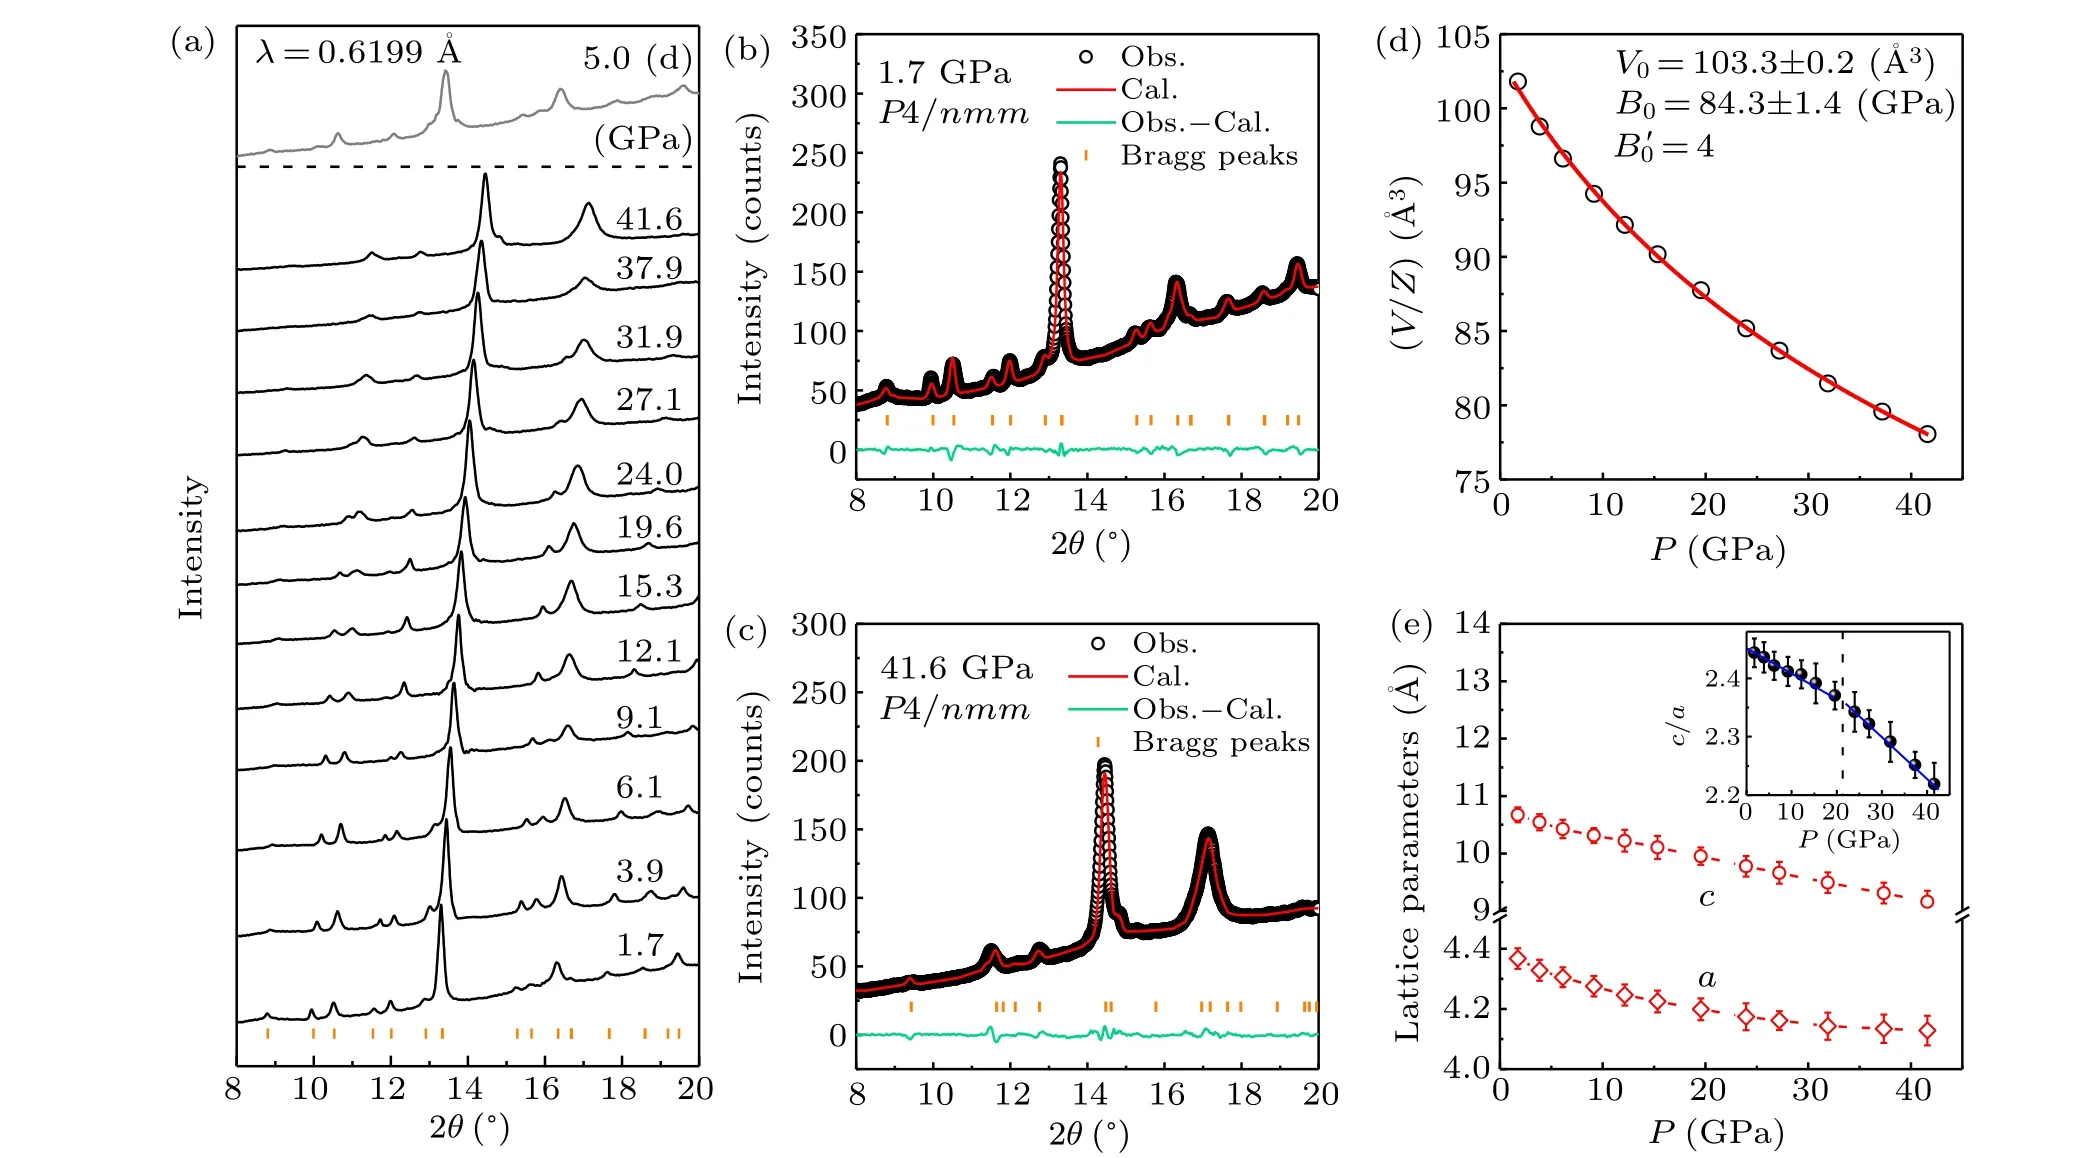
We further investigate the structural stability of LaAgSb2under high pressure via synchrotron XRD measurement. Figure 3(a)shows the XRD patterns at selected pressures. Upon compression, all Bragg peaks shift to larger angles due to the lattice shrinkage without appearing extra peaks up to 41.6 GPa. The XRD pattern at each pressure can be well indexed by the space groupP4/nmm(No.129),see the representative refinements at 1.7 GPa and 41.6 GPa in Figs. 3(b) and 3(c). The volume versus pressure plotted in Fig.3(d)is fitted by the third-order Birch-Murnaghan formula,which yields the ambient pressure volumeV0=103.3(±0.2) ˚A3,bulk modulusB0=84.3(±1.4) GPa with its first-order derivativeB′0being fixed as 4. The extracted lattice parameters(aandc)are displayed in Fig. 3(f). Without detecting an evident structural transition, it can be seen that bothaandcdecrease monotonically with the applied pressure. Nevertheless,the axis ratioc/a, a measure of the relative compressibility along different crystal axis, displays a clear kink at around 22 GPa.On one hand,such a feature can be caused by non-hydrostatic compression due to the solidification of pressure transmitting medium.[27,28]However,we used Daphne 7373 as the pressure medium in the high pressure XRD measurement, which normally leads to the kink anomaly in lattice ratioc/aat around 7-8 GPa.[27,28]On the other hand,we notice that characteristic pressure of 22 GPa agrees well with the critical pressure where the Hall coefficient changes sign,which indicates that change in the electronic state could be correlated with the modification of lattice degree of freedom.

Fig.3. (a)Synchrotron radiation x-ray diffraction patterns of LaAgSb2 under various pressures(λ =0.6199 ˚A).The XRD pattern upon decompression back to 5.0 GPa is denoted by d. (b),(c)The refinements at 1.7 GPa and 41.6 GPa were performed using RIETICA program with the Le Bail method.(d) The open symbols stand for unit volume. The solid red line is the fitting result based on the third-order Birch-Murnaghan equation of states. (e)Pressure dependence of the refined lattice parameters. The inset shows the lattice ratio of c/a as a function of pressure.
As an effective and powerful tool in detecting lattice vibrations, Raman scattering is sensitive to the local lattice symmetry and can provide information including electronphonon coupling, weak lattice distortion, and structural transition.[29,30]For LaAgSb2, a factor-group analysis yields a total number of 24Γ-point phonons, of which 12 (4Eg⊕2A1g⊕2B1g) are Raman-active modes, 9 (3Eu⊕3A2u) are IR-active modes, and 3 (Eu⊕A2u) are acoustic modes. Both Egand Euare double degenerate modes. At ambient pressure(see Fig.S4(a)and Table SI in supplementary material),three prominent peaks with Lorentzian line shape are observed at~98.7 GPa,~108.1 GPa, and~126.3 GPa, which can be assigned to B11g, A11g, and A21gRaman vibrational modes, respectively. As displayed in Fig.S4(b),all these Raman modes represent out-of-plane atomic vibrations, with B1ginvolving Ag and Sb1 atoms while A1ginvolving La and Sb2 atoms.Figure 4 shows the room-temperature Raman spectra at various pressures up to 49.0 GPa.One can see that all three Raman modes move towards higher frequencies monotonically with increasing pressure. Strikingly, in line with the appearance ofc/aanomaly, a new peak (labeled as N) starts to appear at ca. 22.1 GPa and becomes prominent upon further compression. In principle, the emergence of new Raman modes normally involves a crystal symmetry breaking.[31-33]However,the XRD measurement indicates that the original tetragonal structure is maintained upon compression across the critical pressure. The discrepancy could be attributed to different sensitivity of the two methods. Comparing with XRD that is determined by the periodicity of crystal lattice, Raman spectrum depends on the point group symmetry and probes the structure on a local scale. Without detecting an evident structural transition by XRD, the simultaneous occurrence ofc/aanomaly and new Raman peak is reminiscent of a pressureinduced structural modification, such as isostructural transition or a weak structural phase transition.[34-41]Especially,if the lattice structure of the new phase is very similar to the initial one,this transition will be too weak to be detected due to peak broadening of XRD pattern under pressure. In addition to the appearance of the new Raman peak,the structural modification is also reflected in the pressure dependences of other Raman modes plotted in Fig. 5(a), which demonstrate slope changes around 22 GPa. Meanwhile, the full width at half maximum (FWHM) of A21gmode decreases initially and displays a minimum aroundPC[Fig.5(b)], rather than broadens monotonically. Recalling the sign change of Hall coefficient atPC,this structural modification should be the main reason.

Fig.4. Room-temperature Raman spectra of LaAgSb2 single crystal in the pressure ranges of(a)1.2-18.9 GPa and(b)20.4-49.0 GPa,respectively. The blue solid dots and red diamonds indicate the appearance of new peak above 22.1 GPa. The Raman spectrum upon decompression back to 2.8 GPa is denoted by d.
After constructing a phase diagram in Fig. 5(c), a vivid correlation between the electrical and structural properties presents in the pressurized LaAgSb2. The sign change of the Hall coefficient evidences the changes of the Fermi surface atPC. As the CDW in LaAgSb2originates from nesting of segments of the Fermi surface pocket associated with the Diraccone-like structure,the collapse of CDW should be concomitant with the disappearance of Dirac fermions. Along with the modulation in the Fermi surface, the structural modification and an abrupt increment of room temperature resistivity are detected at the same critical pressure. Accordingly,a question arises as what is the origin behind these changes.On one hand,the modulation of electronic state could be attributed to the structural modification. On the other hand,the structural modification might be caused by the reconstruction of the Fermi surface,which accords with a scenario of electronic topological transition(ETT)or Lifshitz transition.[42]The ETT or Lifshitz transition does not require the structural transition, but normally leads to anomalies in the phonon spectrum or anomalies inc/aratio.[43-47]

Fig. 5. (a) Pressure dependence of Raman frequencies of LaAgSb2. Solid lines are linear fits to data. (b)FWHM of the A21g Raman mode as a function of pressure and solid line is drawn as guide to the eyes. (c) Pressuretemperature phase diagram of LaAgSb2. The left axis stands for the temperature T and the right axis corresponds to the resistivity ρxx.
4. Conclusion
In summary, the pressure effects on structural and electronic properties of single crystal LaAgSb2were investigated by combining electronic transport, XRD, and Raman experiments.With increasing pressure,the magnetoresistance is suppressed gradually. Both XRD and Raman experiments consistently uncover a structural modification atPC=22 GPa. The structural modification is characterized by a kink anomaly inc/aand a newly appeared Raman mode, and is accompanied by the sign change in the Hall coefficient.
- Chinese Physics B的其它文章
- Projective representation of D6 group in twisted bilayer graphene*
- Bilayer twisting as a mean to isolate connected flat bands in a kagome lattice through Wigner crystallization*
- Magnon bands in twisted bilayer honeycomb quantum magnets*
- Faraday rotations,ellipticity,and circular dichroism in magneto-optical spectrum of moir´e superlattices*
- Nonlocal advantage of quantum coherence and entanglement of two spins under intrinsic decoherence*
- Universal quantum control based on parametric modulation in superconducting circuits*

