
Very-large eddy simulation of the rotational effects on turbulent flow in a ribbed channel*
2021-07-28 08:36HaoQIANTaoGUOXingsiHANJunkuiMAO
Hao QIAN ,Tao GUO ,Xing-si HAN†‡,3 ,Jun-kui MAO,3
1College of Energy and Power Engineering,Nanjing University of Aeronautics and Astronautics,Nanjing 210016,China
2Shanghai Academy of Spaceflight Technology (SAST),Shanghai 201109,China
3Key Laboratory of Aero-engine Thermal Environment and Structure,Ministry of Industry and Information Technology,Nanjing 210016,China
Abstract:For the simplified model of the internal cooling passage in the turbine blade of an aero-engine,the present study applies a newly developed turbulence modeling method,very-large eddy simulation (VLES),for analyzing rotational effects on the characteristics of complex turbulent flow.For comparison,not only are the delayed detached eddy simulation (DDES) method(recognized as one of the most popular hybrid Reynolds-averaged Navier-Stokes–large eddy simulation (RANS-LES) methods)and the LES method used with the same numerical setup,but also three RANS turbulence models,including the k-ω shear stress transport (SST),standard k-ε,and Reynolds stress models,are applied to analyze the flow structure in the ribbed channel (whether rotating or stationary).Complex turbulent flows in a square ribbed channel at high Reynolds number of 100 000 in the stationary state and different rotational numbers (Ro) between 0.1 and 0.4 are simulated and analyzed in detail.The comparisons show that when compared with the experimental data the VLES method works best in both the stationary and rotating states.It can capture unsteady flow characteristics such as wall shear layer separation and the vortex structure resulting from the rib disturbance.The DDES method can only capture the larger-scale vortex structures,and its predictions of the time-averaged velocity differ considerably from experiments,especially in the stationary state.With a relatively coarse grid,satisfactory prediction cannot be achieved in either rotating or stationary state by the LES method with wall-adapting local eddy-viscosity (WALE) and dynamic Smagorinsky models.The three RANS models perform poorly in both the stationary and rotating states.The results demonstrate the advantages of the VLES method in analyzing the unsteady flow characteristics in the ribbed channel at high Reynolds numbers for both stationary and rotating conditions.On that basis,the study uses the VLES method to analyze the flow evolution under different rotational numbers,and the rotational effects on the fluid mechanisms are analyzed.
Key words:Very-large eddy simulation (VLES);Rotation effect;Ribbed channel flow;Unsteady flow;Turbine blade
1 Introduction
In modern aviation aero-engines,the rise in turbine inlet temperature makes the development of an efficient cooling technology important (Saravanamuttoo et al.,2001;Zhang et al.,2018).Among many cooling methods,adding turbulence-enhancing structures (such as ribs,slots,and fins) to the internal passages of the blades is widely applied and can reduce the blade surface temperature by enhancing the convective heat transfer between the cold air and the hot blade.The presence of ribs inside the turbine blades causes complex flow separation phenomena,which not only strengthen the level of turbulent flow fluctuations,but also the level of heat transfer.The ribs in the channel can also induce secondary flows(Humphrey and Whitelaw,1979),making the flow structures more complex.There have been many studies of the flow and heat transfer characteristics in ribbed channels;however,there are few studies concerning the effects of rotation on the turbulent flow characteristics in ribbed channels,especially by using high-fidelity numerical analysis.
For rotating blades,the centrifugal buoyancy and Coriolis force on the flow structure significantly affect the heat transfer effects of ribbed channels.In most cases,the Coriolis force is the main factor,and the effect of centrifugal buoyancy is significant only when the density gradient is big.Bo et al.(1995)found that buoyancy has an important effect on the heat transfer characteristics when the“rotational buoyancy”Rayleigh number exceeds a threshold value.In addition,the Coriolis force affects the turbulent flow field through the secondary flow caused by Coriolis and turbulent stress redistributions,which can enhance the transient characteristics of turbulence,and significantly affect the flow and wall heat transfer in the blade channel (Prakash and Zerkle,1995).Therefore,it is necessary to investigate the effect of the rotation on the flow characteristics in the blade channel.
Among various enhanced heat transfer structures inside the blade channel,the ribbed channel has attracted extensive attention because of its simple structure and high efficiency.In previous studies,Azad et al.(2002) studied different flow characteristics in two-pass rectangular channels with smooth and 45° ribbed walls.Cheah et al.(1996) used laser Doppler velocity (LDV) to measure the mean and fluctuating flow fields in a strongly curved U-bend ribbed wall under different rotation conditions,at high Reynolds number (Re).Later,Iacovides (1998) numerically analyzed the turbulent flow in a straight U-shaped channel,using the standard high-Rek-εmodel in the bulk flow region and a low-Reone-equation turbulence model in the near wall region.However,the calculated results have significant differences from the experimental data.Yang and Wen (2016) used thek-ωshear stress transport (SST) turbulence model to study the flow and heat transfer features in the U-shaped channel at high rotational numbers (Ro)from 0 to 2.0.The results showed that the twoequationk-ωSST turbulence model is inaccurate in its prediction of the flow characteristics in the channels under rotational conditions.Al-Qahtani et al.(2002) applied the Reynolds stress turbulence model to study the flow and heat transfer characteristics in a rectangular channel with 45° ribbed walls.In some areas,there are significant differences between the simulation results and the experimental data.Narasimhamurthy and Andersson (2015) conducted a direct numerical simulation (DNS) of a 90° symmetrical straight ribbed channel at a low Reynolds number of 400,and considered the interactive effects of rotational effects and rib disturbances on flow characteristics.Through theoretical analysis,it was found that the generation of turbulent structures is related to the production term caused by Reynolds stress components and rotation effects.Tafti (2005) used the large eddy simulation (LES) method to study the flow and heat transfer features in non-rotation straight ribbed channels atRe=20 000.The effects of different sub-grid-scale models on the simulation results were analyzed,and satisfactory results of turbulence flow field were obtained by a dynamic Smagorinsky model.Abdel-Wahab and Tafti (2004) applied that model to study the flow in a rotating state and satisfactory results were obtained.Saha and Acharya (2003) performed LES and unsteady Reynolds-averaged Navier-Stokes (URANS) calculations on the flow in rectangular channels with 90° staggered straight ribs.The results show that the URANS method cannot capture unsteady coherent flow structures,and the turbulent flow characteristics are quite weak.
The studies mentioned above reveal that the Reynolds-averaged Navier-Stokes (RANS) and URANS methods are not satisfactory for predicting turbulence characteristics in channel flow under rotational conditions.DNS (Narasimhamurthy and Andersson,2015) and LES (Ding and Uematsu,2017) methods can accurately capture the turbulent flow characteristics.However,DNS and LES both consume huge computational resources.They are generally limited to the study of flow under low-Reynolds number conditions.It is difficult to use them at high Reynolds numbers and in practical engineering applications.Therefore,the development of the hybrid RANS-LES method has become important in recent years.
Kubacki et al.(2014) used the RANS method and the hybrid RANS-LES method to analyze the Coriolis force effects on the turbulent structures in a rotating asymmetric straight ribbed channel.The results show that the hybrid RANS-LES method can accurately capture the unsteady flow characteristics and the predictions are in good agreement with experiment.It demonstrates that the hybrid RANS-LES method can give satisfactory predictions of the flow features under rotation conditions.Among many hybrid RANS-LES methods,the most widely used one is the detached eddy simulation (DES) (Spalart,2009;Riéra et al.,2016).Its core idea is to switch between the RANS method and the LES method based on the length scales of local turbulence.The DES method was also used to analyze the flow structure and heat transfer in ribbed channels,under stationary and rotating conditions.Compared with the results obtained by the URANS method,the DES method is superior in capturing the vortex structure and predicting the development of turbulence(Viswanathan and Tafti,2006a,2006b,2007a,2007b).However,the DES method has the disadvantage that the turbulence model has no continuity in the connection interface between the RANS and LES regions(Tessicini et al.,2006;Hamba,2009).The delayed detached eddy simulation (DDES) method has been proposed on the basis of the DES method,but it still cannot overcome the main disadvantages of DES(Gil-Prieto et al.,2017),such as the significant delay of the mixing layer development.
The very-large eddy simulation (VLES) method is a turbulence simulation method originally proposed by Speziale (1998).Han and Krajnović (2015) significantly improved the original VLES method and developed it as a self-adaptive turbulence method,which can achieve seamless switching between RANS,LES,and DNS.The new VLES method has demonstrated a unique advantage in high-Reynolds number flow simulations.Xia et al.(2020) used the improved VLES method based on the baseline (BSL)k-ωmodel to study the turbulent vortex structure in a swirling flow.The results show that the VLES method can accurately predict the strong vortex evolution and unsteady characteristics such as fragmentation and vortex core migration.The predictions agree with the experimental data very well.
On that basis,in the present study,the newlydeveloped VLES method (Han and Krajnović,2013a,2013b,2015) is applied to study the complex flow characteristics in the ribbed channel under rotational and high-Reynolds number (Re=105) conditions,in order to assess its validity and accuracy for complex flow prediction under rotation.
The VLES turbulence method is also applied to explore the effects of rotational speed on the flow characteristics in the ribbed channel.For comparisons,the present study also performed calculations using three selected RANS turbulence models and the DDES turbulence method for the same test case.
2 Numerical methods
2.1 VLES turbulence modeling
In this study,because the velocity is quite low,the incompressible flow assumption is applied.In the rotating frame of reference,the continuity equation and momentum equations have the form of:
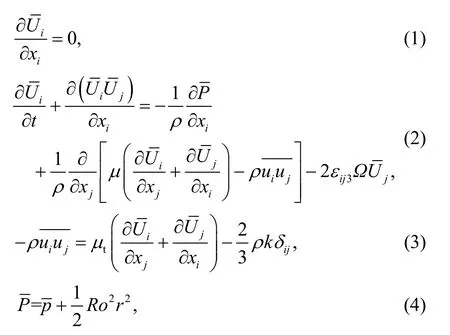
In a rotating channel (ribbed or not),the turbulent motion will be affected by the Coriolis force generated by the rotation.It was found that,for the rotating channel flow (without rib),the Coriolis force plays an important role in the stability of the turbulent boundary layer (Johnston,1998;Xun et al.,2011).When the component of the Coriolis force points to the surface,the wall surface refers to the pressure side.The turbulence tends to increase and the boundary layer is more unstable.When the component of the Coriolis force points away from the wall surface,the wall surface refers to the suction side,and the boundary layer is more stable.At higher Reynolds numbers,the Coriolis force has less effect on the turbulent structure of the suction surface,and the turbulent shear stress drops slightly (Johnston,1998).In addition,the Coriolis force becomes stronger in instantaneous strong turbulent motion.The fluid with high instantaneous velocity and large kinetic energy is driven to the pressure side.In a sense,there is a partial force balance between the pressure gradient on the channel and the Coriolis force.
The present study uses the VLES turbulence method based on the BSLk-ωmodel which has been developed previously (Han and Krajnović,2015;Xia et al.,2020).Its governing equations are shown as:
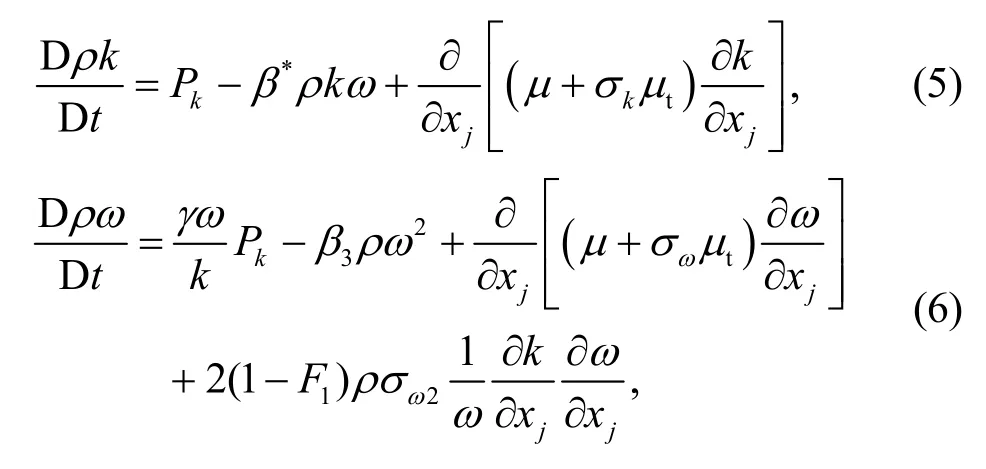
wherePkis the production of turbulence kinetic energy;β*is the model constant (β*=0.09);σk,γ,β3,andσωare the blending model constants of the BSLk-ωmodel;F1is the blending function that determines the ratio of the originalk-ωequation and the transformedk-εequation;σω2is the model constant with a value of 0.856.Eqs.(5) and (6) are the transport equations of the modeled turbulent kinetic energykand the specific dissipation rateω,respectively.To close the equations,the turbulent viscosityμt,which is modeled by the present VLES method,is calculated by
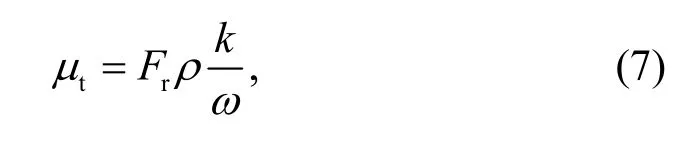
whereFris the resolution control function.Its modeling is the key to the VLES method,and can be achieved with the form of
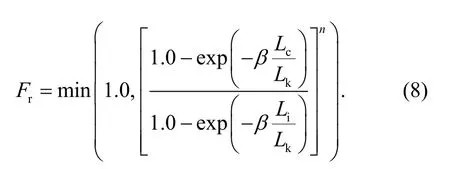
The meaning of min(x,y) in Eq.(8) is to take the minimum value ofxandy,so that the value ofFris between 0 and 1.0.βandnare the model constants of the VLES method,andβ=0.002,n=2.In addition,Li,Lc,andLkare three turbulence length scales in the modeling,which are the turbulent integral length scale (Li),the turbulent filter length scale (Lc),and the Kolmogorov length scale (Lk).These three length scales are calculated as:
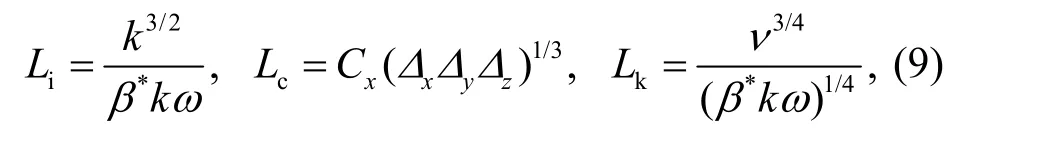
whereΔx,Δy,andΔzare the resolution scales of the grid in thex,y,andzdirections,respectively,andvis the kinematic viscosity of the fluid.It should be noted that the relation holds thatε=β*kωwithεthe dissipation rate.It is found that the model constantCxin Eq.(9)and the model constantCsin the Smagorinsky LES are connected by
The Smagorinsky LES model constantCsusually takes a value of 0.1.Thus,the final value of the model constantin the VLES turbulence method isCx=0.61.
Other model constants in the equations above are exactly the same as those in the BSLk-ωturbulence model.The VLES turbulence method is briefly described above and more details can be found in references (Han and Krajnović,2015;Xia et al.,2020).
2.2 Numerical setups
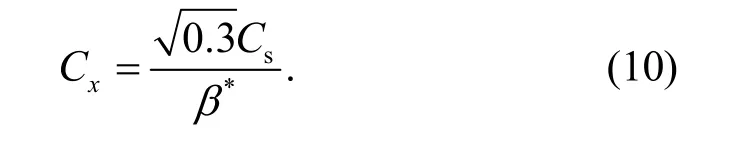
The geometry in this study is mainly composed of a square channel with 90° staggered straight ribs,as shown in Fig.1 (Iacovides,1998).It should be noted that the rotation direction is along the clockwise direction and the two walls referring to the pressure side wall and suction side wall are also given in Fig.1.The numerical calculation model is marked by the dashed box in the figure.The computational domain shown in a slice is given in Fig.2.The cross section of the calculation domain is 50 mm×50 mm square,that is,the hydraulic diameterDof the channel is 50 mm.There are 90° staggered straight ribs on both side walls of the channel.The cross section of the ribs is 5 mm×5 mm square.The span length of the rib is the same as that of the channel,both are 50 mm.The numerical study here is carried out with the Reynolds number ofRe=WBD/v=105,whereWBis the mean velocity at the inlet,and the kinematic viscosity of the fluidvremains constant.
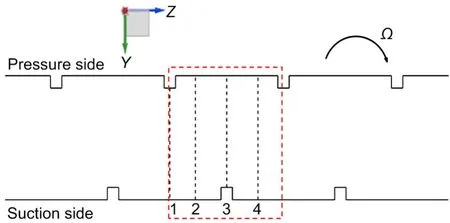
Fig.1 Schematic diagram of the ribbed passage
Fig.2 Schematic diagram of the computational domain shown in a slice
Hexahedral structured meshing is applied in this study.Mesh refinement is performed in the vicinity of the channel normal wall and the rib surface.The height of the first layer of the mesh is such as to ensure thaty+<1.Fig.3 shows a schematic diagram of the computational mesh.The entrance and exit of the computational domain are periodic boundary conditions with constant mass flow rate.The walls are imposed as the no-slip boundary conditions.The rotation axis of the model is thex-axis,and the rotation direction is clockwise.
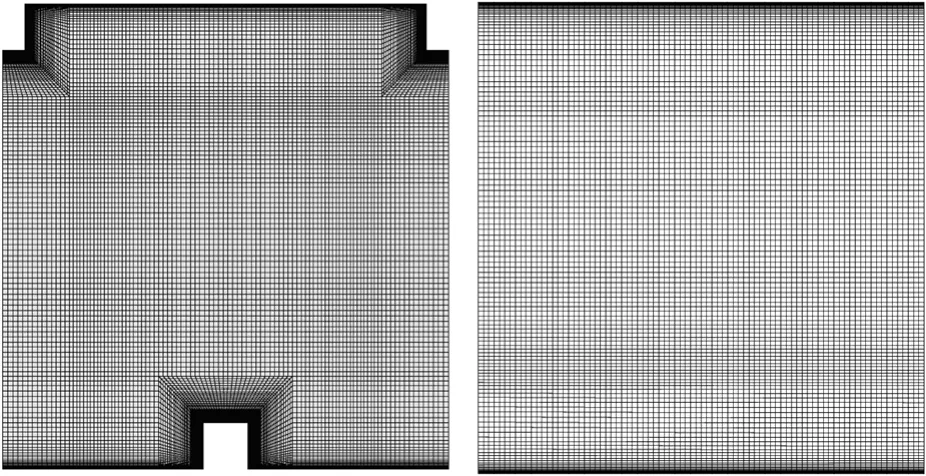
Fig.3 Schematic diagram of the computational mesh(front view and side view)
In this study,the VLES turbulence method is applied for the numerical simulation of the ribbed channel under static and rotating conditions.The VLES method is implemented in the ANSYS Fluent software.The 3D unsteady numerical calculations are performed with the rotational numbers ofRo=0.0,0.1,0.2,and 0.4,respectively.
The convective term is discretized using a bounded central difference scheme and the time discretization is a second-order implicit scheme.The pressure-velocity coupling applies the semi-implicit method for pressure-linked equations (SIMPLE) algorithm.In addition,the present study also performs RANS calculations,including the two-equationk-ωSST model,the standardk-εmodel,and the sevenequation Reynolds stress turbulence model.Furthermore,the DDES and LES turbulence methods are also applied in the calculations for comparison.
2.3 Parameter definitions
The Reynolds number and the rotational number are defined as:
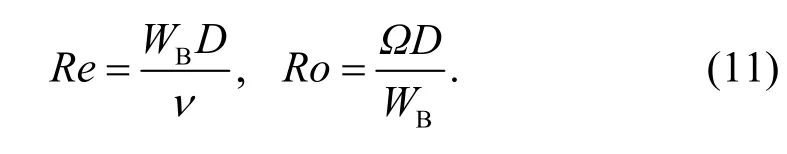
The Coriolis force is defined as:
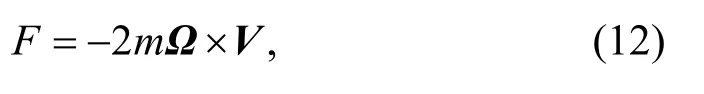
wheremis the mass,Ωis the angular velocity vector,andVis the velocity vector relative to the rotating coordinate system.
3 Results and discussion
3.1 Effects of the computational grids
In this study,the effects of different computational grids on the simulation results are firstly explored.Three computational grids are used,including approximately 1.0 million,2.1 million,and 3.0 million cells.
Fig.4 shows the computational results of the mean velocity on different computational grids using thek-ωSST and VLES turbulence methods at the location of line 1 (Fig.1) in the stationary state(Ro=0).It can be seen from Fig.4a that the velocity distributions by thek-ωSST model are close to each other on the three computational girds and imply a weak sensitivity of the predictions to the computational grid for the RANS method.The results in Fig.4b show that the predictions on the two finer grids of 2.1 million and 3.0 million cells agree with each other well,while they have relatively large differences from the predictions on the coarse grid with 1.0 million cells.Therefore,for the static state cases,the grid with 1.0 million cells is selected for the RANS calculations and the grid with 2.1 million cells is selected for the VLES,DDES,and LES methods.
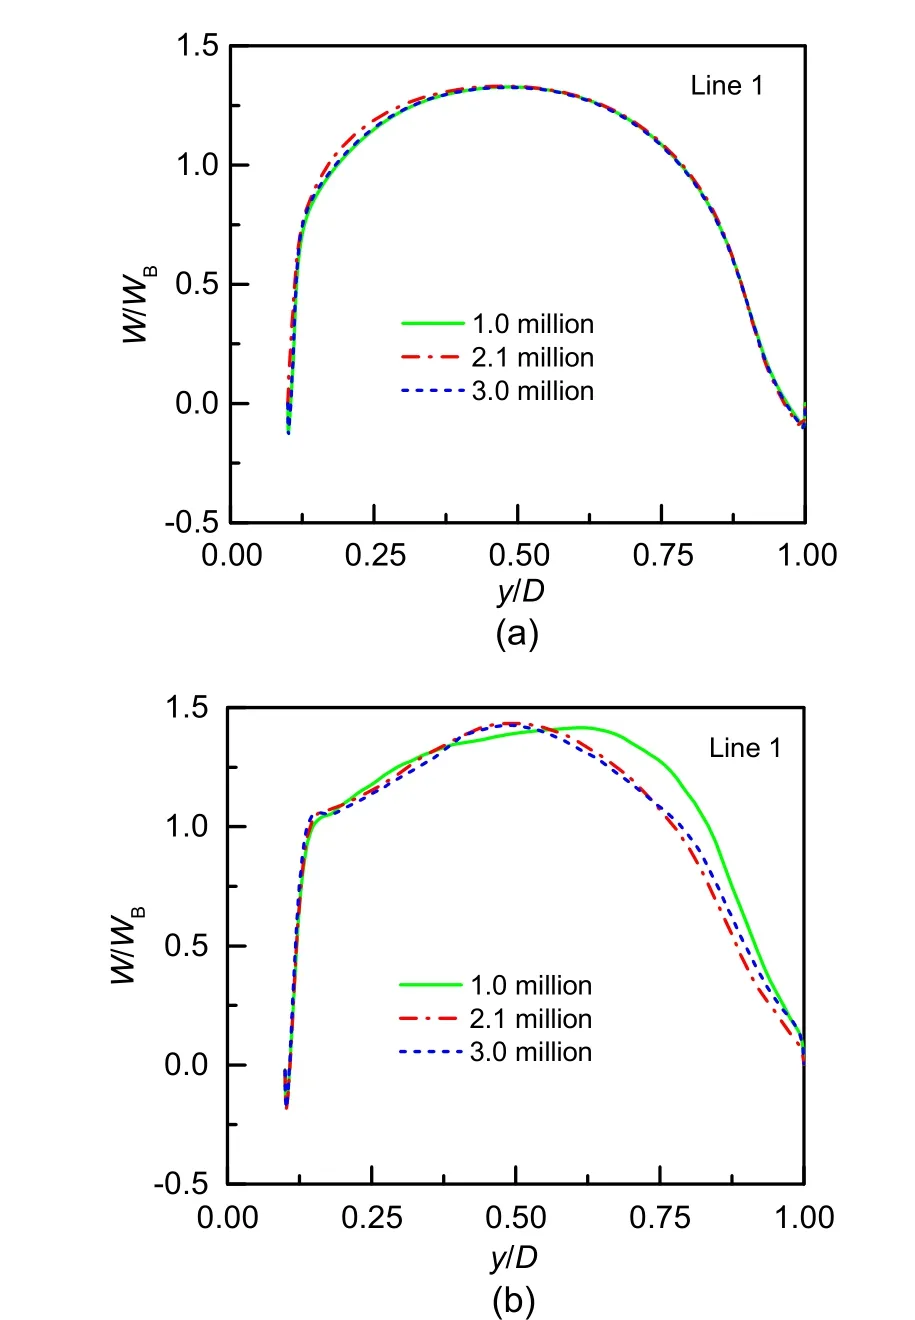
Fig.4 Computational grid effects for k-ω SST and VLES turbulence methods in stationary state
Fig.5 presents the mean velocity distributions on different computational grids by thek-ωSST and VLES turbulence models at the location of line 1(Fig.1) under the rotating state (Ro=0.2).Similar observations can be found from Fig.5 to Fig.4,i.e.the grid with 1.0 million cells is fine enough for the RANS calculation and the grid with 2.1 million cells is satisfactory for the VLES calculation.Therefore,for the rotating cases,the grid with 1.0 million cells is selected for the RANS calculations and the grid with 2.1 million cells is selected for the VLES,DDES,and LES calculations.
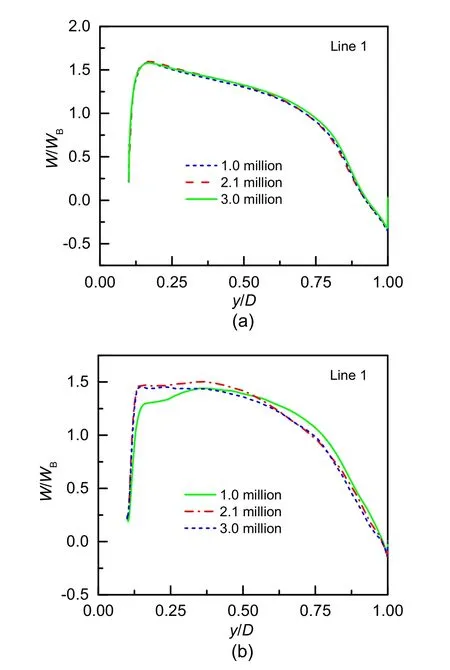
Fig.5 Computational grid effects for k-ω SST and VLES turbulence methods in rotating state
3.2 Turbulence characteristics in the stationary and rotating states
3.2.1 Performance of different models in the stationary state (Ro=0)
Coletti et al.(2012) found that when the ribbed channels are long enough,their flow characteristics exhibit periodic features.Thus,the following analysis of the velocity contours and the streamlines in the central plane can visually show the distributions of the flow structures.Fig.6 shows the basic flow structure near the ribbed wall at a stationary state,which is of great significance for understanding the evolution of the vortex structure under the rotation of the ribbed channel.The attachment point,determined with the mean stream-wise shear stress at the wall with a value of zero,is an important reference for judging the length of the recirculation zone.
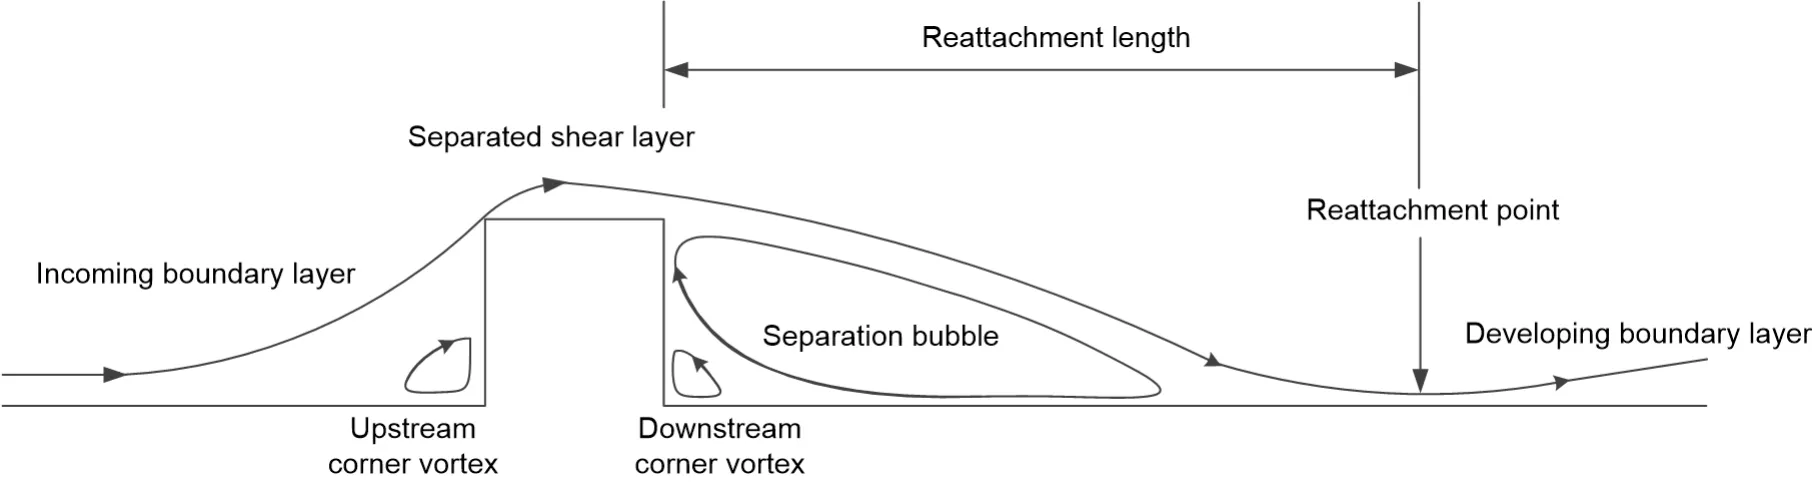
Fig.6 Main flow structures near the ribbed wall
Fig.7 shows the time-averaged velocity contours and the streamline distributions on the central plane calculated by the different turbulence models of RANS,VLES,DDES,and LES atRo=0.It can be seen that,overall,the RANS,VLES,DDES,and LES methods give similar flow structures in the stationary state.The turbulent structures on both sides of the ribbed channel are quite similar in the static state.On the central plane of the channel,there are several vortex systems that can be clearly identified,i.e.a corner vortex at the front of the rib,a separation bubble on the top of the rib,as well as a large (main)recirculation zone behind the rib whose length is nearly half of the distance between the two ribs.As shown in Table 1,the lengths of the main recirculation zone obtained by VLES,DDES,and LES models are close to each other,while the lengths of therecirculation zone behind the rib predicted by RANS models have significant deviations.Between the recirculation zone and the rib,there is also a small recirculation zone at the bottom of the rib formed by the flow separation,which is opposite to the direction of the rotation of the large returning vortex.These flow structures obtained by the numerical calculations are in line with the experimental data.Compared with the time-averaged velocity contours,the mean velocity obtained by the RANS method is slightly lower than those by the VLES and DDES methods in the bulk region away from the rib.
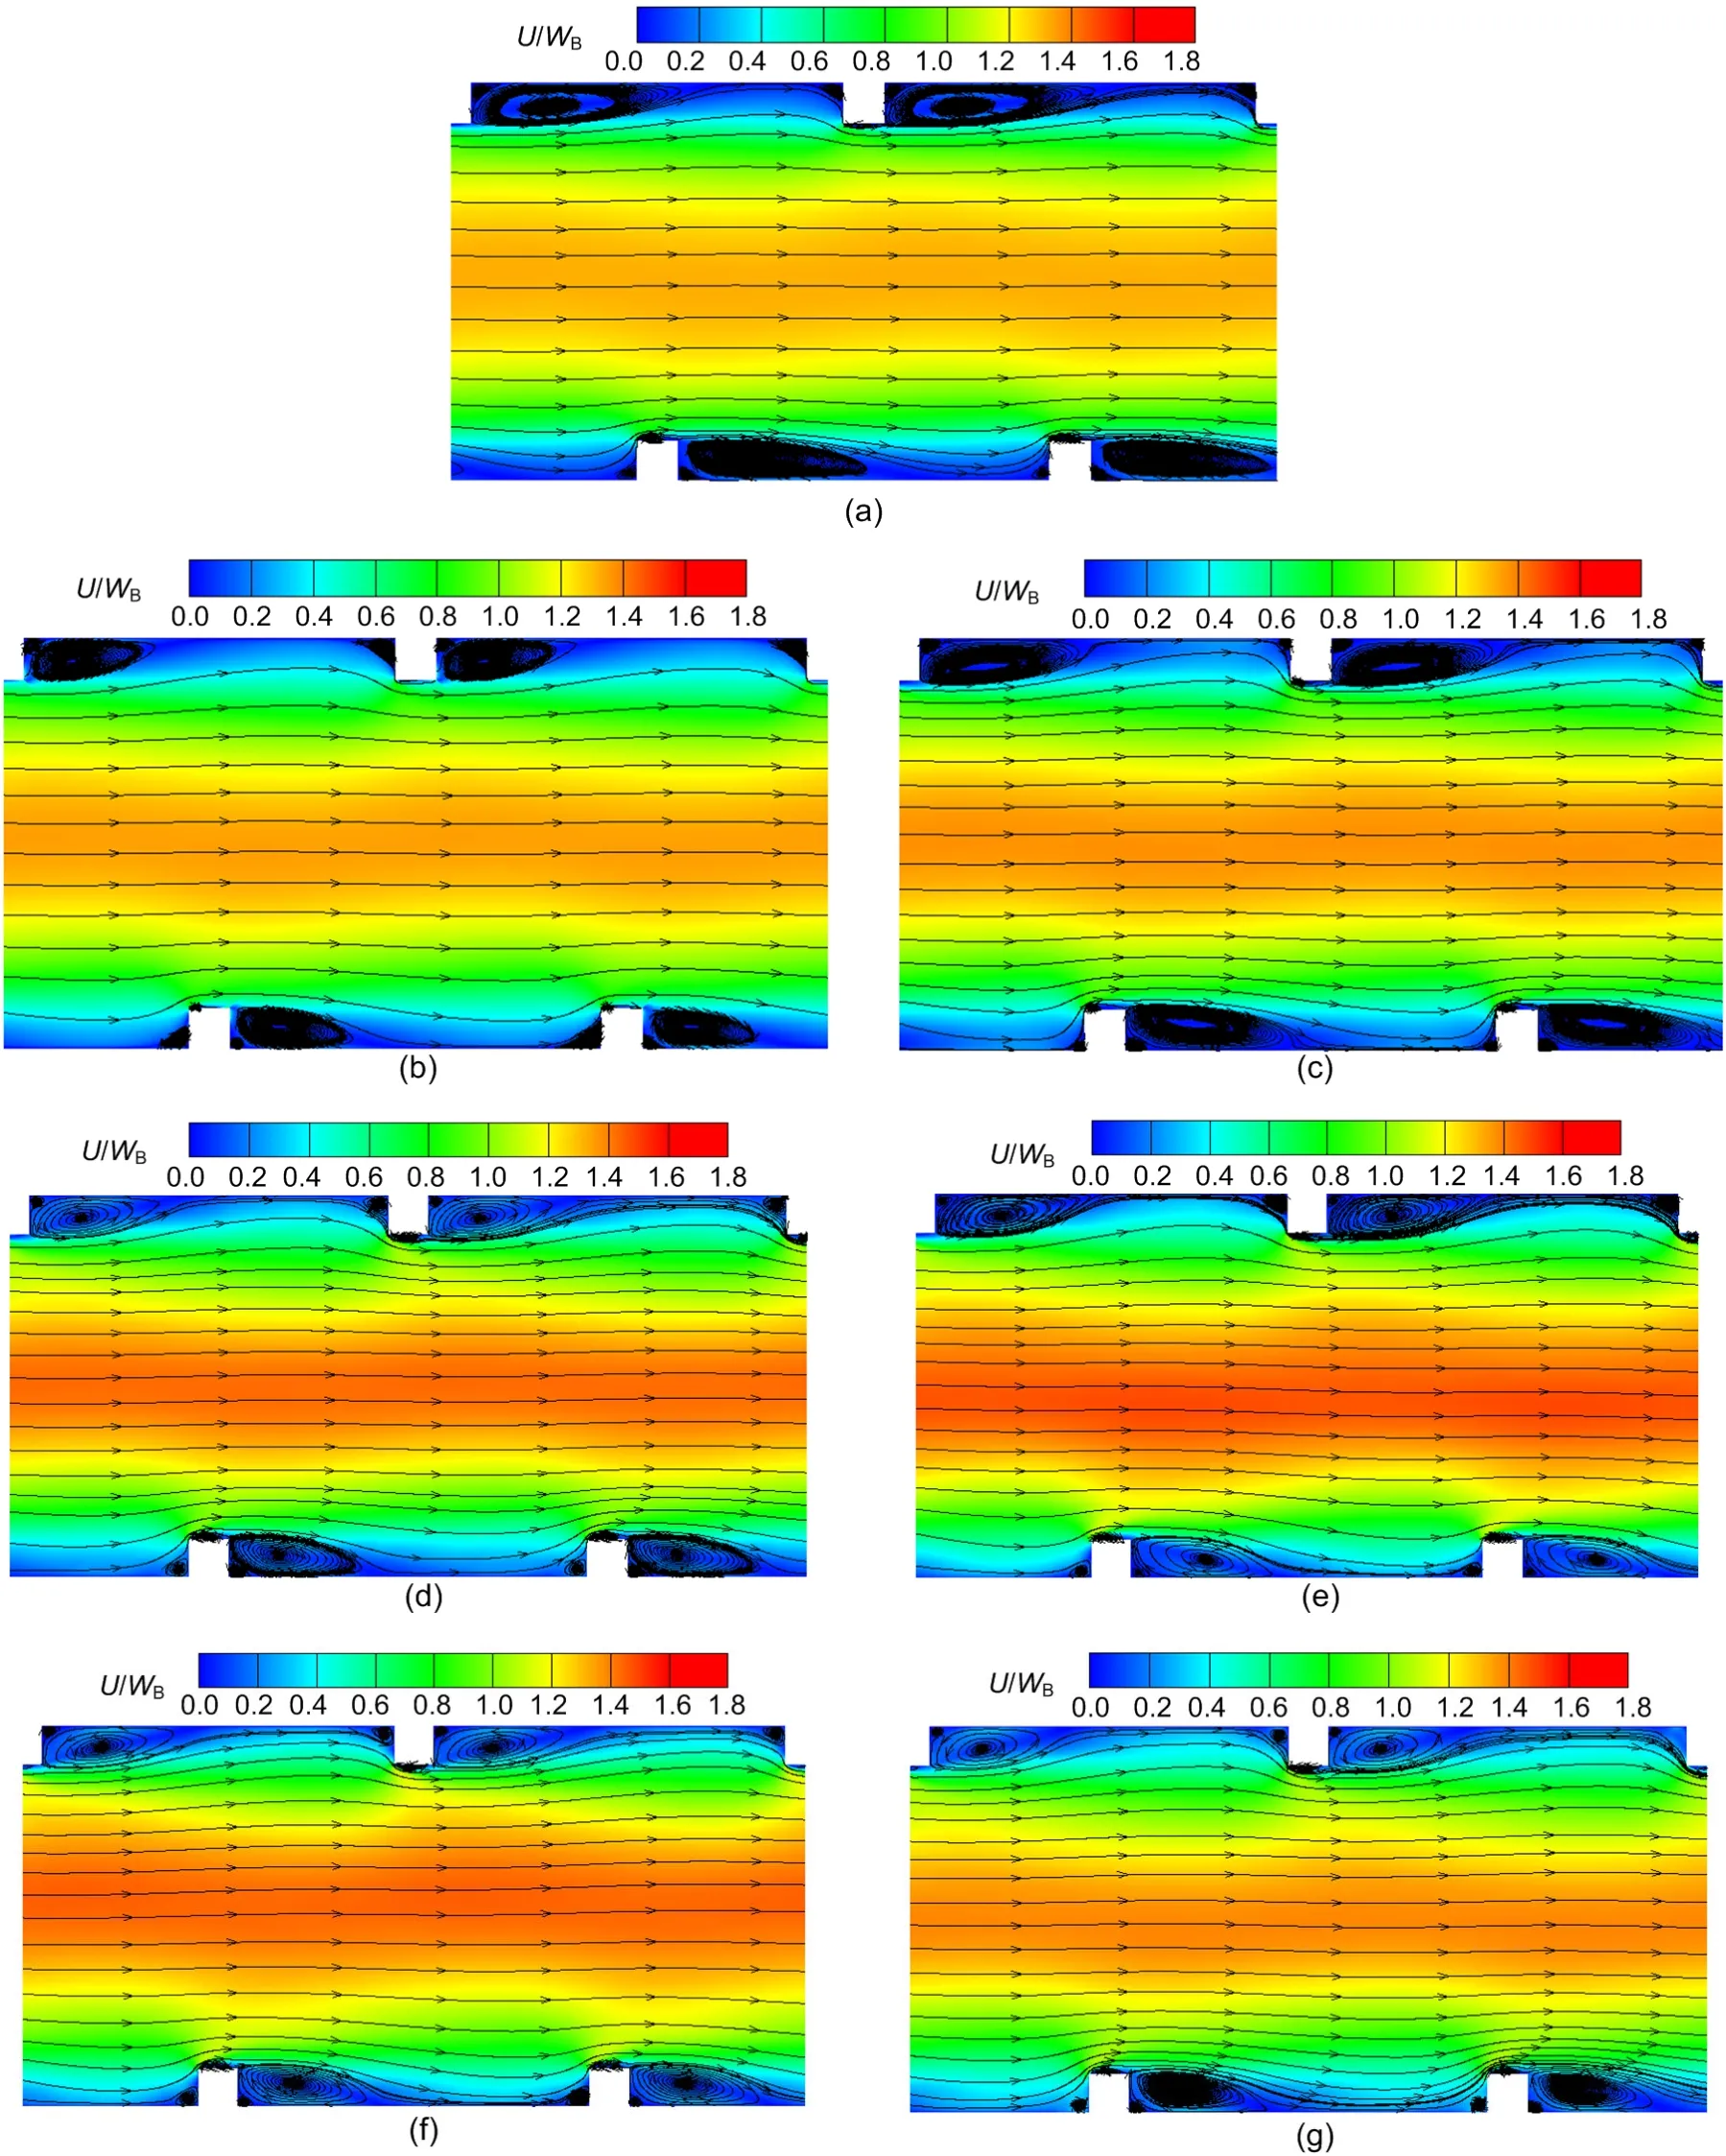
Fig.7 Time-average streamlines and contours of the non-dimensional velocity magnitude by different turbulence models at the central plane with Ro=0
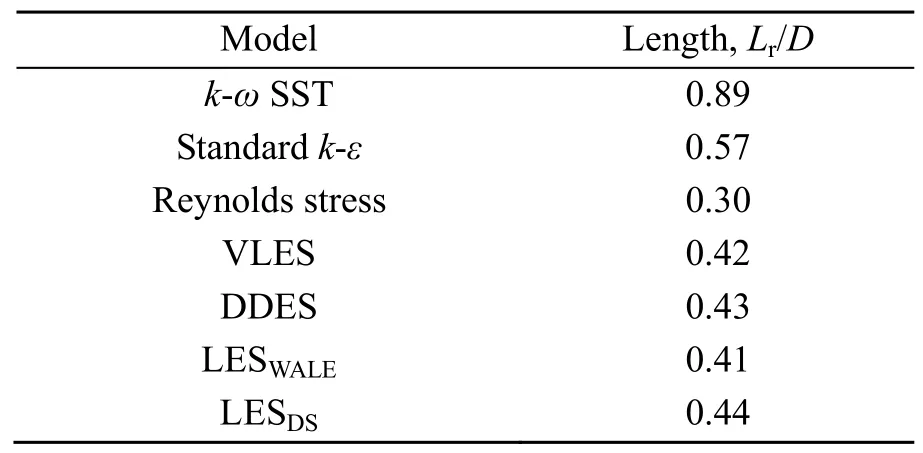
Table 1 Length of the main recirculation bubble on the suction side with Ro=0
To further compare the velocity predictions,Fig.8 (p.572) shows the mean velocity distributions at two locations by different turbulence models and experimental data.It can be seen that the results obtained by the VLES method match best with the experimental data.The VLES,DDES,and LES (with the dynamic Smagorinsky model) methods accurately predict the turning region caused by the shear layer development at the ribs on the pressure side and the mainstream mixing at the position of line 1.However,the three RANS models fail to predict the turning region.The LES with wall-adapting local eddy-viscosity (WALE)model has also predicted this turning point,but the stream-wise velocity on the pressure side is slightly over-predicted.In the mainstream region,at the positions of line 1 and line 2,the stream-wise velocities obtained by the RANS models and the LES with dynamic Smagorinsky model are slightly lower than that from experiments.Meanwhile,on the suction side,the result of the DDES method is higher than in the experiments,which cannot describe the mainstream flow accurately.The results demonstrate the accuracy and reliability of the VLES method in calculating the ribbed channel flow characteristics under static conditions,which include the flow separation and attachment,and the mixing shear layers.
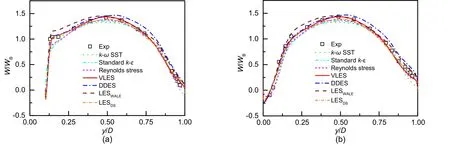
Fig.8 Mean stream-wise velocity profiles at different locations by different turbulence models with Ro=0
To understand the complex flow mechanisms in the ribbed channel,Fig.9 shows the 3D vortex structures simulated by the VLES and DDES methods using theQcriterion.It is defined asQ=0.5(ΩijΩij−SijSij) (whereΩijandSijare the rotation and strain rates,respectively),and has been widely employed to visualize complex turbulent coherent structures.It is observed that both the VLES and DDES methods capture the complex vortex structures.It can be clearly seen from Fig.9 that there are separation vortex structures and wall shear layers behind the ribs on both sides of the channel.This shows that the flow structure on both sides of the channel with staggered ribs is similar in the static state.Large-scale vortex structures are captured by the DDES method,and smaller vortex structures are captured by the VLES method.This implies that the VLES method is more capable of resolving the unsteady turbulence structures than the DDES method.This is more significant in the near wall region,where the VLES method predicts the evolution of the wall shear layers,flow separation,and reattachment vortex structures.Thus,the VLES method is superior to the DDES method in analyzing the characteristics of unsteady turbulence.
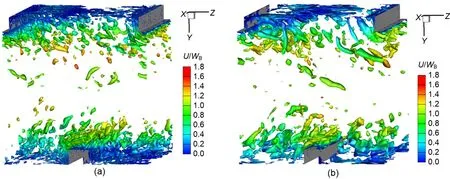
Fig.9 Turbulent flow structures by VLES (a) and DDES (b) methods in the asymmetric ribbed channel shown by Q values (Q=2×10⁵ s−2) colored with non-dimensional velocity magnitude at Ro=0
3.2.2 Performance of different models in the rotating state (Ro=0.2)
The Coriolis force generated by the rotation is always perpendicular to the plane of the stream-wise velocity direction and the angular velocity direction.The magnitude of the Coriolis force is in theydirection,so that when a clockwise rotation is performed,the main flow is shifted to the pressure side.The pressure increases on the pressure side and decreases on the suction side.The pressure gradient cancels out part of the Coriolis force,making the change of the transverse velocity (ydirection) smaller.However,due to the existence of the secondary flow motion,the Coriolis force has a component in thezdirection,and its magnitude isFz=2vΩ(vis the mean span-wise velocity),which is weaker than that in theydirection,i.e.Fy.
Fig.10 shows the time-averaged velocity contours and the streamline distributions on the central plane calculated by different turbulence models under the rotation state.Comparing them,it can be observed that the mean velocity and streamline distributions by different models are close to each other in a global sense.Compared with the static state results,the flow field changes significantly and the flow direction shifts.This indicates that the rotation has significant effects on the flow evolution,which mainly reflect on the recirculation zones in front of the ribs and behind them.Unlike the static state,which is dominated by the 2D flow structures in the central plane,the fluid motion with high Reynolds number has a strong 3D feature due to the influence of the Coriolis force and the centrifugal force.The recirculation region near the ribs at the pressure side disappears in the figures,and is caused by the 3D effect brought by the Coriolis force.The Coriolis force componentFysqueezes the mainstream region toward the pressure side and also accelerates the flow velocity near the pressure side.It may work,together with wall shear stress,to delay the reattachment point.It should be noted that the rotation direction is along the clockwise direction in the present study,and thus the Coriolis force is always from the suction side to the pressure side.As a result of the unsteady disturbance caused by the Coriolis force,the pressure side separation region of the ribs disappears in the contours.Meanwhile,the recirculation region of the suction side changes and its core shifts toward the mainstream.Compared with the stationary state results,the mainstream region is affected by the Coriolis force componentFzand the velocity is increased.The overall region also shows a“laminarized”trend,and at the same time,it shifts to the pressure side,compressing the formation of small vortices in the tip of a rib on the pressure side.According to the analysis,this phenomenon is due to the direct impact of the Coriolis force on the separation of the shear layer in the momentum equation.In addition,the Coriolis force generated by the velocity fluctuations has significant effects on different components of the turbulent stresses in the governing equations.
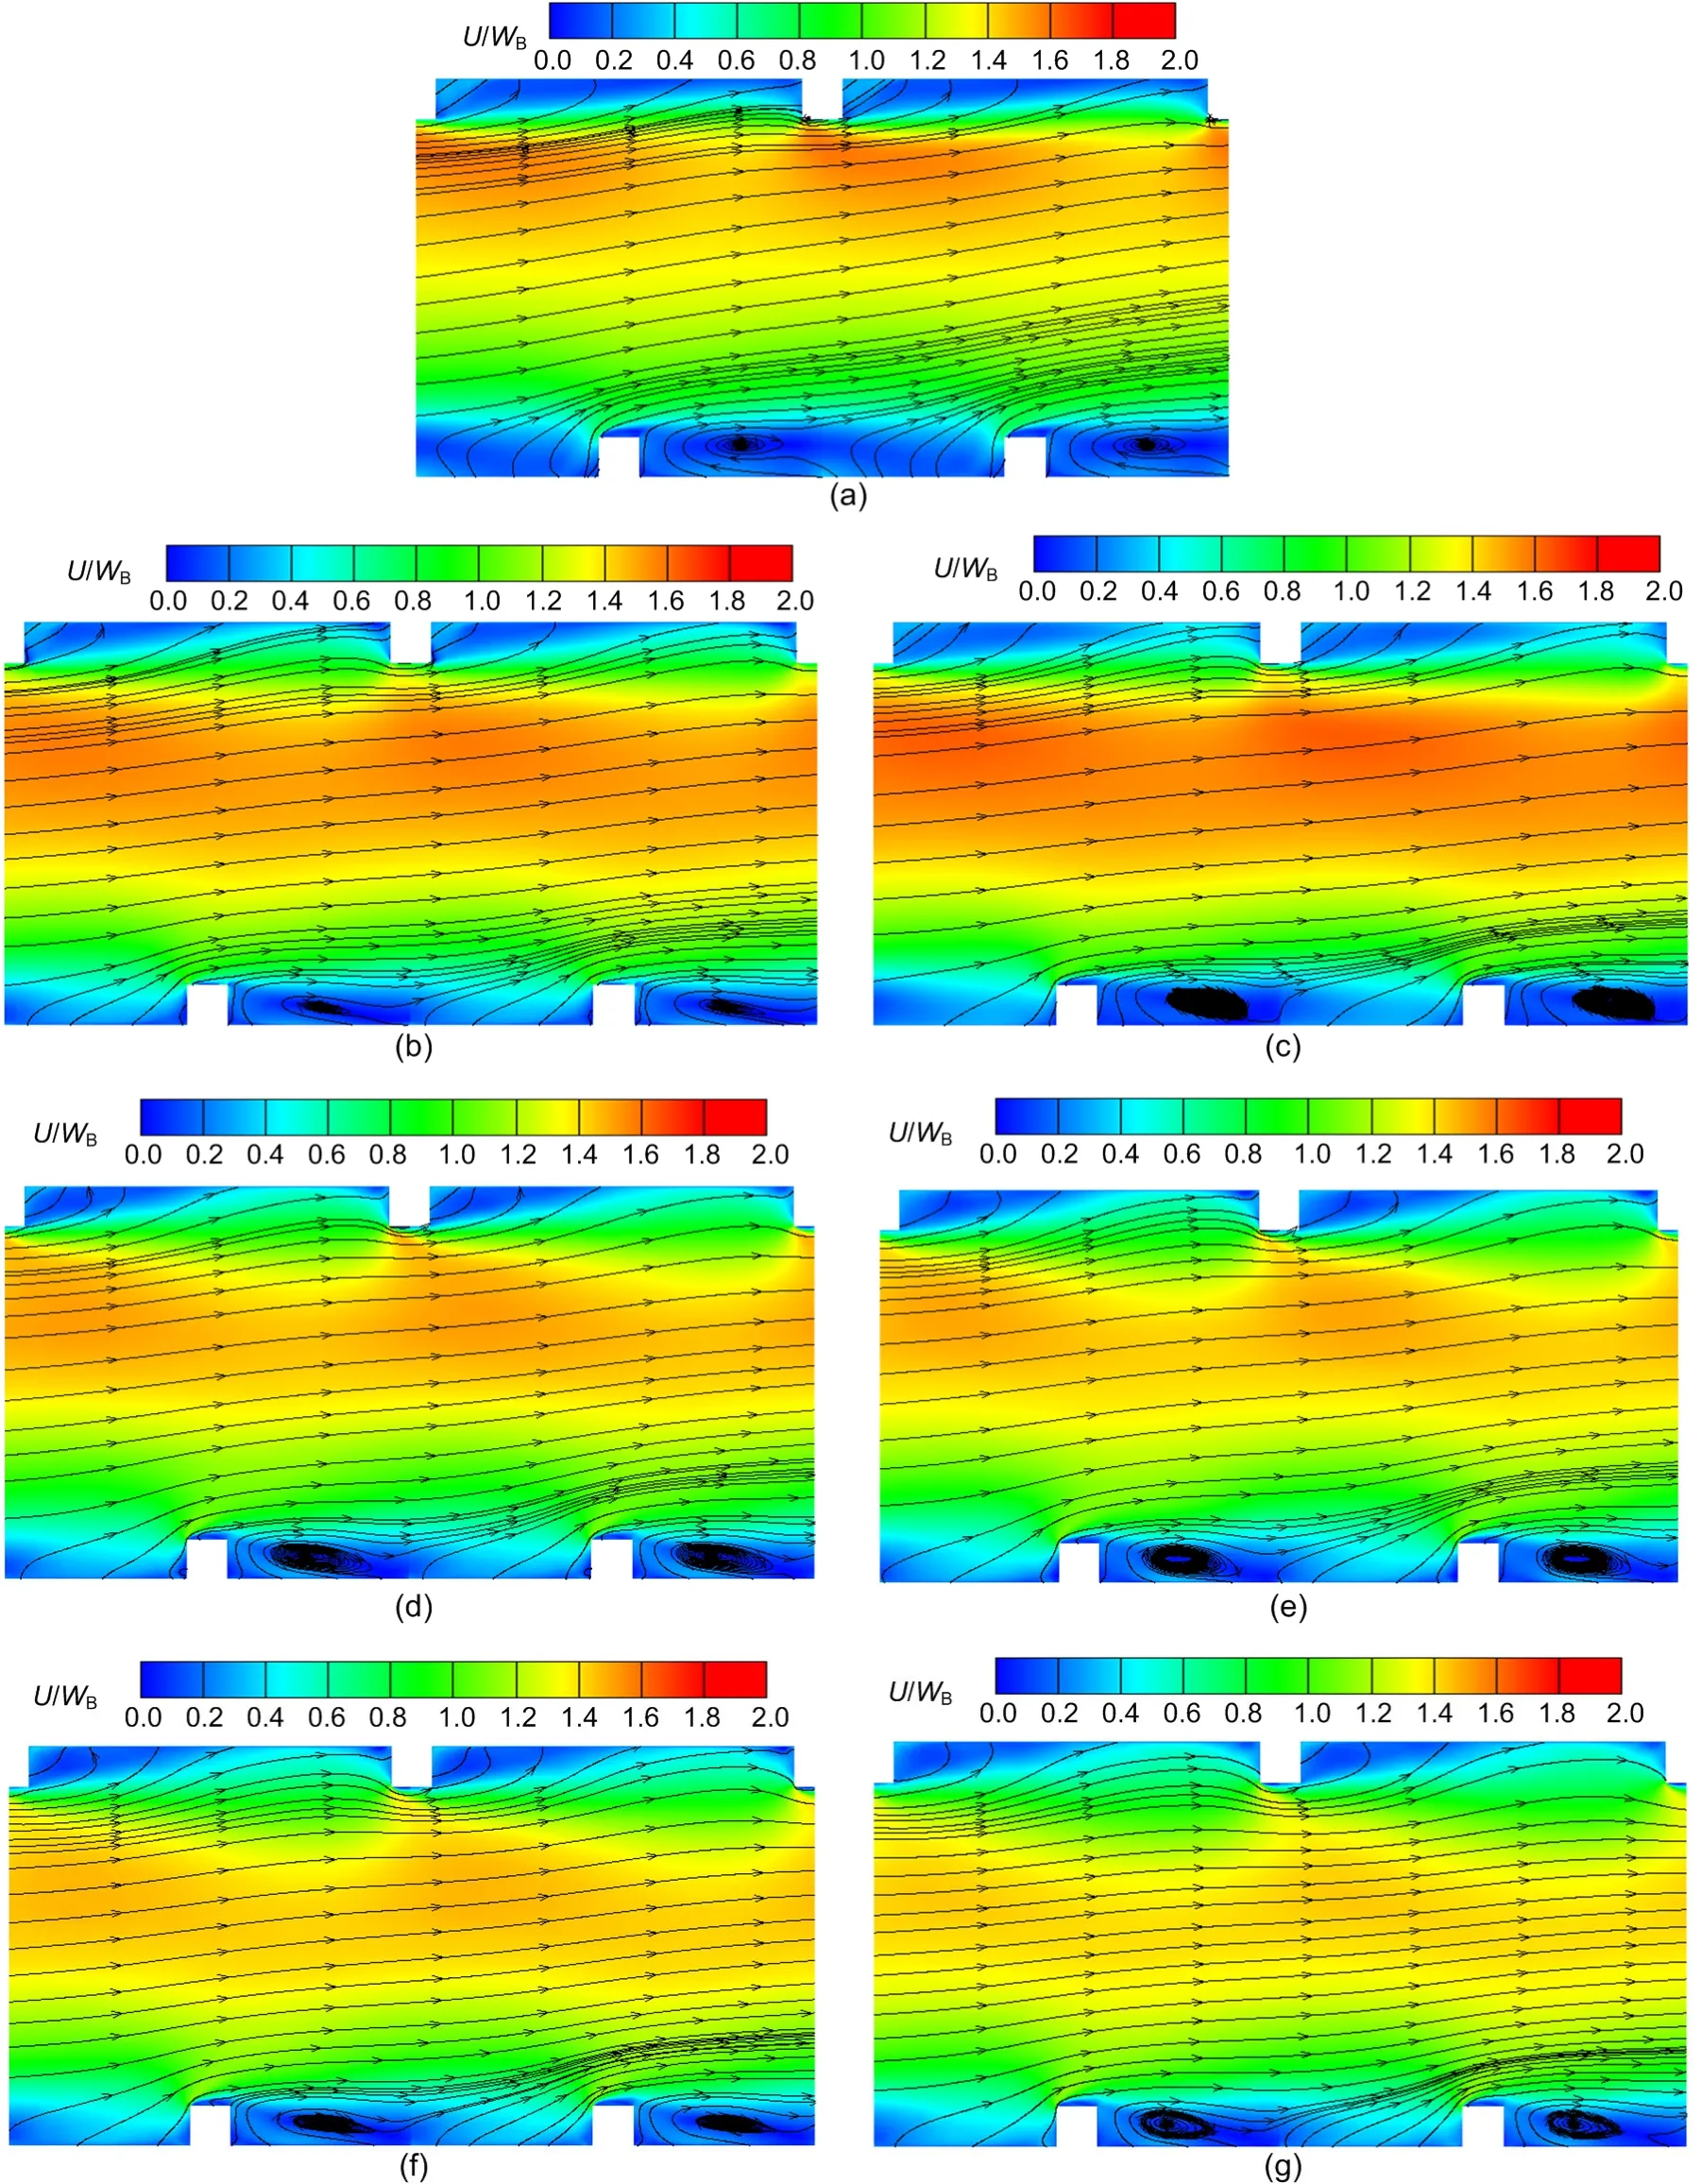
Fig.10 Time-average streamlines and non-dimensional velocity magnitudes by different turbulence models at the central plane with Ro=0.2
From the RANS,VLES,DDES,and LES results shown above,it can be found that,overall,the velocity slightly increases compared with the stationary state results.Table 2 compares the length of the recirculation region on the suction side calculated by different turbulence models.It is found that the results of VLES and DDES methods are generally close to each other in the rotating state.The lengths of the recirculation bubble obtained by LES with the WALE model and the dynamic Smagorinsky model are also in line with expectations and are close to the results of the VLES and DDES methods.For the RANS method,the result by the standardk-εmodel is close to the VLES result,while the other two RANS models give poor predictions.The result from thek-ωSST model is much larger,and the result from the Reynolds stress model is much smaller.Combining with the analysis and the comparison of the recirculation region,the present clockwise rotation can increase the length of the recirculation region on the suction side.
The length of the recirculation zone behind the pressure side ribs is presented in Table 3.The results obtained from all models show that,compared to the length of the recirculation zone on the pressure side in the static state,the length in the rotating state is increased.This may be due to the combined effects of the rotation and the staggered arrangement of the ribs.
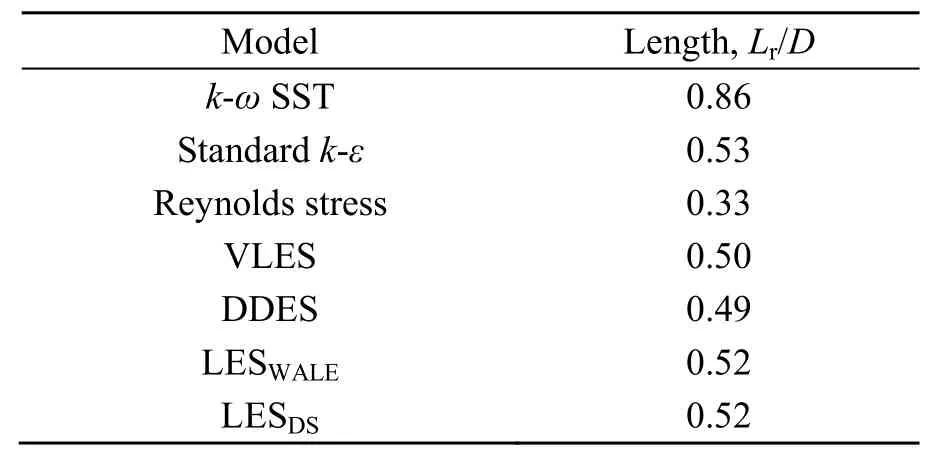
Table 2 Length of the main recirculation bubble on the suction side with Ro=0.2
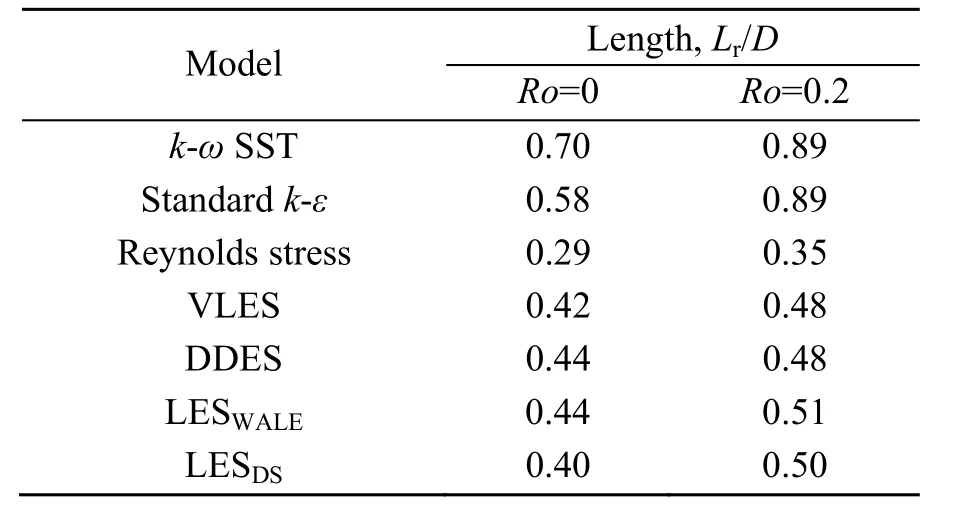
Table 3 Length of the main recirculation bubble on the pressure side by different models
Fig.11 presents the mean velocity distributions at four positions (Fig.1) calculated by different turbulence models on the central plane in the rotating state ofRo=0.2.The results show that the differences by different methods become larger than those in the stationary state.The VLES,DDES,and LES with WALE models perform better than the RANS models when compared with the experimental data,and their predictions are in good agreement with experiment.The velocity predictions by the RANS methods are considerably larger than those of the experiments,and the prediction by the LES method with the dynamicSmagorinsky model is generally smaller than the experimental result in the region close to the pressure side.According to the analysis,the mainstream region is affected by the Coriolis force and the fluid shifts to the pressure side,which is consistent with the results shown in Fig.10.From analysis at the position of line 1 it can be seen that,due to the Coriolis force,the turbulence level near the pressure side is relatively high (Fig.14).That is not well predicted by the RANS and LES (with dynamic Smagorinsky model)methods.On the pressure side in the lines 2 and 3,the RANS results are not accurate enough.This may be due to a poor prediction of the recirculation region and the shear layers formed by the unsteady effect caused by the Coriolis force.It should be noted that the position of line 3 is in the middle of the recirculation zone.Under the effects of the Coriolis force,strong momentum exchanges occur between the recirculation zone and the mainstream region and cause a peak velocity of line 3 in the present VLES method toward the suction side.The position of line 4 is located after the recirculation zone,where the momentum exchange becomes relatively weak,and the velocity distribution in the mainstream becomes more uniform.
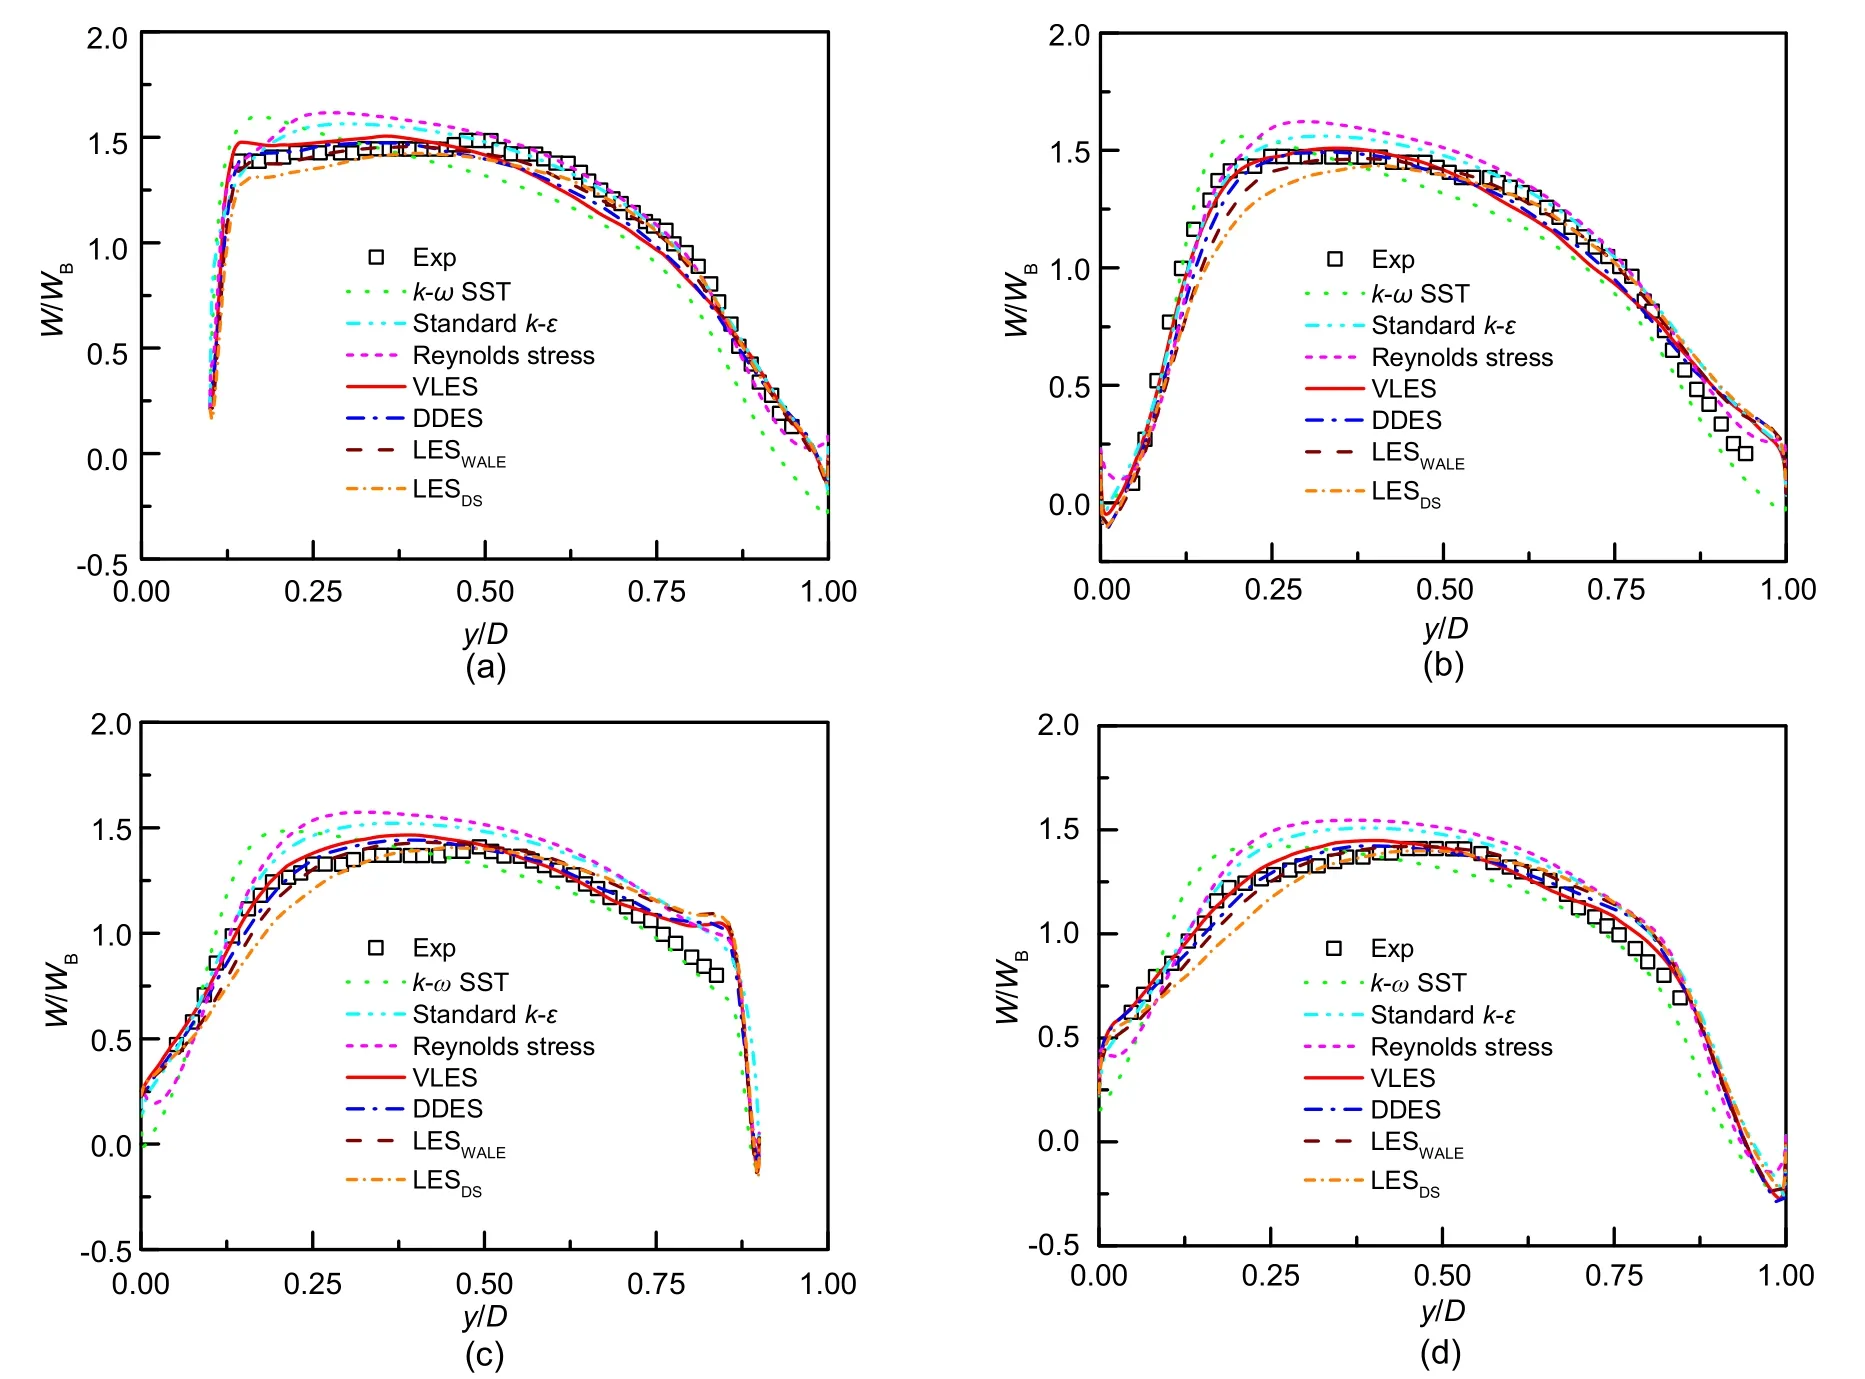
Fig.11 Mean stream-wise velocity profiles at different locations by different turbulence models with Ro=0.2
The 3D vortex structures by the present VLES and DDES methods are demonstrated in Fig.12 given by theQcriterion.Compared with the vortex structures in the stationary state,it can be observed that in the rotating state,the wall shear layer is more unstable,resulting in more complex vortex structures on the pressure side.In addition,using the same computational grid in the rotating state,the VLES method captures more vortex structures than the DDES method.Moreover,in the near wall region,the VLES method captures the development of the wall shear layer vortex structure and the flow separation vortex structure after the ribs.However,the DDES method fails to capture the small-scale vortex structures near the wall,especially the vortex evolution in the flow separation region.Thus,the VLES method is more reliable than the DDES method in accurately predicting the unsteady turbulence characteristics in the rotating state.
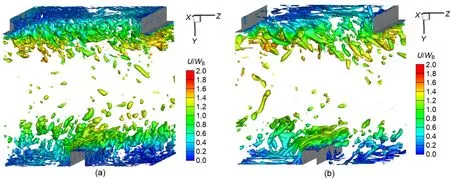
Fig.12 Vertical structures of asymmetric ribbed channel shown by Q criterion (Q=2×10⁵ s−2) and colored by non-dimensional velocity magnitude using VLES (a) and DDES (b) methods at Ro=0.2
Fig.13 shows the contours of the instantaneous stream-wise velocity at the central plane by the present VLES and DDES methods in the rotating state.It clearly shows that,near the wall region,especially in the recirculation zone,the VLES results have greater unsteadiness than those by the DDES method.The shear flow instability can be clearly observed.The low-speed region on the suction side is affected by the Coriolis forceFyand extends to the mainstream region,which is higher than the rib height.At the same time,it has strong momentum exchange with the mainstream.For the DDES method,a more pronounced recirculation zone can be observed.Thus,the overall low-speed region,which the DDES method shows,is elevated and the shear flow instability effect becomes weak.This indicates that the DDES method can predict large-scale vortex structures,but fails to predict the small-scale mixing layer instability,which is important for the accurate prediction of wall heat transfer.
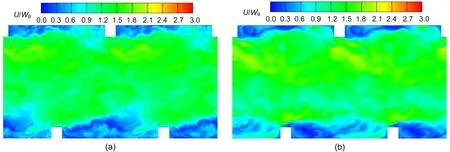
Fig.13 Instantaneous non-dimensional stream-wise velocity contours in the central plane by VLES (a) and DDES (b)methods with Ro=0.2
The stream-wise velocity fluctuation results are shown in Fig.14 at two locations calculated by the RANS,VLES,DDES,and LES methods in the rotating state (Ro=0.2).The peak value of the velocity fluctuations appears near the pressure side,at abouty/D=0.12.Moreover,the fluid near the suction side is affected by the Coriolis force and mixes with the mainstream but its strength is weaker than that of the mixing of the fluid near the pressure side with the mainstream.The velocity fluctuation shows a secondary peak at abouty/D=0.87.The results by the VLES,DDES,and LES (with WALE model) methods generally agree well with the experimental data.In some regions,there are relatively large differences between the results obtained by the LES method using the dynamic Smagorinsky model and the experimental data.Moreover,the RANS methods predict much larger velocity fluctuations,especially by the Reynolds stress model and thek-εturbulence model.
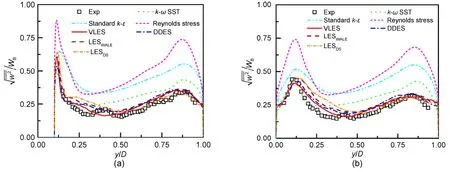
Fig.14 Stream-wise velocity fluctuations at different locations computed by different turbulence models with Ro=0.2
In non-rotating channels,the secondary flow is caused by uneven pressure and anisotropy of turbulent stress in the cross section.Although the secondary flow is weak,it has significant effect on wall heat transfer.Considering the rotation effect on the secondary flow in the ribbed channel,Fig.15 shows the time-averaged velocity and streamline distributions predicted by the present VLES method at different locations.At the four different locations,under the effects of the Coriolis force,there is a pair of strong counter-rotating vortex structures near the periodic surface,and the vortex core is shifted to the pressure side.At the locations ofz/D=0.25 andz/D=0.50,there is only one pair of counter-rotating vortices.This is probably because that these two sections are located behind the recirculation region of the rib on the suction side and the Coriolis effect is weak.The cross section ofz/D=0 is at the end of the recirculation zone.Due to the induction of the recirculation zone and the level of shear stress,a small vortex structure is generated near the lower end of the suction side surface(positive direction of they-axis).The cross section ofz/D=0.75 is located in the middle of the recirculation zone,and its vortex structure is more complex.Due to the strong flow interactions of different regions,complex turbulent structures appear near the region of the lower end of the suction side surface.
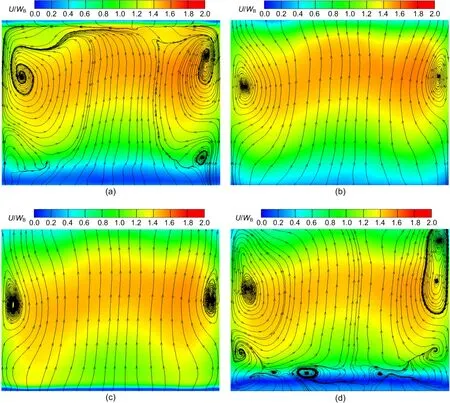
Fig.15 Time-average streamlines and non-dimensional velocity magnitude by the VLES method in the flow-normal(x-y) plane at different locations with Ro=0.2
3.2.3 Comparison of turbulence characteristics in stationary and rotating states
The results given above show the main turbulence structure and comparisons in the rotating state and the static state,indicating that the Coriolis force has a significant impact on the mean flow field and the vortex structure in the channel.The Coriolis force has a significant influence on the shear layer flow structure.It does not directly affect the shear layer but affects the generation of turbulent kinetic energy through Reynolds stress and the mean shear (Johnston,1998).The rotation term in the governing equation can weaken the turbulence intensity of the mean flow to a certain extent.However,under high Reynolds number,the shear stress cancels this effect,and the overall turbulence intensity can be enhanced.
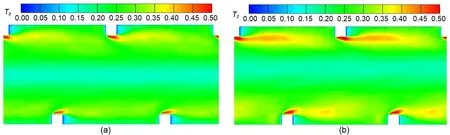
Fig.16 Turbulence intensity in the stream-wise direction (z direction) by the VLES method
From Figs.16 and 17 it can be seen that,under the condition of rotation,the intensity of turbulence is increased.The turbulence intensityTiin the figures is defined as,whereuiis the fluctuating velocity (i=x,y,z).Due to the high Reynolds number,the maximum turbulence intensity appears at the upstream end of the rib occupying a large region.In the static state,the maximum turbulence intensity near the ribs on the pressure side is about 0.54,and the maximum turbulence intensity in the rotating state increases by 17%.The turbulence intensity in the stream-wise direction on the suction side also increases in the rotating state.However,the turbulence intensity on the suction side is lower than that on the pressure side.This is due to the strong high Reynolds number effects of the shear layer.The fluid affected by the centrifugal force and the Coriolis force mixes with the main flow downstream of the rib tip,which increases the turbulent fluctuation.As for the turbulence intensity in the transverse direction,in the non-rotating channel,the fluid accelerates above the rib due to the smaller cross-sectional area.The maximum turbulence intensity appears above the rib,which is about 0.25.In the rotating state,on the central plane,the Coriolis force component and the turbulent shear effect partially cancel each other in the transverse direction.The turbulence change in transverse direction is mainly located in the central channel region and the low turbulence intensity region is moved to the pressure side,and the intensity of turbulence increases.
Fig.18 shows the contours of the resolved Reynolds shear stress,which clearly reflect the level of the shear stress.When the flow bypasses the rib,the turbulent shear stress increases above the rib.In the static channel,the magnitudes of the Reynolds shear stress on both sides of the ribbed channel are close to each other.The Reynolds shear stress in the rotating channel is significantly increased at both the pressure side and the suction side.
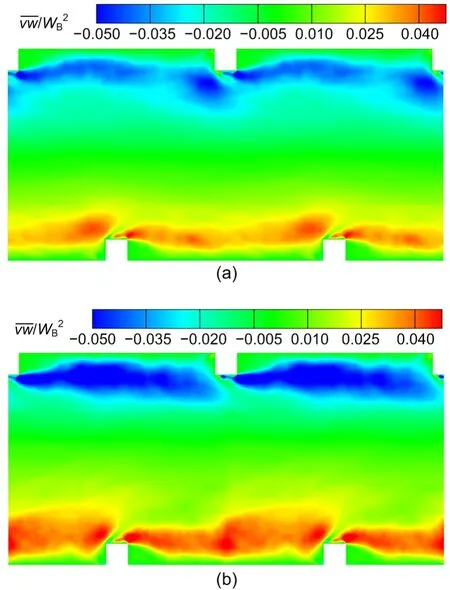
Fig.18 Contours of the Reynolds shear stress obtained by the VLES method (left-right)
The characteristics of turbulence anisotropy,defined by the ratio of turbulent fluctuation components,i.e.,are given in Fig.19.In the boundary layer near the wall on both sides of the channel,the turbulent anisotropy is very large,much greater than 1.0.In a static channel,the turbulent anisotropy is very strong in the rib tip region and it is weakened in the recirculation zone.In the downstream region above the ribs,local turbulence anisotropy increases significantly,which may be caused by the interaction between the turbulent shear layer and the separation structure disturbed by the ribs.In the rotating channel,affected by the Coriolis force,the turbulent anisotropy level is depressed significantly.
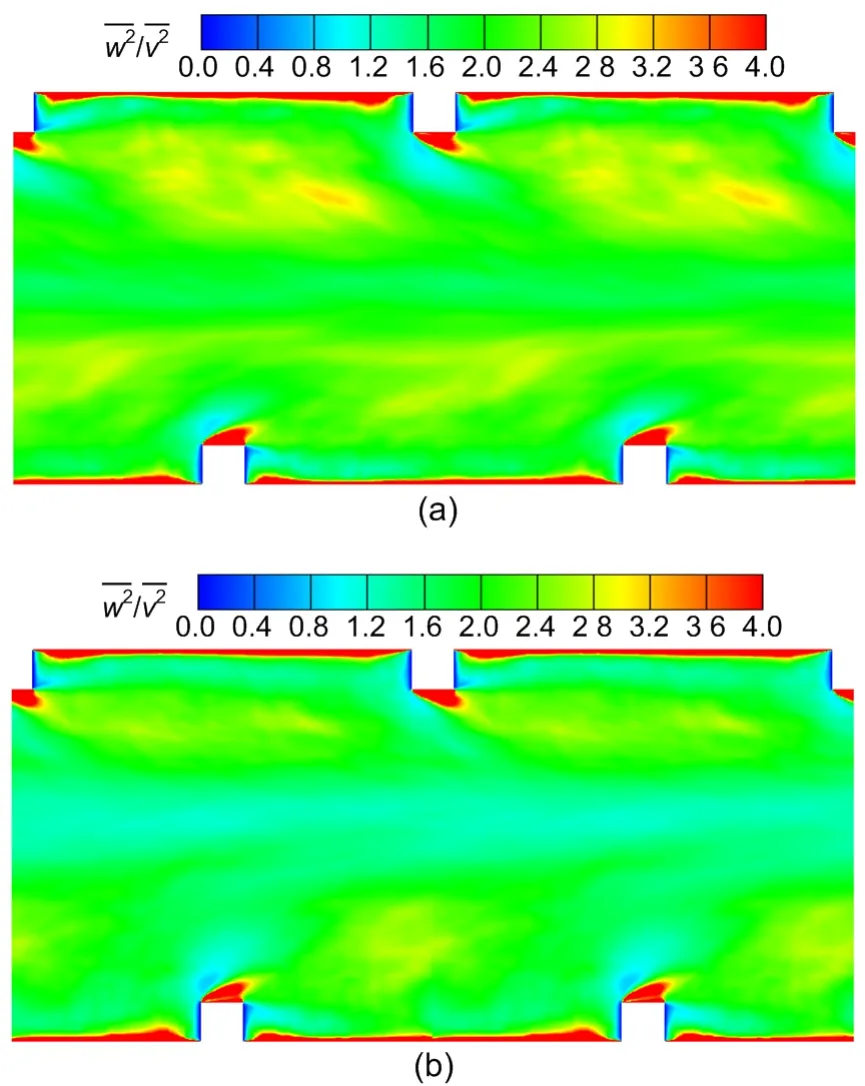
Fig.19 Contours of turbulence anisotropy resolved by the VLES method
3.3 Turbulent flow characteristics at different Ro numbers (Ro=0.1,0.2,0.4)
The analysis shown above has confirmed the accuracy and reliability of the present VLES method in predicting the turbulent flow characteristics in the ribbed channel under static and rotating conditions.In this section,the VLES method is further used to explore the effects of different rotational numbers on the channel flow characteristics.
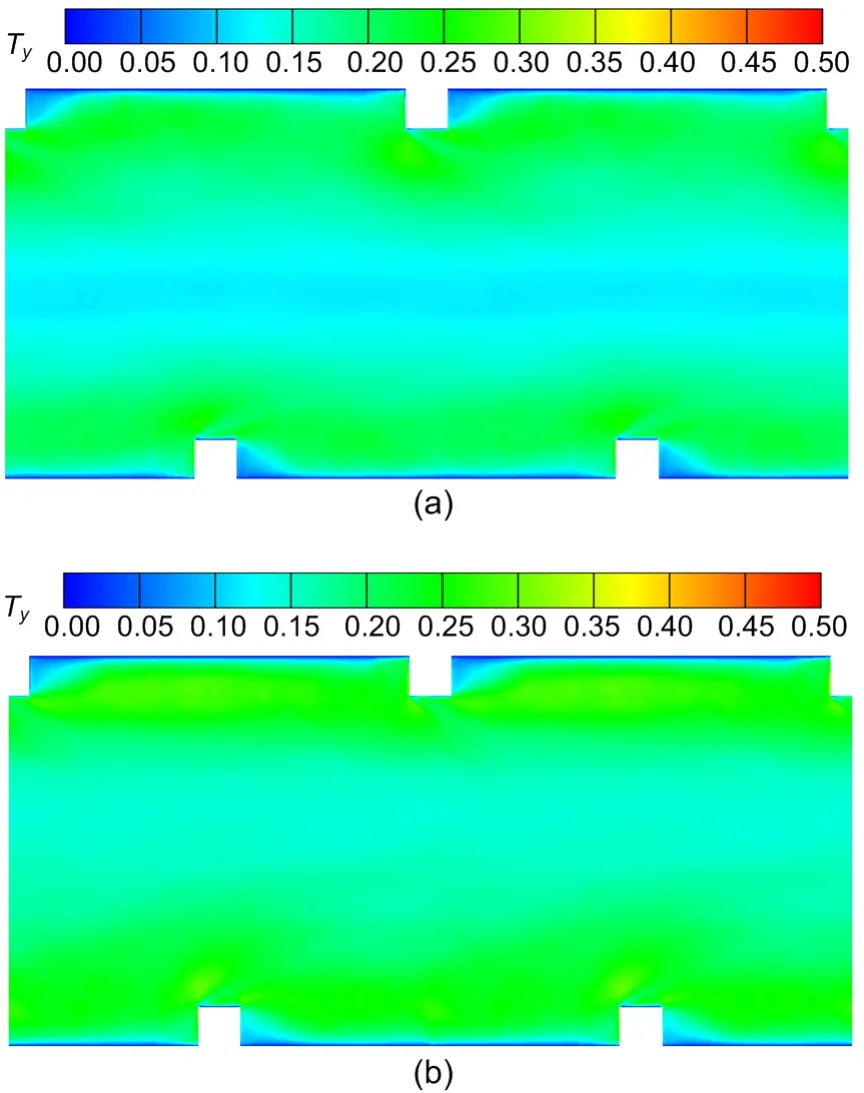
Fig.17 Turbulence intensity in the transverse direction (y direction) by the VLES method
Fig.20 shows the time-averaged velocity distribution contours and the streamlines with different rotational numbers by the VLES method.Compared with the flow structures in the static state,with the increasing rotational number,the effect of rotation enhances resulting in big changes of the flow structure.The flow separation of the shear layer and the recirculation zones caused by the ribs on the pressure side cannot be visually found in the centraly-zplane.As the rotation speed increases,the unsteady effect continues to increase.The vortex core near the rib on the suction side also gradually becomes larger,and the recirculation region shifts toward the mainstream flow direction with increase in the rotation number.The length of the recirculation bubble on the suction side with different rotation numbers is shown in Table 4,where it can be seen that the length of the recirculation bubble increases with increasing rotation number.The main flow region is affected by the Coriolis force componentFzand the velocity further increases with increase of the rotation number,which is consistent with the results shown in Fig.21.Table 5 shows the length of the recirculation zone on the pressure side.It can be found that the length of the recirculation zone increases with increasing rotation number.This may be due to the strong 3D effect of turbulent motion at high Reynolds numbers with the staggered rib arrangements,which delays the reattachment point.
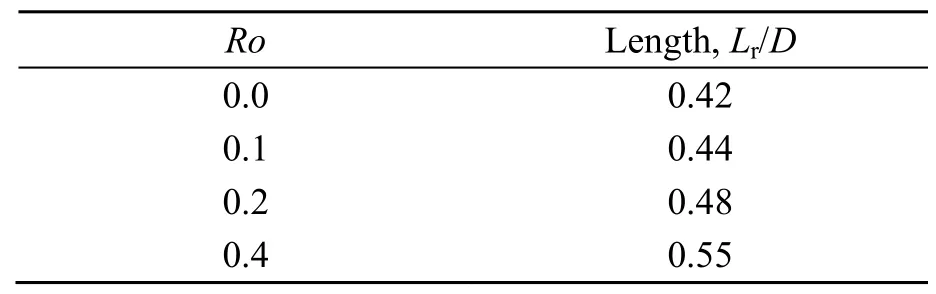
Table 5 Lengths of recirculation bubble with different Ro on the pressure side by the VLES method
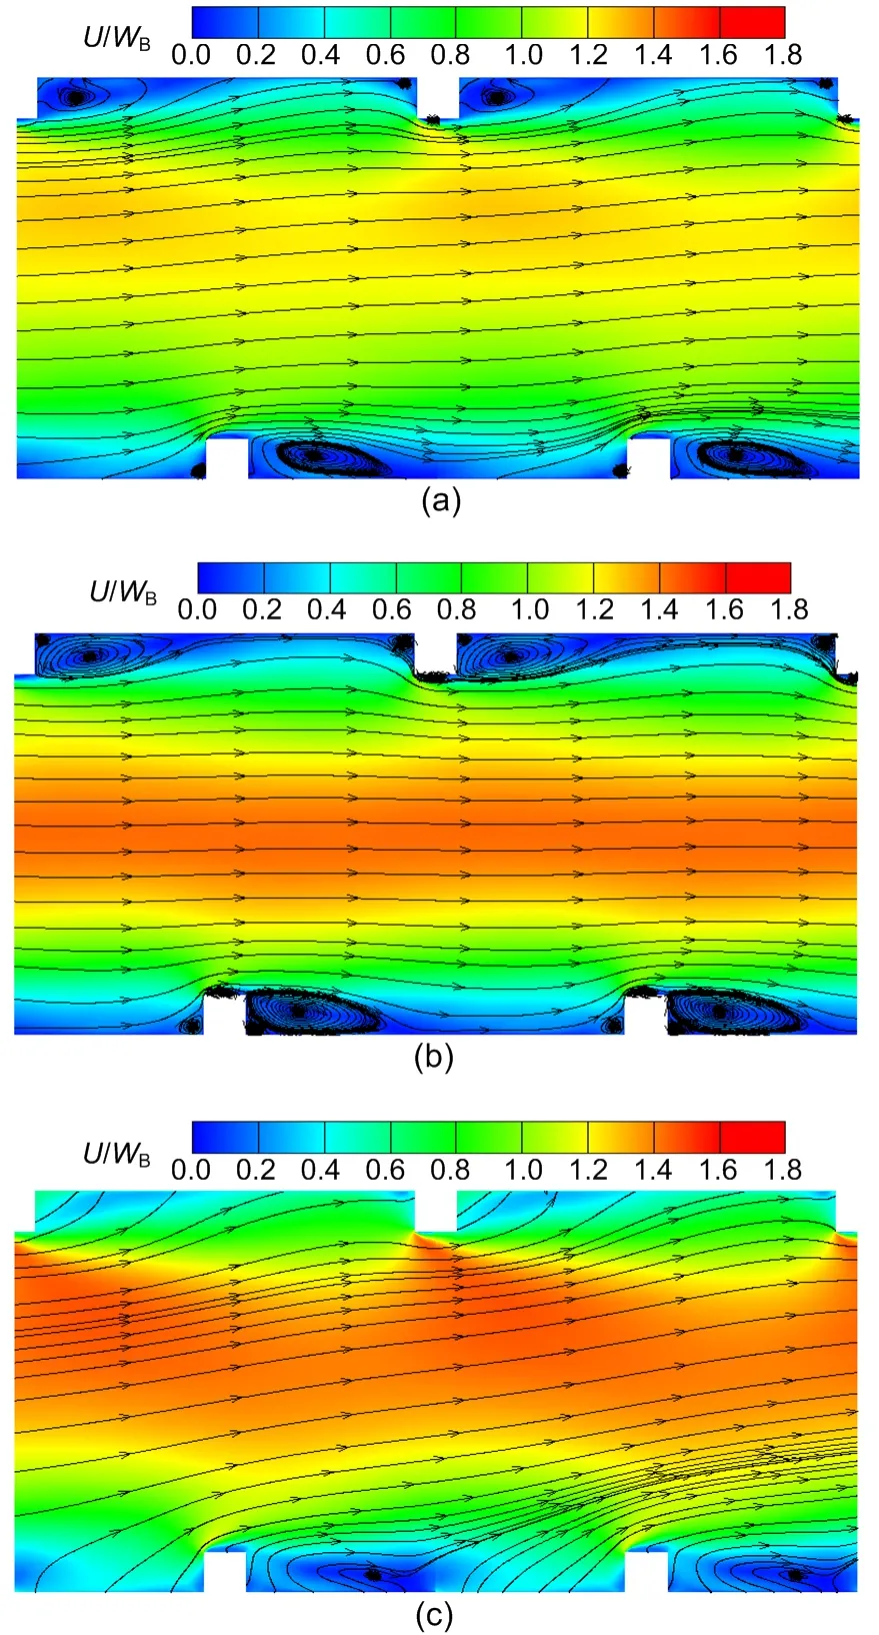
Fig.20 Time-average streamlines and non-dimensional velocity magnitude at the central plane by VLES method under different rotational numbers
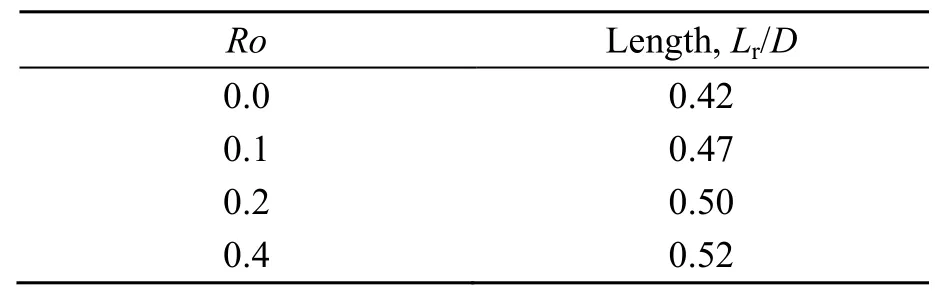
Table 4 Lengths of recirculation bubble with different Ro on the suction side by the VLES method
Fig.21 shows the VLES simulation results of the mean velocity distribution at two locations under different rotational numbers.It can be clearly observed that,with increase of the rotation number,the mainstream velocity is increased,and the exchange between the shear layer near the pressure side and the main flow becomes stronger.The fluid is also affected by the Coriolis forces near the suction side surface,shifting toward the mainstream.
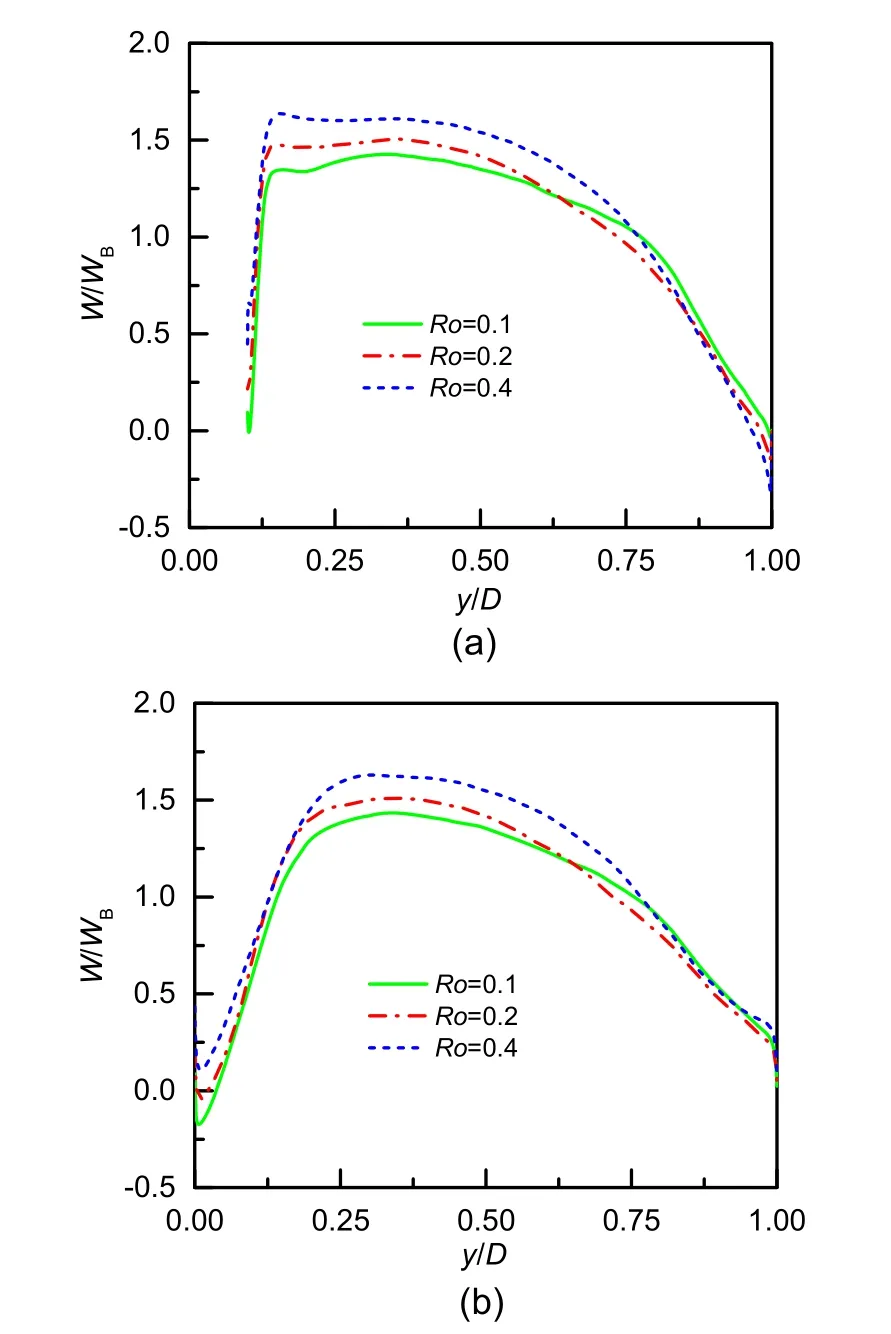
Fig.21 Mean stream-wise velocity profiles at different locations by the VLES method under different rotational numbers
To further explore the influence of the rotation number on the flow structure,Fig.22 shows the plots of the velocity fluctuations at different positions as resolved by the VLES method.Overall,with increasing rotation number,the influence of the Coriolis force on the flow is enhanced,and the velocity fluctuation along the stream-wise direction increases considerably.WhenRoincreases from 0.1 to 0.2,the fluctuation increment is within 10% in most regions and the peak fluctuation value near the wall remains unchanged.However,whenRoincreases from 0.2 to 0.4,the fluctuation velocity changes significantly,and the peak value of the fluctuation also increases significantly.This shows that when the rotation number increases to a certain level,the turbulent flow field will change significantly under a high Reynolds number.The lowest velocity fluctuation locates close to the central mainstream region in the channel.When the rotation number rises towards 0.4,the valley position of the velocity fluctuation moves toward the suction side wall.This may be caused by the stronger turbulent fluctuations in the pressure side which move the main flow towards the suction side under high rotation number conditions.At the positions of lines 1 and 2,the peak value of the stream-wise velocity fluctuation at the pressure side is much larger than on the suction side.The flow near the ribs at the pressure side is affected by the unsteady shear flow and Coriolis force,and the shear flow interacts with the separation flow resulting in higher peak value of the velocity fluctuation.The location of line 3 is right above the rib on the suction side wall,where there is flow separation and backflow at the pressure side,so the shear unsteadiness is great and the velocity fluctuation becomes strong.The location of line 4 is located in the recirculation zone of the suction side,and the shear unsteadiness is close to the level at the pressure side.
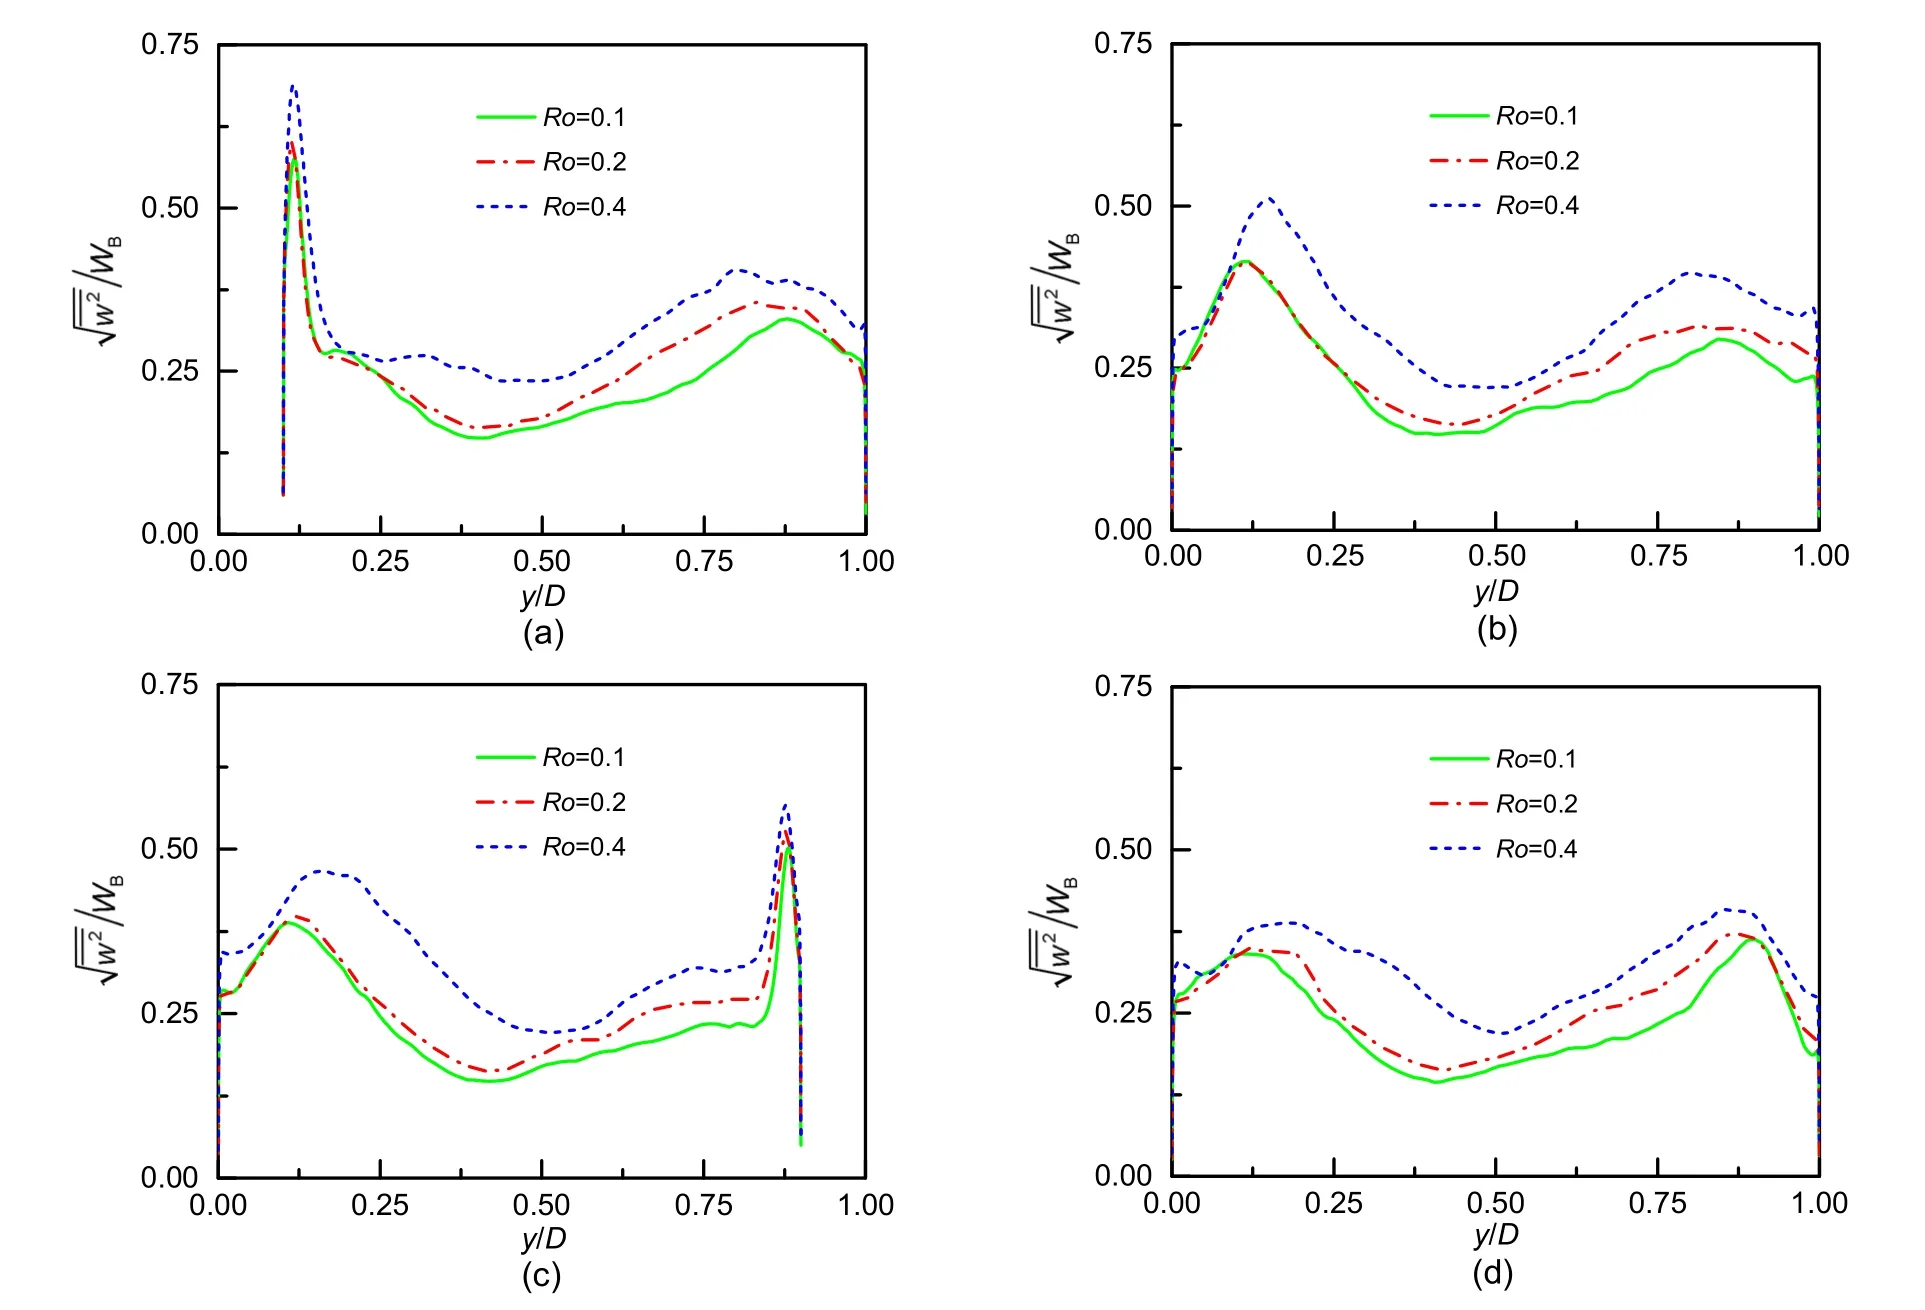
Fig.22 Stream-wise velocity fluctuations at different locations by the VLES method under different rotational numbers
4 Conclusions
In this study,a high-fidelity numerical simulation method of VLES,one of the self-adaptive turbulence modeling methods,is applied to study the rotational flow in a ribbed channel.The widely used DDES method in industrial applications,the LES method,and the RANS models includingk-ωSST model,standardk-εmodel,and Reynolds stress model are employed as comparisons.The analysis validates the advantages of the VLES method in capturing complex turbulent structures.In addition,the VLES method is used to study the rotational effects on the flow characteristics under different rotational numbers.The main conclusions are as follows:
1.For the ribbed channel flow at high Reynolds number ofRe=105under both the stationary state and the rotating state,the mean and fluctuation velocity results at different locations calculated by the present VLES method agree well with the experimental data,indicating that the VLES method has high accuracy and reliability in the flow analysis of ribbed channels under high Reynolds number and rotating state.
2.The DDES method produces satisfactory predictions of the mean and fluctuation velocities compared with the experimental data in the ribbed channel under both stationary and rotating states.However,the DDES method resolves fewer turbulence structures compared with the VLES method,i.e.only large-scale structures can be obtained by the DDES method.
3.Considering the RANS methods,thek-ωSST model,the standardk-εmodel,and the Reynolds stress model have moderate accuracy and reliability in predicting the mean flow field in the static state.However,all the RANS methods have significant disadvantages in dealing with the effects of the Coriolis force on the turbulent flow characteristics in the rotating state.The velocity fluctuations are also poorly predicted.This implies that the RANS method should be validated carefully before being applied in the rotational flow simulation of a ribbed channel.
4.The Coriolis force has significant effects on the flow structure in the ribbed channel.The mainstream region is shifted toward the pressure side and mixed with the pressure side shear layer.It produces strong momentum exchange.The Coriolis force also significantly changes the position and length of the recirculation bubble behind the ribs.The rotation also partly offsets the disturbance caused by the ribs.In addition,the secondary flow caused by the rotation causes a significant counter-rotating vortex structure inside the channel.
5.With increasing rotation number,the rotational effect is continually enhanced.The mainstream velocity generally increases.The separation region on the suction side is increased significantly.
The present study demonstrates the high potential of the newly developed VLES method for complex turbulent flow simulations under the rotational and high-Reynolds number conditions which are important in engineering applications.
Contributors
Xing-si HAN designed the research.Hao QIAN carried out the study and wrote the first draft of the manuscript.Tao GUO and Jun-kui MAO helped to organize the manuscript.Hao QIAN and Xing-si HAN revised and edited the final version.
Conflict of interest
Hao QIAN,Tao GUO,Xing-si HAN,and Jun-kui MAO declare that they have no conflict of interest.
 Journal of Zhejiang University-Science A(Applied Physics & Engineering)2021年7期
- Journal of Zhejiang University-Science A(Applied Physics & Engineering)的其它文章
- Effects of accelerated loading on the stress response and rutting of pavements*
- Molecular dynamics simulation and microscopic observation of compatibility and interphase of composited polymer modified asphalt with carbon nanotubes*