
Effects of accelerated loading on the stress response and rutting of pavements*
2021-07-28 08:36HailuYANGShuaijunWANGYinghaoMIAOLinbingWANGFengyanSUN
Hai-lu YANG ,Shuai-jun WANG ,Ying-hao MIAO ,Lin-bing WANG ,Feng-yan SUN†‡
1National Center for Materials Service Safety,University of Science and Technology Beijing,Beijing 100083,China
2Research and Development Center of Transport Industry of New Materials,Technologies Application for Highway Construction and Maintenance,Beijing 100088,China
3Joint USTB-Virginia Tech Lab on Multifunctional Materials,USTB,Beijing 100083,China
4Department of Civil and Environmental Engineering,Virginia Tech,Blacksburg,VA 24061,USA
Abstract:In order to assess the difference in performance of pavements under conventional loading and accelerated loading,in this paper,based on the characteristics of pavement strain recovery in accelerated pavement tests (APTs),we define accelerated loading and conventional loading in pavement permanent deformation research.The finite element method is then used to establish a flexible contact model between tire and asphalt pavement.By using simulation,the difference in dynamic stress and rutting of a pavement under the two different loadings is studied.It is discovered that if the APT forms an accelerated loading effect,the pavement will produce deeper rutting under the same axle loading cycle.
Key words:Accelerated pavement test (APT);Computational simulation;Finite element method;Road rutting;Asphalt concrete;Pavement deformation
1 Introduction
The fatigue life of pavement is affected by paving materials,pavement structure design,construction technology,service environment,and traffic loading.It is normally considered that studies on the service performance of pavement structure and materials,and the selection of construction technology,are all dependent on long-term observations in real projects (Hou et al.,2020).However,it is difficult to evaluate the performance of real pavement structures efficiently.
There are several methods for pavement structure performance testing,including laboratory and on-site experiments (Miao et al.,2016;Song et al.,2017) and full-scale accelerated pavement tests(APTs).Nevertheless,all these test methods have some limitations.The indoor laboratory test is the most economic approach,but the amount of information gained is limited and the reliability of the data is relatively low;APT is usually used to assess a specially constructed road or existing pavements and the loading device can apply loadings similar to actual traffic loading,while the loading frequency can be accelerated to shorten the test period.APT can be used to study the relationship between the load and pavement structure performance with reasonable accuracy and reliability,although the cost of this method is high.The finite element (FE) simulation method can make up for the limitations of experimental methods.The combination of test methods and the FE simulation method can be used to study all kinds of road engineering issues.
The development of full-scale accelerated pavement equipment started in Australia and New Zealand in the 1980s.According to the difference in trajectory of the loading unit,APT devices are mainly divided into two types:(1) the linear APT form,such as the mobile load simulator (MLS) (Huang et al.,2015) originally developed in South Africa,the accelerated loading facility (ALF) (Stuart et al.,2000) in Australia,the heavy vehicle simulator (HVS) (Sirin et al.,2008) in South Africa,and the accelerated transportation load system (ATLaS) (Dave et al.,2010) in UK;(2) the circular APT form,such as the Laboratoire Central des Ponts et Chaussées (LCPC)(Perez et al.,2007) in France and the Centro de Estudios y Experimentación de Obras Públicas (CEDEX)(Castro and Sanchez,2007) in Spain.
There have been many research projects on pavement structure performance evaluation using APT.A full-scale APT was conducted to determine the effectiveness of foamed asphalt-stabilized reclaimed asphalt pavement from full-depth reclamation (FAS-FDR) to act as a new kind of base material for flexible pavements (Romanoschi et al.,2004).By monitoring asphalt concrete pavement performance in accelerated pavement tests,damage development rules based on different mechanical models have been explored and verified (Bhattacharjee and Mallick,2012;Coleri et al.,2012).Several performance evaluations have been conducted with the help of APT:related to cracking (Wu et al.,2012) and rutting(Malysz et al.,2012;Kim et al.,2012;Ahmed and Erlingsson,2013;Nan,2013),on unbound aggregate(Li et al.,2012;Hussain et al.,2014),for reclaimed asphalt pavement (Kazmee et al.,2017),and in different countries (Baek et al.,2014).More specifically,APT has also played a significant role under heavy loads (Nguyen et al.,2017;Camacho-Garita et al.,2019) in determining pavement structure design parameters for pavement materials containing recycled asphalt pavement (RAP) aggregates and a hydraulic binder.To simulate realistic wheel loads in a short period of time by APT can greatly contribute to developing a non-destructive test method that allows the calculation of the remaining life-time of pavements(Wacker et al.,2016).The German Federal Highway Research Institute (BASt) has an APT device,Pave®MLS30,and has conducted several initial projects with it.It has established a new testing and reference area duraBASt which is located inside a large motorway cross section (Jansen et al.,2018).APT has also been employed to investigate the effects of temperature,interface bonding,and load level on the critical responses of airfield composite pavement(Ling et al.,2019).APT is a very efficient device for studying top-down cracks,which are one of the major distresses in pavement (Ma et al.,2018;Qian et al.,2019).
Although the development of the APT technique can significantly shorten the testing time for long-term pavement performance,it still has the shortcomings of a high electricity cost and a long testing cycle.Moreover,an APT test cannot fully reflect the damage in pavement under actual environmental conditions.It is therefore necessary to adopt a computational simulation.FE simulation and machine learning methods have also been used in pavement damage research (Gopalakrishnan,2008;Hou et al.,2020).The pavement mechanical response and loading conditions can be conveniently simulated with good economy using computation simulation.Prediction models to simulate the rutting performance of asphalt concrete pavement have been verified and calibrated according to APT results as well (Coleri et al.,2008;Su et al.,2008;Wu et al.,2011).In order to predict pavement response,a full-scale FE model has been used to analyze the dynamic response (Liu et al.,2018a).The 3D FE model was established by using the measured 3D tire contact stresses and comparing the prediction results with the measured transverse strains by a full-scale APT facility (Park and Kim,2010;Liu et al.,2018b,2019).A generalized layered linear viscoelastic (LVE) analysis was proposed for estimating the structural response of flexible pavements,and the method was also examined by several accelerated pavement tests (Ahmed and Erlingsson,2017).Some kinds of FE theoretical models and simulation technology are developing rapidly and some FE simulation software such as ABAQUS and ANSYS are very convenient to use.
Nevertheless,there are few studies on the difference between the effects of accelerated loading and conventional loading on the rutting process.There is also a lack of research on the mechanism of the accelerated loading effect in the process of rutting development.This paper studies the relationship between pavement recovery time and loading interval time in APT tests and defines accelerated loading and conventional loading.An FE simulation method is used to study different degrees of rutting development of a full-scale model pavement under accelerated loading and conventional loading.The results show that in an APT test,if the axle load and speed are in accelerated loading mode,the rut development speed is faster than that in the conventional loading mode,even if the loading axle cycles are the same.
2 Experimental stress and strain measurements of asphalt pavement under APT loading
The accelerated loading test of a full-scale pavement is an important way of studying its performance.In this study,the stress and strain data of a full-scale test road under a heavy axle load were monitored in the APT experiment.The vertical stress sensor,vertical strain sensor,transverse strain sensor,and longitudinal strain sensor were installed in the test road.The layout of sensors is shown in Fig.1a.The pavement structure is shown in Fig.1b.The top layer is stone mastic asphalt (SMA),and the mid layer and the lower layer are asphalt concrete (AC).The APT equipment shown in Fig.1c adopts a freight car axle as the loading unit with a double axle and eight wheels.The load is provided by a hydraulic device and the load range is 100–280 kN which can be adjusted steplessly.The APT is driven by a directcurrent motor and the speed range is 0–30 km/h.At the maximum load,the speed cannot exceed 20 km/h.The outer tires of wheelsets No.1 and No.3 drive directly over the sensors.The simulated loading vehicle adopts double axles with eight wheels for loading,and the total axle load is 27.56 t.The wheel group type is the double wheel group.The distance between the front and rear wheelbases is 1.35 m.The wheel sets and axle loads are shown in Table 1.In this test,four vehicle speeds were set to 7.2 km/h,10.0 km/h,12.6 km/h,and 18.7 km/h,respectively,and the data from the sensors were observed and recorded as shown in Figs.2 and 3.
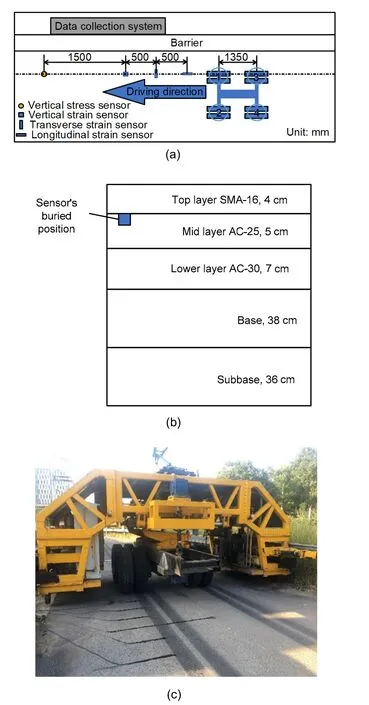
Fig.1 Full-scale test road under heavy load:(a) layout of the test;(b) sensor embedding depth;(c) vehicle loading site

Table 1 Axial load distribution
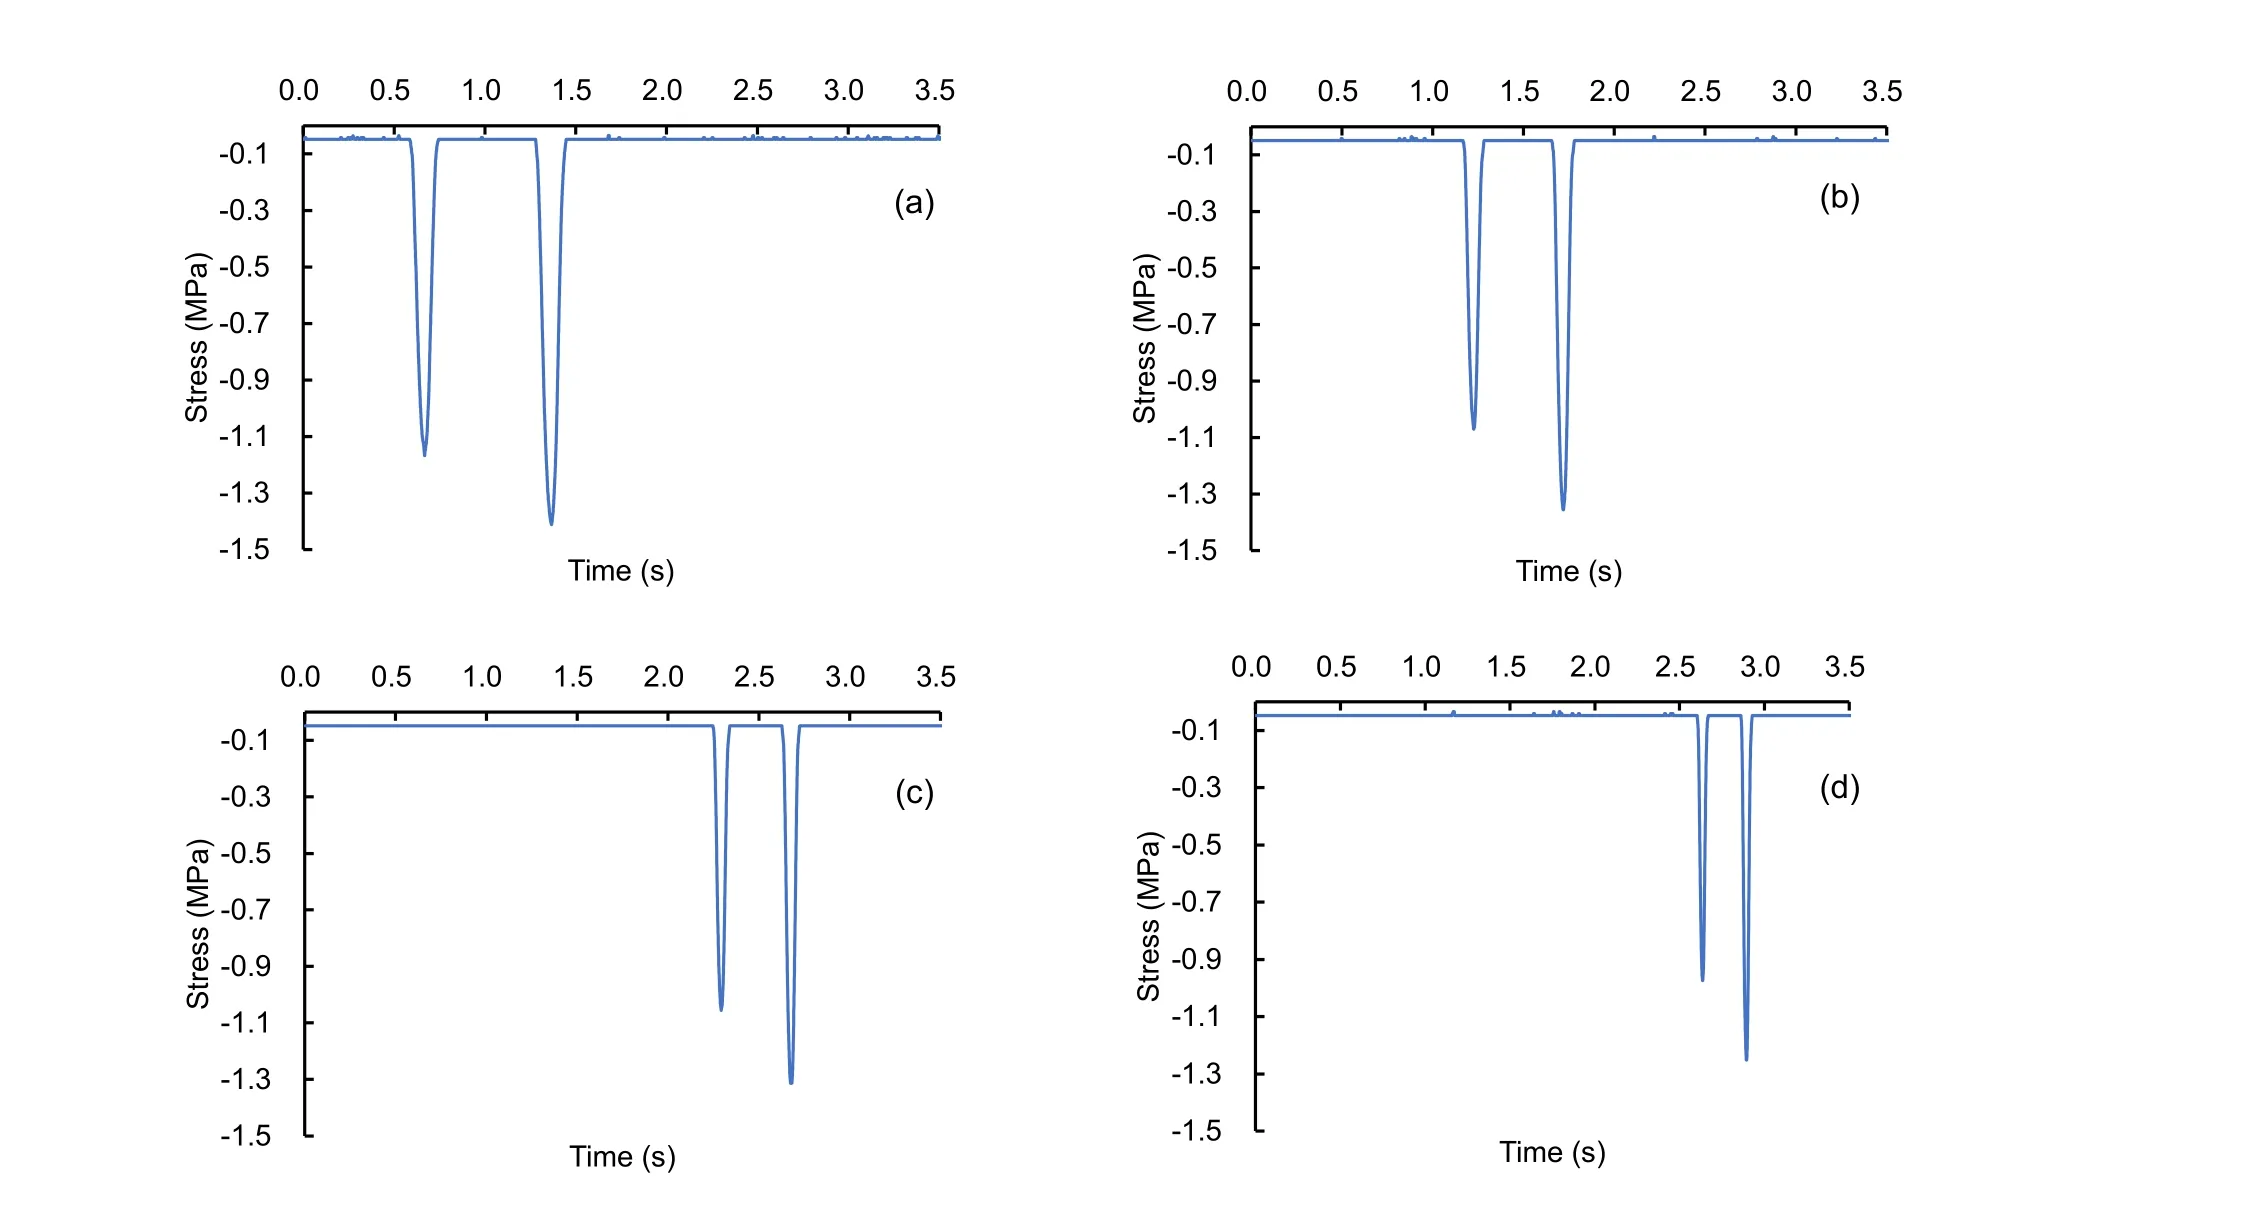
Fig.2 Vertical stress curves at different speeds:(a) 7.2 km/h;(b) 10.0 km/h;(c) 12.6 km/h;(d) 18.7 km/h
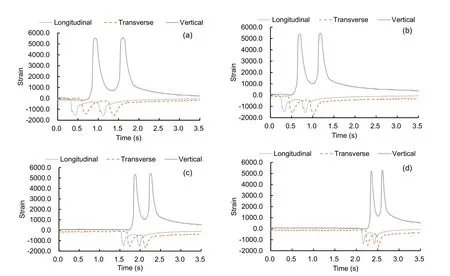
Fig.3 Three strain curves at different speeds:(a) 7.2 km/h;(b) 10.0 km/h;(c) 12.6 km/h;(d) 18.7 km/h
As shown in Figs.2 and 3,it can be seen from the time history curve that during the action of the front and rear wheels,the pavement vertical stress is completely released.Longitudinal strain and transverse strain are completely restored,but vertical strain is not completely restored.During the action of front and rear axles,the maximum values of vertical stress and strain in all directions,and the values of vertical residual strain are shown in Table 2.
From Table 2,with the increase of speed,the maximum values of stress and strain decrease,but the vertical residual strain is the opposite.With the increase of speed,the recovery of the vertical strain is less.Under equal load,the interval time of load action will also affect the permanent deformation of pavement.In this study,accelerated loading is defined as that where the pavement strain does not fully recover within the loading interval time under a repeated pulse load,and conventional loading is defined as that where the pavement strain completely recovers during the loading interval time.According to the relationship between vertical strain and vehicle speed and the creep deformation principle of pavement,it can be inferred that accelerated loading may aggravate rutting.Through the FE simulation,the influence of the accelerated loading on the permanent deformation of the pavement is analyzed.
3 Finite element tire-pavement contact model
In this study,a 3D dynamic tire-asphalt pavement contact model is constructed to simulate the rolling of tires on the asphalt pavement with the FE simulation software ABAQUS so as to investigate the mechanical responses of asphalt pavements under different conditions.
3.1 Tire finite element model
In this study,the tire material is simplified as pure rubber and treated as an incompressible or nearly incompressible hyperelastic material with high nonlinearity.Hyperelastic model theory mainly expresses the physical properties of rubber by a strain energy function.The Yeoh constitutive model (hyperelastic model) (Yeoh,1993) is employed to describe the mechanical properties of the rubber tire material,and is suitable for large deformations.The Yeoh model is a special form of reduced polynomial and its strain energy densityWfunction is as follows:

whereWis the strain energy density;I1is the first invariant of the strain tensor;C10,C20,andC30are Rivlin mechanical property constants of rubber materials and are obtained by uniaxial tensile tests.The material parameters of the tire input to ABAQUS are shown in Table 3.
The real tire materials and structures are commercial secrets and future studies will take this issue into consideration.In this study,the model of tire is simplified as a solid rubber tire with profile parameters according to Radial Tire 11.00R20 which refers to the Chinese Tire Standard (AQSIQ,2008).The model element type of the tire adopted in this study is eight node linear hexahedron element C3D8H.The profile parameters of the model are shown in Table 4.The geometry of the tire model is shown in Fig.4.
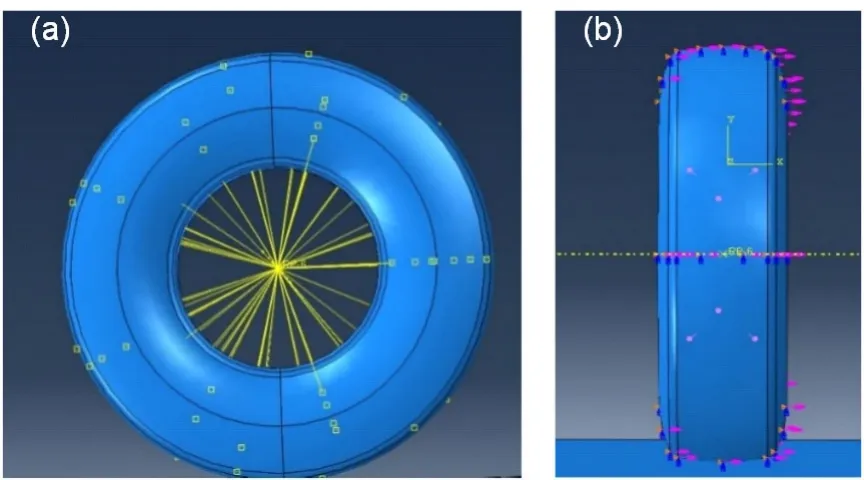
Fig.4 Tire model:(a) side view;(b) front view
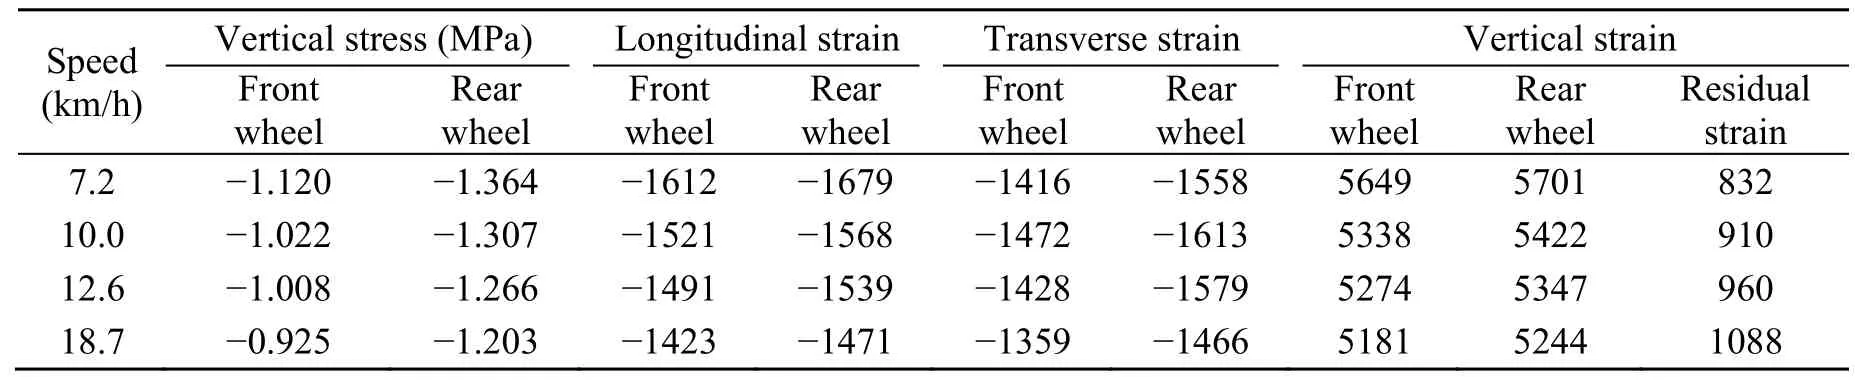
Table 2 Maximum stress and strain and vertical residual strain
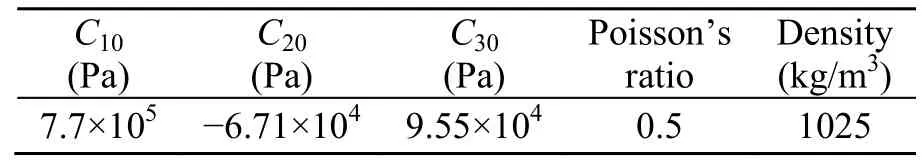
Table 3 Parameters of rubber model of the tire
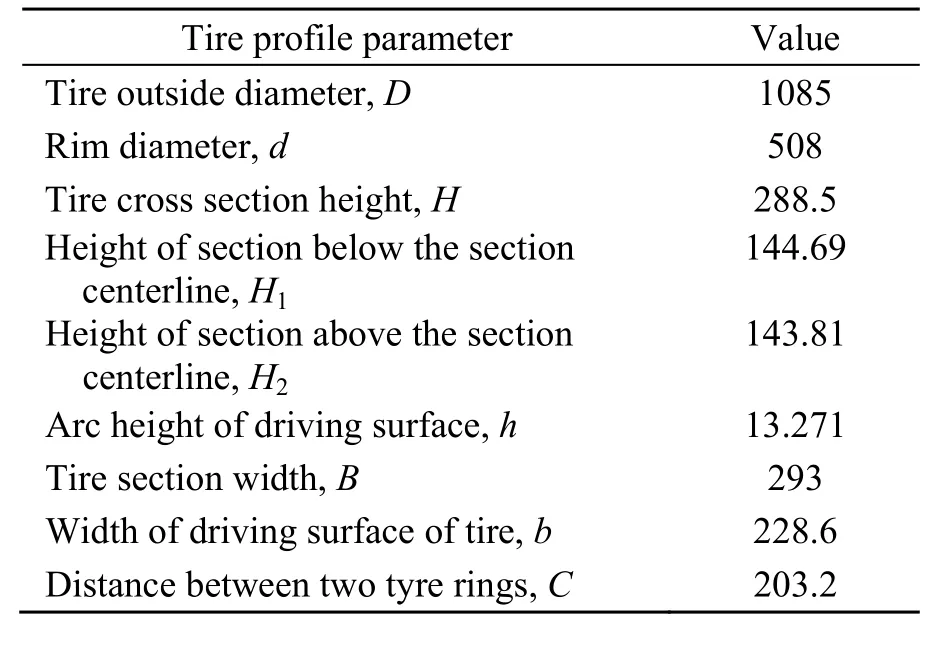
Table 4 Tire profile parameters (unit:mm)
In order to simplify the model,shorten the calculation time,and improve the efficiency of calculation,the following methods are adopted:the nonlinear boundary conditions of the contact between the tire and the rim are ignored.A uniform normal pressure (830 kPa) is defined on the inner surface of the tire to simulate the inflation condition.The pressure always acts vertically on the inner surface during tire deformation.Besides the vertical displacement,tangential displacement,and rolling of the tire,all other movements are restrained.
3.2 Finite element model of pavement structure
The pavement structure is modeled as a multilayer elastic system.The pavement structure is composed of a surface layer,a base layer,a subbase layer,and the subgrade.An elastic model is used for all the layer materials.In this study,the pavement materials of each layer are simplified as isotropic materials.
In the software ABAQUS,the elastic constitutive model follows Hooke’s law and the main parameters include elasticity and Poisson’s ratio.The Hooke’s law constitutive equation of elastic material is as follows:
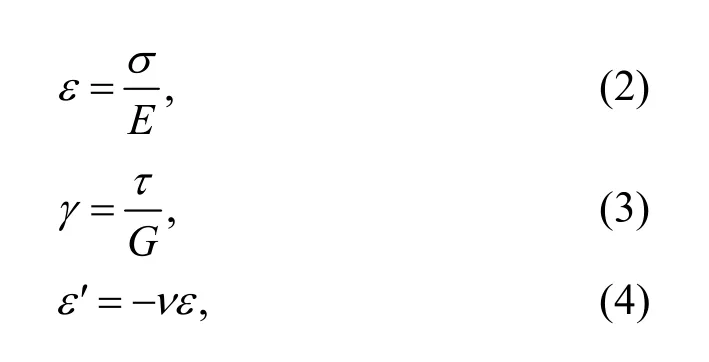
whereεis the tension and compression strain;σis the tension and compression stress;Eis the tension and compression modulus;γis the shear strain;τis the shear stress;Gis the shear modulus;ε′ is the transverse strain;νis Poisson’s ratio.Additionally,,so the parameters of the isotropic elastic material in the ABAQUS are justEandν.
In the ABAQUS software,the dynamic response of the pavement model was obtained by adding damping parameters.The damping model adopted Rayleigh damping.In the Rayleigh damping,it is assumed that the damping matrixCcan be expressed as a linear combination of the mass matrixMand the stiffness matrixK.The equation is as follows:
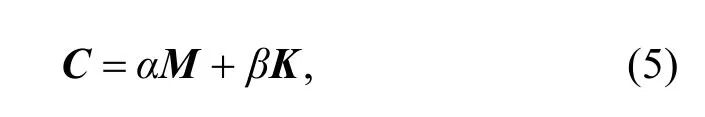
whereαis the model mass coefficient andβis the stiffness ratio coefficient.
In ABAQUS,the creep model of time hardening is generally used to analyze the permanent deformation of the pavement.The time hardening creep model in ABAQUS is expressed in terms of creep rateand the equation is as follows:

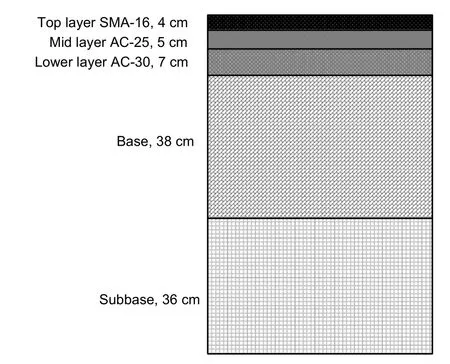
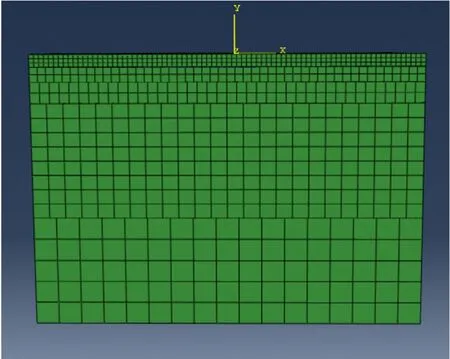
whereqis the stress;tis the time;A,n,andmare the model parameters and usuallyA>0,n>0,−1 In this study,the pavement surface is divided into three layers from top to bottom:stone matrix asphalt-16 (SMA-16),asphalt concrete-25 (AC-25),and asphalt concrete-30 (AC-30).The base is gravel and the subbase is the lime soil.The pavement structure used in the FE simulation is shown in Fig.5.The parameters of FE model are shown in Table 3 and Table 5 which refer to the pavement parameters in the study about dynamic response analysis of asphalt pavement under moving load (Dong et al.,2013). Table 5 Material properties of the full-scale pavement (Dong et al.,2013) Fig.5 Pavement structure in the FE simulation The model element type of the pavement structure adopted in this paper is a 3D solid element C3D8R.The pavement structure model is 12 m long,1 m wide,and 0.9 m high.The element density of the model becomes gradually sparser from top to bottom.The mesh of each layer in the model is as shown in Fig.6. Fig.6 Refined model of pavement structure In ABAQUS,the translational degrees of freedom along the coordinate axesx,y,andzare U1,U2,and U3,respectively.The rotational degrees of freedom along the coordinate axesx,y,andzare UR1,UR2,and UR3,respectively.The bottom of the model is constrained as U1=U2=UR3=0,the transverse direction of the road is constrained as U1=UR2=UR3=0,and the rest is unconstrained.In this study,there are four contact layers,each of which is constrained by continuous contact“tie.” The pavement is set as a fixed body and the concentration force is applied on the wheel rim as shown in Fig.4.The displacement and rotation angle of the tire are set as fixed constraints,and the reference point is established at the center of the tire and is coupled with the tire. Based on the actual contact state between the tire and the road,the contact of the model is set as face-to-face contact,as shown in Fig.7. Fig.7 3D contact model of tire and road surface:(a) side view;(b) front view The interaction between contact surfaces can be divided into normal behavior and tangential behavior.In the model,the normal behavior between the contact surfaces is defined as“hard contact”(separation after contact is allowed).In the ABAQUS software,there is no limit to the magnitude of the contact pressure transmitted by the two contact surfaces.When there is no force between the contact surfaces,the two contact surfaces are separated and the constraints on the corresponding nodes are released at the same time.This is referred to as hard contact.The tangential interaction between the contact surfaces should consider the mutual motion state of the two contact surfaces.The penalty function method is used for friction,which is isotropic and the friction coefficient is 0.3.A finite slip“surface to surface”algorithm is used to improve the accuracy of the calculation results. For the operation of the accelerated loading test device,three speeds (5.4 m/s,10.8 m/s,16.7 m/s) and four loads (25 kN,50 kN,80 kN,112.5 kN) are selected.Using the established 3D contact FE model built above,the stress distribution of the pavement in the contact area with the tire in three directions is simulated.The calculated results for the contact center are shown in Figs.8–10. In Figs.8–10,the time required for the road surface to fully recover from deformation is very short,mostly within 1 s.For the same speed,with a heavier loading,the stress amplitude of each direction on the road surface is larger,and the stress response time is longer;for the same load,with a higher speed,the stress amplitude of each direction on the road surface is smaller. In this part,we compared the pavement response under conventional loading and accelerated loading.The main difference between them is whether the vertical strain has completely recovered.In the conventional loading,the pavement structure is first subjected to the loading of the vehicle and the deformation of the pavement has recovered completely before the next loading.However,the loading frequency is much higher in accelerated loading,and the deformation of the pavement material has not completely recovered when the loading is repeated. On the actual accelerated loading device,the span between two loading units is 5.1 m.For different conditions as mentioned above,the repeated loading interval time and the strain recovery time of the pavement material in the accelerated loading test are shown in Fig.11. Fig.8 Transverse stress curves of pavement contact center under different speed conditions:(a) 5.4 m/s;(b) 10.8 m/s;(c) 16.7 m/s As shown in Fig.11,under different loads,when the speed is increased to a certain value,the loading interval time is shorter than the strain recovery time,indicating that the pavement material deformation is not fully recovered before the next loading.The larger the load is,the lower the critical speed is. Fig.9 Vertical stress curves of pavement contact center under different speed conditions:(a) 5.4 m/s;(b) 10.8 m/s;(c) 16.7 m/s Fig.10 Longitudinal stress curves of pavement contact center under different speed conditions:(a) 5.4 m/s;(b)10.8 m/s;(c) 16.7 m/s Fig.11 Comparison of pavement strain recovery time and loading interval time at different loading conditions As mentioned above,accelerated loading occurs when the pavement strain does not fully recover during the loading interval time.When the load is 25 kN,the accelerated loading will occur when the speed exceeds 11.8 m/s.When the load is 50 kN,the acceleration load will occur when the speed exceeds 10.3 m/s.When the load is 80 kN,the acceleration load will occur when the speed exceeds 9.2 m/s.When the load is 112.5 kN,the acceleration load will occur when the speed exceeds 8.3 m/s. Using creep theory and the parameters of pavement materials,in this section,the simulation analysis compares the development of rutting under accelerated loading and conventional loading under the same load and speed.In order to apply 10 000-time loading on the pavement model,the method of applying load function is used to load the model,which can improve the simulation efficiency and reduce the computation time.By controlling the loading interval time,accelerated loading and normal loading are respectively simulated.If the loading interval time is longer than the pavement strain recovery time,it is normal loading;if the loading interval time is less than the pavement strain recovery time,it is accelerated loading. When the load was 50 kN,the speed was 10.8 m/s and the loading was applied 100 000 times.The vertical displacement contours of the pavement surface under accelerated loading and conventional loading are shown in Fig.12.The vertical displacement curves of the contact center under accelerated loading and conventional loading are shown in Fig.13. Fig.12 Vertical displacement contours:(a) accelerated pavement test;(b) conventional loading (unit:m) Fig.13 Vertical displacement graphs on contact center:(a) accelerated pavement test;(b) conventional loading From Figs.12 and 13,it is seen that the vertical displacement of a conventional loading pavement is 2.3198 mm,while that of an accelerated loading pavement is 2.7464 mm.In this FE method,the vertical displacement is the rutting depth.Thus,the rutting depth of accelerated loading is greater than that of conventional loading,which indicates that the accelerated loading test results in more serious damage.This is consistent with the above predicted results of measured strain of the full-scale test pavement. In the simulation,after 100 000 loading cycles,the rutting depth of the surface under different working conditions is shown in Fig.14. It can be seen from Fig.14 that,at the same speed and loading cycles,the rutting depth increases with increased load.The rutting depth in the conventional loading test is less than that in the accelerated loading test.When the speed is constant,the loading period of the accelerated loading device is fixed,and the response time of the pavement is different.The longer the reaction time,the more the superposition of the material strain in the acceleration process,and the greater is the difference between the accelerated loading and the conventional loading.If other conditions remain the same,the larger the load,the greater the difference between the accelerated loading and the conventional loading test results;more serious damage to the pavement material is caused by accelerated loading. Fig.14 Rutting curves of accelerated and conventional loading pavements at speeds of 10.8 m/s (a) and 16.7 m/s (b) Fig.15 shows the effect of different loads on the ratio of the rutting depth of the accelerated loading versus the conventional loading when the speeds are 10.8 m/s and 16.7 m/s,respectively. Fig.15 Rutting depth ratios of the accelerated loading to the conventional loading at speeds of 10.8 m/s (a) and 16.7 m/s (b) As shown in Fig.15,when the velocity and the loading cycles are the same,the rutting depth ratio of the accelerated loading versus the conventional loading grows with the increase of the load.For example,at the speed of 10.8 m/s and 100 000 loading cycles,the ratio increases from 1.088 898 to 1.101 836.The larger the load is,compared with the conventional loading,the accelerated loading road tends to be damaged more seriously.When the speed and load are the same,the rutting depth ratio of accelerated loading to conventional loading gradually decreases with the increase in loading cycles.Taking the standard axle load of 100 kN (load of 50 kN) as an example,at the speed of 10.8 m/s,when the loading cycles increase from 10 000 to 100 000,the ratio falls from 1.131 659 to 1.088 898,which shows that with the increase of axial loading cycles,the difference of rutting depth between acceleration loading and conventional loading pavement becomes smaller. Compared with the laboratory test and long-term pavement performance observation,the APT,which has adjustable environment condition controls,short test time,and good repeatability,is one of the most effective methods of testing pavement performance.In this study,the FE method has been used to establish a flexible contact model between tire and asphalt pavement.By using simulation,the differences on the pavement response,stress,and rutting depth under accelerated and conventional loading have been studied.Some conclusions are given below. According to the vertical strain recovery time monitored in the process of full-scale pavement accelerated loading,this study defines accelerated loading as repeated loading whose vertical strain is not fully recovered during the loading cycle.Moreover,a hypothesis is that if the times between two adjacent loading times are less than the road strain recovery time,the road damage will be aggravated. Through FE simulation analysis,it is discovered that the accelerated loading can aggravate pavement rutting.This is because the road surface does not have enough time to recover deformation under accelerated loading conditions. According to the definition of accelerated loading in this study,the critical time interval for the phenomenon of accelerated loading decreases with the increase of axle load.In other words,under heavy load,low speed may also produce accelerated loading effects. Through FE analysis,the rutting depths of the road surface under conventional loading and accelerated loading are compared.When the speed and the loading cycles are the same,the rutting depth ratio of the accelerated loading to the conventional loading grows with the increase of the load.When the speed and load are the same,the rutting depth ratio of accelerated loading to conventional loading gradually decreases with the increase in loading cycles. Through the analysis of the influence of accelerated loading,it is possible to understand the law of pavement damage more thoroughly and to make a more reasonable pavement management and maintenance strategy. Contributors Hai-lu YANG and Feng-yan SUN designed the research.Hai-lu YANG and Shuai-jun WANG processed the corresponding data.Ying-hao MIAO wrote the first draft of the manuscript.Lin-bing WANG and Feng-yan SUN helped to organize the manuscript.Hai-lu YANG and Ying-hao MIAO revised and edited the final version. Conflict of interest Hai-lu YANG,Shuai-jun WANG,Ying-hao MIAO,Lin-bing WANG,and Feng-yan SUN declare that they have no conflict of interest.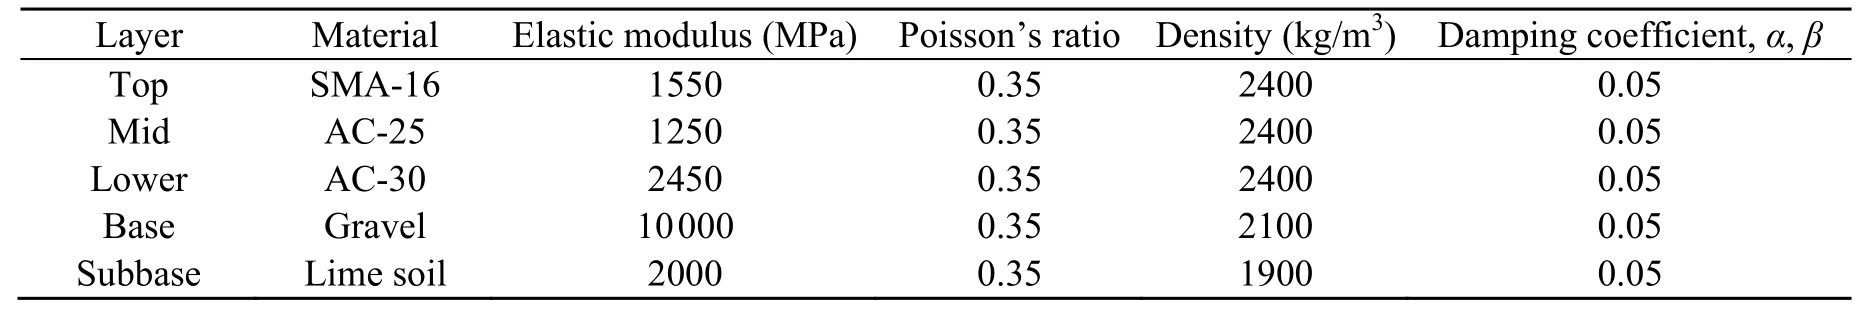
3.3 Contact model and boundary condition
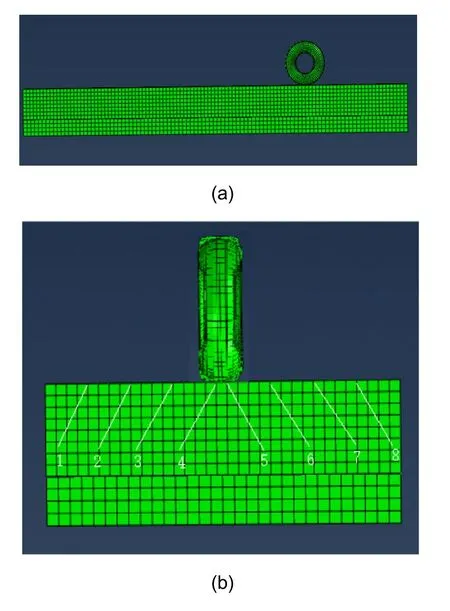
4 Dynamic response of an asphalt pavement
4.1 Stress response of a pavement under single axle load
4.2 Conditions for conventional loading and accelerated loading
5 Rutting comparison between accelerated loading and conventional loading
6 Conclusions
 Journal of Zhejiang University-Science A(Applied Physics & Engineering)2021年7期
- Journal of Zhejiang University-Science A(Applied Physics & Engineering)的其它文章
- Molecular dynamics simulation and microscopic observation of compatibility and interphase of composited polymer modified asphalt with carbon nanotubes*
- Very-large eddy simulation of the rotational effects on turbulent flow in a ribbed channel*