Time-resolved radial uniformity of pulse-modulated inductively coupled O2/Ar plasmas∗
Wei Liu(刘巍) Chan Xue(薛婵) Fei Gao(高飞) Yong-Xin Liu(刘永新)You-Nian Wang(王友年) and Yong-Tao Zhao(赵永涛)
1School of Optoelectronic Engineering,Xi’an Technological University,Xi’an 710021,China
2School of Science,Xi’an Jiaotong University,Xi’an 710049,China
3School of Aerospace Science and Technology,Xidian University,Xi’an 710126,China
4School of Physics,Dalian University of Technology,Dalian 116024,China
Keywords: plasma radial uniformity,pulse-modulated discharge,inductively coupled plasma,Langmuir probe
1. Introduction
Continuous shrinkage in the dimension of integrated circuits can cause some problems, such as differential charging, photon bombardment, and plasma nonuniformity,[1,2]which would cause a non-ideal etching profile in semiconductor manufacturing. To meet these challenges, pulsemodulated (pulsed) plasmas have been proposed lately. In pulse-modulated discharge, it can provide two more additional flexible knobs (pulse frequency and pulse duty cycle)to precisely control plasma parameters. Meanwhile, during the after-glow period of the pulsed plasma, the sheath will collapse, permitting charged particles to flow to the material surface to neutralize the charges accumulated on it during the etching in the active-glow period. Therefore, the etching selectivity,etching rate,and etching uniformity can be improved in pulsed discharge.[3,4]Owing to these advantages,the pulsed discharges need to be understood more specifically.
On the other hand,plasma uniformity plays a key role in semiconductor manufacturing. From the previous researches on the continuous wave(CW)discharges,it is found that some parameters, such as gas distribution,[5]power deposition,[6,7]and bias power,[8]could modulate plasma uniformity. By means of a hybrid model, Zhaoet al.[9]predicted that low CF4content could effectively improve the radial uniformity of the etch rate since the electron density has a smooth radial distribution. Moreover, a two-dimensional (2D) selfconsistent fluid model suggested that the addition of lowfrequency power could largely improve the plasma uniformity in a dual-frequency inductively coupled plasma(ICP).[10]Besides,some special geometric configurations of plasma source can also improve the plasma uniformity.For example,Overzetet al.[11]found that a Faraday shield can improve the plasma azimuthal uniformity, and Brckaet al.[12]used an integrated planar multi-coil to improve plasma radial uniformity in an ICP source. Besides,an external electromagnet can be an important role in improving plasma radial uniformity.[13]
By contrast, only a few researches about the plasma uniformity are carried out in pulsed ICPs. Subramoniumet al.[7,14]found that the azimuthal uniformity of the Cl2and Ar plasmas can be improved with the adoption of the pulsed scheme. In detail, when the power deposition is interrupted (i.e.power shut down in the after-glow period), the induced electric field (originated from the radio-frequency source power) and the self-build electric field (derived from the ambipolar diffusion)would disappear ultimately. As a result, the distributions of charged particles (electron and ion)both in azimuthal and radial directions become much more uniform in the after-glow period due to the diffusion processes. Bannaet al.[3,4]found that the radial uniformity of the etching rate can be improved in the synchronous pulsed plasmas comparing with that in the CW discharge,which is similar to the conclusion aforementioned. Moreover, the plasma uniformity can be improved by the gas convection during the after-glow period.[15]This is because when the power is turned off,the energetic electrons are depleted quickly,resulting in weaker momentum transfer processes. Consequently,the cold gas which near the chamber wall rapidly moves toward the reactor center and causes a more uniform gas distribution at the beginning of the next pulse period. Besides,the O containing plasmas have been widely applied in industry for etching,[16]cleaning,[17]layer deposition[18]processes,or plasma sterilization.[19]Due to its high reactivity atomic oxygen is of major interest in all these applications,but the radial uniformity about the pulsed O2ICPs is rarely studied.
In conclusion, in pulsed discharges, the plasma uniformity in the active-glow period is responsible for the etching profiles directly. However, the plasma uniformity in the after-glow cannot influence the etching directly. But the electrons/negative ions in the after-glow will neutralize the accumulated charge on the surface/trench and bringing a better work condition for the next etching process in activeglow.[20,21]This means the etching performances depend on the plasma uniformity. Therefore, the investigation of the radial distribution of the plasma density becomes necessary. In this paper,the time-resolved electron densities(ne)at different duty cycles in the radial direction are measured by a Langmuir probe in the pulsed inductively coupled O2/Ar plasmas. And then a nonuniformity factorβ, which is calculated by the radial evolution ofne,is introduced to analyze the plasma radial uniformity. To facilitate the explanation of the temporal evolutions of plasma radial uniformity in active-glow and afterglow,the discussion has been made in Subsections 3.1 and 3.2 respectively.
2. Experimental setups
The schematic diagram of the pulsed discharge apparatus(planar-type) together with a time-resolved Langmuir probe and an optical probe diagnostic systems are shown in Fig.1(a).The vacuum chamber is stainless with a discharge chamber of 30 cm in diameter and a diffusion chamber of 40 cm. A twoturn discharge coil, cooled by deionized water, is placed on the top of the quartz window(sealing the top of the discharge chamber). The substrate table is 24.4 cm in diameter, and it is fixed at 10.5 cm below the quartz window. An arbitrary function generator (AFG, Tektronix AFG 3252C) is used to generate a radio frequency(RF)signal of 13.56 MHz. The RF signal has then been transported into the amplifier to output the RF powers. After that, the RF power is coupled into the plasma through an individual matching box. In the pulsed discharges, before the RF signal being amplified, it will be first modulated by a pulse signal (square wave signal, generated by a pulse generator).[3]The pulse frequency is set as 1 kHz(1 ms) in this experiment. In the semiconductor manufacturing field, the pulsed plasma is used to adjust the plasma density (e.g.atom oxygen (O) or the chlorine atom (Cl)) and to reduce the charging effect during the etching processes. However, ions/particles have a much slower response time due to their large mass. This means the choice of a suitable pulse frequency will fulfill some special purposes requirements.[22]The input power(300 W–600 W)referred in this paper means the peak power during the active-glow period of a pulse cycle.
The O2/Ar mixture gas is injected through some annular evenly spaced pinholes around the quartz window. As a result,the effect of the injected gas azimuthal nonuniformity can be reduced greatly. Although the gas exhaust port (35 cm below the substrate table)may cause the gas nonuniformity. But for the basic discharge conditions in this study,i.e.,10 mTorr(1 Torr=1.33322×10²Pa), O2/Ar=95/5 and total flow rate of 50 SCCM,the residence time of the feed gases in the chamberτres=pVchamber/Qis about 2 s,which is much longer than the pulse periodτpulse=1 ms(1 kHz). Here,pis the gas pressure,Vchamberis the chamber volume, andQis the total flow rate of the feed gases. As a consequence,the azimuthal asymmetry of the plasma density can be neglected.[7]
In this experiment, the time-resolved Langmuir probe(Impedans ALP System) is mounted at 3 cm above the substrate, and it can be moved in the radial direction. The probe tip is made of tungsten with 5 mm in length and 0.1 mm in diameter. The Langmuir probe used in this experiment is triggered by the pulse signal which is also used to modulate the RF power. This means the probe can be triggered with the plasma synchronously. Because the pulsed plasma characteristics repeat at each pulse period,the measuredneat different radial positions can be treated as measured in one pulse period.The function of the Langmuir probe in the pulsed plasma can be explained in the following text. The scan voltage starts from the negative voltageV(always set to be negative to collect ion current). When one pulse signal comes to trigger the probe, the scan voltage will move to a higher voltageVstep1(Vstep1=V+∆V) with the step voltage ∆V(step voltage).When the scan voltage arrives at the setting max voltageVmax,we can achieve anI–Vcurve. When this process is repeated
50 times,we will have an averageI–Vcurve at each time point during the pulse period. Then the temporal variation ofnecan be achieved. According to the second derivative of theI–Vcurves, the temporal evolutions of the electron energy distribution function(EEDF)

can be obtained,[23]wheremeis the electron mass,eis the elementary charge, andAis the probe areaV=φP−VB,φPis the plasma potential, andVBis the scan voltage applied on the probe. Since−eV=ε,the time-resolved electron density(ne)and effective electron temperature(Teff)can be calculated through

Besides, the emission intensity of Ar 750.4 nm is measured by a Princeton spectrograph[24]via an optical probe to investigate the energetic electrons.The optical probe is assembled with an optical fiber inside a ceramic tube(2 mm×3 mm in inner and outside diameters). In order to collect the approximately linear integral of plasma emission spectra intensity,the optical fiber has been pulled back away 10 mm from the open end of the ceramic tube port, see Fig. 1(b). The other end of the optical fiber is connected to the spectrograph which passing through a vacuum sealed flange to measure the plasma emission spectra intensity. The optical probe is placed at the same location as the Langmuir probe (3 cm above the substrate table) (see Fig. 1(a)). Since the excitation threshold of Ar 750.4 nm(13.48 eV)is higher than that of most ionization reactions in O2/Ar plasmas,[25]the emission intensity of Ar 750 nm can represent the concentration of high energy electrons to some extent.

Fig. 1. (a) The schematic diagram of planar-type inductively coupled plasma reactor together with a time-resolved Langmuir probe system and the optical probe,(b)the schematic diagram of the optical probe.
3. Results and discussion
3.1. Active-glow period
The temporal evolutions ofneat different radial positions are shown in Fig.2 at the duty cycles of 30%,50%,and 80%.The input power is 300 W and the gas pressure is fixed at
10 mTorr. For each duty cycle,neexhibits similar temporal evolutions at different radial positions,i.e., when the pulse is turned on,neincreases slowly at first, and then it grows dramatically, after that, it increases slowly again (initial activeglow)until it almost keeps constant(steady state). To clearly exhibit the variation ofneradial distribution at different times during the active-glow period,the evolutions ofneversusthe radial position at the duty cycle of 30%are plotted,as shown in Fig.3. Obviously,the difference ofnebetween each radial position becomes larger at the steady state(300µs)than that during the initial active-glow period(less than 200µs). In detail,at the early stage of active-glow(40µs),the radial distribution ofneshows a relatively flat profile. However,as time goes on,a parabola-like distribution is built gradually untilt=300µs.In addition, from Fig. 3, it is clear thatnegrows faster at the chamber center than that at the edge after the power is turned on. The sharper increase ofneat the chamber center may be caused by two main elements: one is the enhanced ionization at the plasma center;[26]the other one is the constraint of low energy electrons brought by the rebuilt electric fields arisen from plasma potential and ambipolar potential.[27,28]As a result,the radial distribution ofneevolves from a flat-form to a parabola-like profile. Moreover,the radial distribution ofneat the steady state(300µs)is similar to that in CW discharge,as shown in Fig.3.
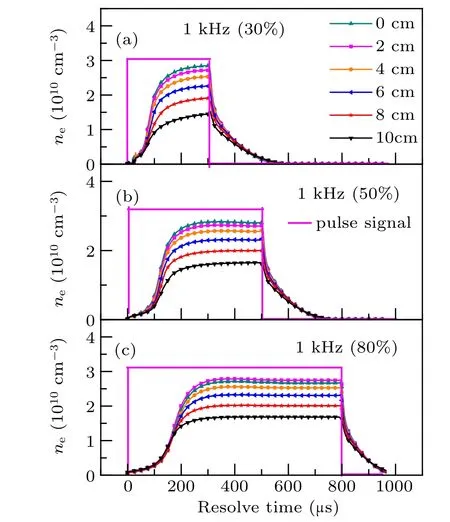
Fig.2. Temporal evolutions of ne at different radial positions under various duty cycles(a)30%,(b)50%,and(c)80%.
However, for the discussion of radial distribution ofneover the whole pulse period, the scheme used above is inapplicable. Therefore,a nonuniformity factorβis introduced to better analyze the temporal evolution of theneradial distribution.βis defined through Eq.(4),wherenmax,nmin,andnavgare the maximum,minimum,and mean values ofnein the radial direction at the same time point, respectively. Henceβimplies the fluctuation level ofnein the radial direction,i.e.,smallerβmeans the better radial uniformity ofne.

The temporal evolutions ofβwhich are calculated through the time-resolvednein Fig.2 are shown in Fig.4(a).Apparently, for each duty cycle,βgenerally exhibits a small value at the beginning of active-glow at duty cycles of 30%and 50%. This means that the radial distribution ofneis relatively uniform at the beginning of active-glow, such as 40 µs and 60µs in Fig.3. This is determined by the plasma distribution at the end of the last after-glow. When the RF power is turned off,high-energy electrons depleted rapidly via collisions with background gas or the grounded wall/substrate.[29,30]At the same time, the electron density decays rapidly after the RF power turned off (see Fig. 2). As a result, during the late after-glow period, the plasma sheath collapses and the ambipolar potential disappears. Eventually, the plasma becomes much more uniform in the radial direction due to diffusion processes.[31]By contrast,at the duty cycle of 80%,βexhibits a large value at the first several microseconds after the poser is turned on (see blue triangles in Fig. 4(a)). Then the factorβdecreases to 15%at 50µs,then it decreases slowly to a low value until 160µs during the beginning phase.This means that the electron density decreases faster at the chamber center and then it has a similar growth rate at all radial positions. Maybe the discharge maintains as the capacitive coupled discharge until 160 µs and the capacitive electric field pushes the electrons toward the grounded substrate and chamber wall. When the plasma turns into the inductively coupled discharge, the electron density increases rapidly at the chamber center andβincreases as well.
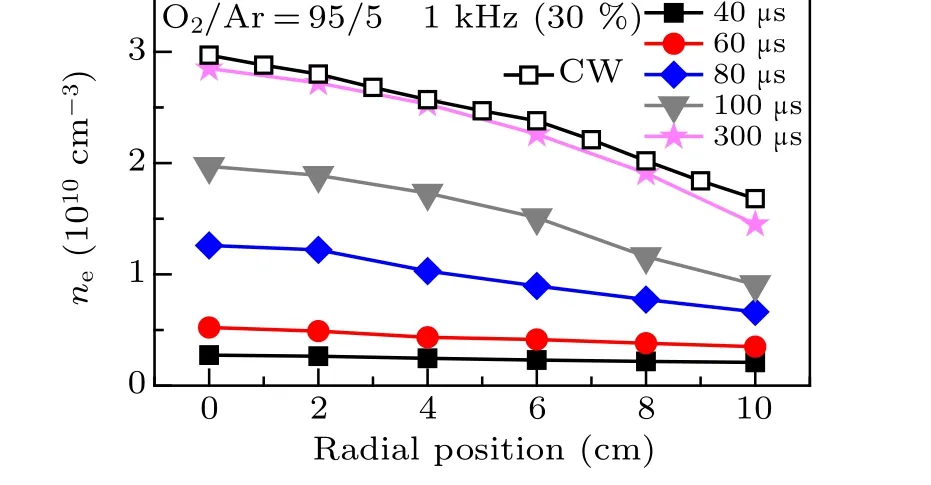
Fig. 3. Radial distribution of ne at different times with the duty cycle of 30%(solid symbol)and the radial distribution of ne in CW discharge(open symbol)under the same discharge conditions.
In order to make out the inherent mechanisms, the timeresolvedβis compared with the first derivations ofne(represent the electron growth rate) at different radial positions,shown in Fig. 4(b). It is clear to find that when the power is turned on, the growth rate ofnedecreases first and then increases to a maximum, after that, it decreases gradually to zero. What is the interesting is that the maximum ofβin active-glow occurs at the time where the peak of the growth rate ofneappeared(t=120µs), as shown in Fig.4(b). This time means that the plasma has been ignited after the power is turned on. The time interval from the pulse beginning(t=0 µs) to this time (the peak of the growth rate ofne) is regarded as “ignition delay” in the following text. When the radial position moves from the discharge center (r=0 cm)to the edge (r=10 cm), the maximum growth rate ofnedecreases monotonously. This confirms that the ionization rate is strongly enhanced at the chamber center during the initial active-glow stage.[26]Moreover, when the duty cycle is changed from 30%,50%,to 80%,the ignition delay increases from 75µs,120µs to 175µs,shown in Figs.4(a)and 5. That means the plasma ignition occurs later with the longer activeglow(for a fixed pulse frequency),and this has been confirmed by Liuet al. in a tandem ICP chamber.[32]
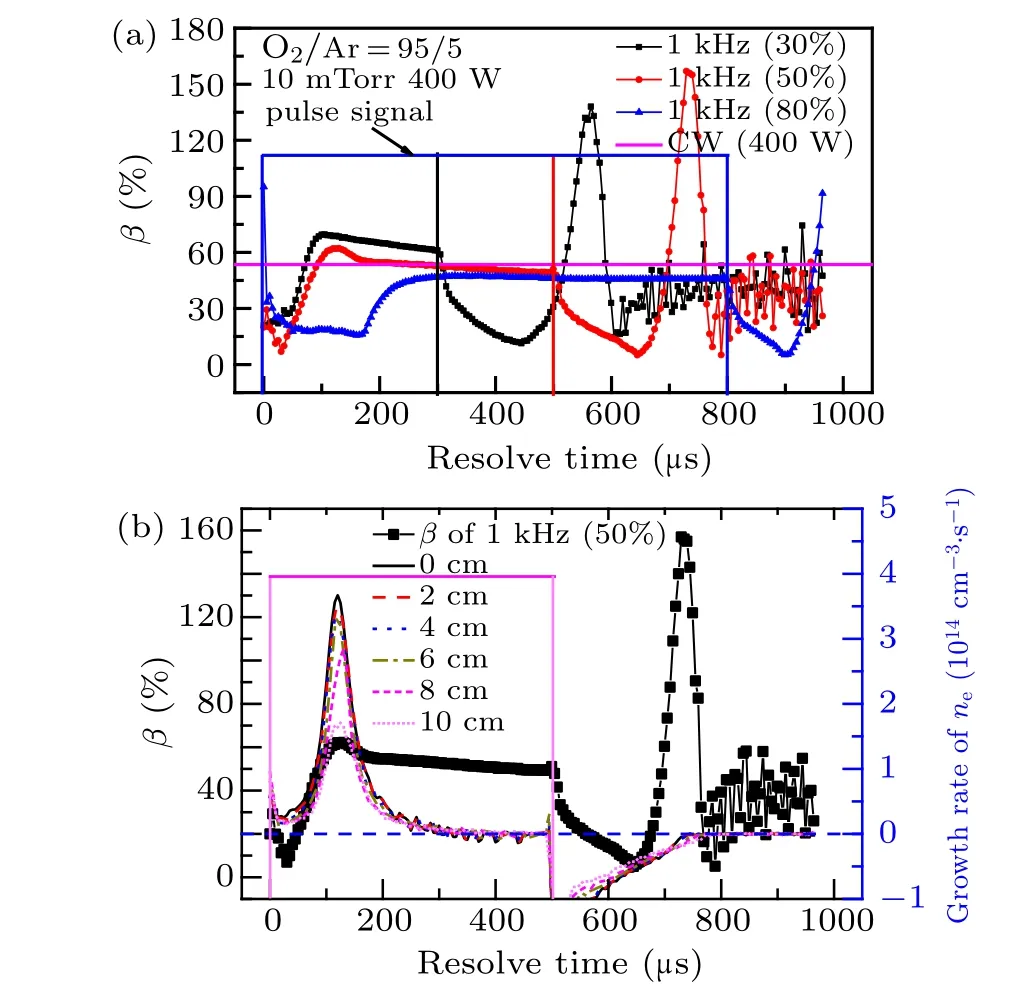
Fig. 4. (a) Temporal variations of nonuniformity factor (β) in pulsed discharge with the pulse frequency of 1 kHz and the duty cycles of 30%,50%,and 80%;(b)comparison between β and growth rates of ne at the duty cycle of 50%.

Fig.5. Growth rates of ne at different radial positions with the duty cycle of 30%,50%,and 80%.
Since the plasma is ignited through the energetic electrons,the ignition delay might be corresponding to the change of the mean electron energy of the electrons at the beginning of active-glow. As is well known, when the RF power is turned on, RF power coupling to the “seed” electrons to ignite the plasma.[33]The mean electron energy(〈ε〉on)at the beginning of active-glow can be estimated as〈εon〉=P/(Vne). Here,Vis the volume of the discharge chamber,neis the electron density when the RF power is turned on,Pis the whole power deposited into plasma during the active-glow period, which can be calculated by the input power and the power coupling efficiency. Since the power coupling efficiency mainly depends on the discharge pressure and the input power,the coupling efficiency can be set as a constant at different duty cycles(they have the same discharge pressure and input power). As a result,〈ε〉ondecreases with the increasing duty cycle,as shown in Fig. 6(a). This is because the rising duty cycle causes a shorter after-glow duration,i.e.shorter loss time for electrons.As a result,the electron density at the beginning of the activeglow is higher at a larger duty cycle,leading to a lower〈ε〉on.On the other hand,the electron density almost keeps constant at the beginning of the active-glow period under different coupled powers,as shown in Fig.7(b). Therefore,〈ε〉onincreases with the coupled power(Fig.6(a)). From Fig.6(b),it is clear that the ignition delay decreases with the increasing the〈ε〉on,i.e.,the higher coupled power and smaller duty cycle can cause earlier plasma ignition after the power is turned on.
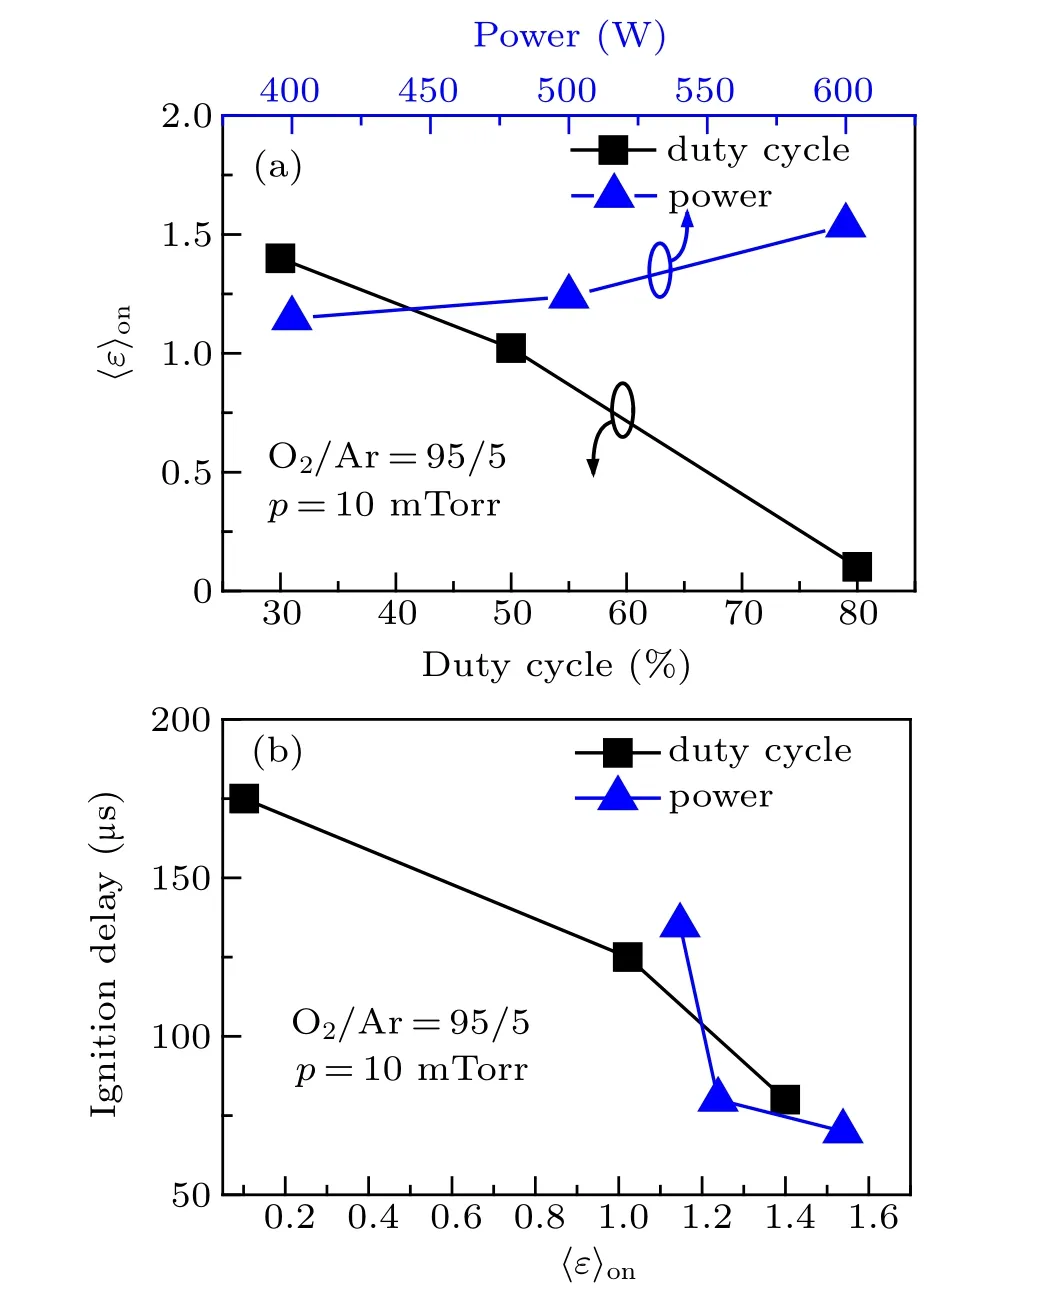
Fig.6. (a)Mean electron energy〈ε〉on as a function of the duty cycles and the coupled power;(b)plasma ignition delay varies with the mean electron energy〈ε〉on.
In addition, the emission intensity of Ar 750.4 nm can also prove the relationship between the〈ε〉onand the ignition delay at the beginning of the active-glow. This is because the emission line of Ar 750.4 nm (black line in Fig. 7(a)) represents the concentration of energetic electrons with the energy higher than 13.48 eV(the excitation threshold of Ar(2P1)).[34]Here, the concentration of energetic (>13.48 eV) electrons(blue square in Fig. 7(a)) is calculated through the EEDFs at
400 W.It is clear that at the emission intensity ofλ=750.4 nm(I750.4nm) and the concentration of energetic electrons (ne>13.48 eV)increases ahead of the electron density(red triangle in Fig.7(a))since the power is turned on. This can be the evidence of that the plasma is ignited by the energetic electron ionization. Furthermore, the higher RF power will result in a higher〈ε〉onfor a constant electron density at the beginning of the active-glow period, leading to earlier plasma ignition, as shown in Fig.7(b).
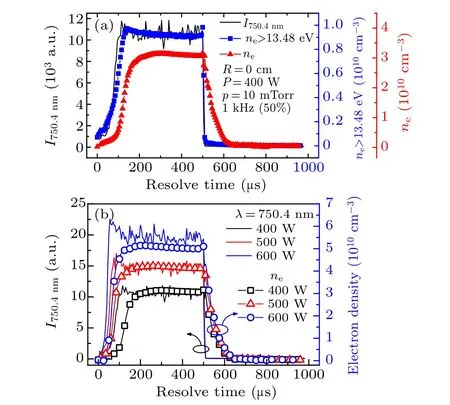
Fig. 7. (a) Temporal evolutions of emission intensity of Ar 750.4 nm(I750.4 nm),the concentration of high energy electrons(ne >13.48 eV),and electron density(ne)under the discharge power of 400 W and the gas pressure of 10 mTorr; (b) temporal evolutions of ne under various discharge powers at the chamber center (r=0 cm) and the emission intensity of Ar 750.4 nm(I750.4nm).
3.2. After-glow period
In the after-glow period,the temporal evolution ofβexhibits tremendous differences with that in the initial activeglow phase, as shown in Fig.8(a). In detail, when the power is turned off,βdecreases gradually to a minimum at first,and then it shows a sharp peak at the duty cycles of 30%and 50%.Eventually,βdecreases to the noise due to the relatively smallneduring the late after-glow period(growth rate ofnebecomes zero at the same time,see Fig.5). However,βdoes not reach its maximum (form a peak) at the duty cycle of 80%. From Figs. 2(b), 2(c), and 5, the plasmas arrive at the steady state before 500 µs. This means the characteristics of the plasma are similar at the end of the active-glow at the duty cycle of
80% and 50%. Thus the factorβwill need a similar time(about 250 µs after the power is turned off) to achieve the peak value. The shorter after-glow period for the duty cycle of 80%(200µs)is not long enough for the factorβto get its maximum.

Fig. 8. (a) Temporal evolutions of β at different duty cycles in after-glow period (0 µs indicates the time when the power is turned off); the “hollow distribution”indicates the period of the hollow profile of the ne in the radial distribution;(b)the radial distributions of ne at different resolve times with the pulse frequency of 1 kHz and duty cycle of 50%.
To easily describe this phenomenon, the beginning of after-glow is regarded as 0µs(i.e., when the power is turned off). In order to find the origin of the peak formation ofβ,the radial distributions ofneat different times in the after-glow period are plotted in Fig.8(b)at the duty cycle of 50%. Obviously, the radial distribution ofneevolves from the parabolalike at 0µs to flat at 150µs. However, as time advances, the radial profile ofneconverts gradually to a hollow distribution at 225µs. This might be caused by two elements: One is the decrease of energetic electrons after the power is turned off.As shown in Fig.9(a), the energetic electrons are depleted in a few tens of microseconds both atr=0 cm andr=10 cm in the after-glow period, which will lead to a uniform radial distribution of the electron density and the collapse of the plasma sheath. This is because of the ionization thresholds of O2molecules, O atoms, and Ar (12.06 eV, 13.61 eV, and 15.76 eV, respectively) in O2/Ar plasmas,[25,35,36]are higher than most electrons’energy. Thus the generation channels for electrons (mainly via ionization processes) disappear rapidly after the power is turned off. Another reason for the rapid loss of electrons at the center can be explained as that the electrons are mainly consumed via recombination and attachment processes. Furthermore,due to the larger electron density gradient at the early stage of the after-glow period, the electron diffusion in the radial direction is much stronger at the early stage of the afterglow period.This maybe can make some contributions to the decrease ofneat the chamber center as well.As a result,the uniform radial distribution of the electron density occurs.
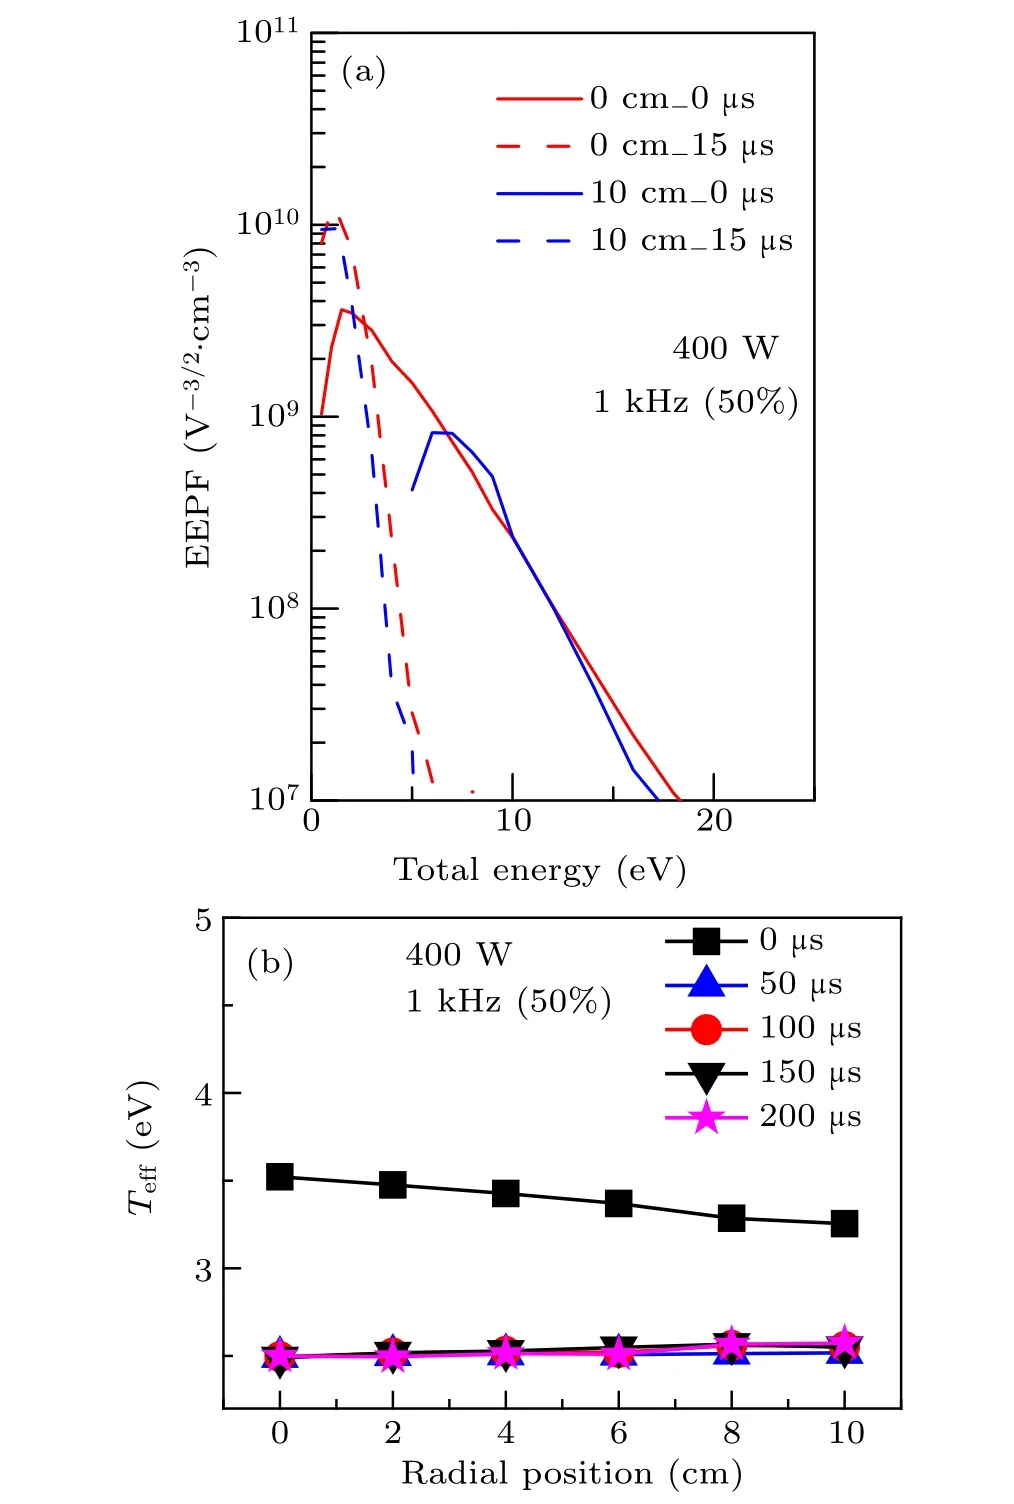
Fig.9. (a)EEPFs and(b)radial distributions of Teff in the after-glow with a pulse frequency of 1 kHz and duty cycle of 50%.
On the other hand,the energetic electron depletion in the early after-glow period leads to a uniformTeffin the radial direction,i.e.,Teffalmost keeps constant after a few tens of microseconds (see Fig. 9(b)). Since the diffusion coefficient of the electrons is determined by the electron temperature,the diffusion coefficient evolution is similar toTeffin the radial direction. Thus, the effect of the density gradient becomes unimportant for the electron radial distribution after 200 µs.This means that the formation ofnehollow distribution will be caused by another reason. In O2/Ar plasmas,negative oxygen ion (O−) contributes the majority of the negatively charged ions in low pressure discharges.[25,37]In pulsed O2/Ar plasmas,the density of O−increases at the early phase of the afterglow period.[22]Due to its low diffusion coefficient, O−will be confined at the discharge center both in the active-glow and after-glow periods. This confinement can last even to the late after-glow.[38]By means of photo-detachment technology and a Langmuir probe,Wagneret al. found that the density of the negative ions forms a peak at about 150µs after the power is turned off.This is because O−mainly generated from the reaction e+OM2→O−+O,where OM2=O2(A3Σ+u+C3∆u,c1Σ−u),and the cross section of this reaction increases with decreasing electron temperatures.[38]Besides,the formation of O−via the electron dissociative attachments with the ground state of O2(with a threshold of 4.7 eV)and the O2(a1∆g)(with a threshold of 3.72 eV)can be excluded in the after-glow.[22]As a consequence,the electrons at the chamber center will be consumed via the dissociative attachment e+OM2→O−+O, producing O−at the same time. This process might result in the decrease ofneat the discharge center at the initial after-glow period.As time goes on,the concentration of O−will decrease via the loss channels(O−+O→e+O+O,O−+O2(a1∆g)→O3+e).Eventually,the plasma becomes steady,and all particles have a uniform radial distribution at the end of a long after-glow period. This can be proved by the change of the radial distribution ofnefrom 225µs to 250µs in Fig.8(b). Moreover,the maximum value ofβat the duty cycle of 50% is higher than that of 30%in the after-glow period,seen in Fig.8(a). This is maybe the higher value ofβat the beginning of the after-glow at the duty cycle of 30%than that of 50%,which indicates that fewer electrons are confined at the chamber center at the duty cycle of 50%. When the formation of O−(e+OM2→O−+O)dominates the electron consumption in the late after-glow,the electron density decreases faster at the chamber center. This will enhance the hollow distribution ofneat the radial direction and forms a higher peak value ofβat the duty cycle of 50%.
4. Conclusions
Time-resolved radial uniformity of plasma has been investigated by means of a Langmuir probe in pulsed inductively coupled O2/Ar plasmas. During the active-glow, the radial distribution ofnehas a uniform distribution at the beginning phase. Lately, it forms a parabola-like radial distribution until the power turned-off(after-glow). This is because that the plasma has been ignited by the energetic electrons and causes the strong ionization at the chamber center. As a result, the plasma radial uniformity becomes worse after the plasma has been ignited. Moreover,the plasma“ignition delay”(the time interval between the pulse beginning and the maximum ofβand the growth rate ofnein active-glow) is retarded with the duty cycle. This can be attributed to the decrease of the mean electron energy(〈ε〉on)at the beginning of the active-glow period.With various duty cycles and input powers,we found that the plasma will be ignited earlier with a higher〈ε〉on. This phenomenon can be proved by the temporal evolution of the emission intensity of the Ar 750.4 nm (I750nm). During the after-glow period,βfirst decreases to a minimum, and then it rises again to form a peak. This means that the radial distribution ofnegradually evolves from the parabola-like to the flat profile, and then it gradually turns into the hollow distribution. The formation of negative oxygen ions(O−),which is produced by the dissociative attachment(e+OM2→O−+O)at the chamber center,might be responsible for the hollow distribution ofnein the radial direction.
- Chinese Physics B的其它文章
- Coarse-grained simulations on interactions between spectrins and phase-separated lipid bilayers∗
- Constraints on the kinetic energy of type-Ic supernova explosion from young PSR J1906+0746 in a double neutron star candidate∗
- Computational model investigating the effect of magnetic field on neural–astrocyte microcircuit∗
- Gas sensor using gold doped copper oxide nanostructured thin films as modified cladding fiber
- Exact explicit solitary wave and periodic wave solutions and their dynamical behaviors for the Schamel–Korteweg–de Vries equation∗
- Suppression of ferroresonance using passive memristor emulator

