Affi nities of freshwater “Chantransia” stage algae(Rhodophyta) from China based on molecular and morphological analyses*
Jinfen HAN, Fangru NAN, Jia FENG, Junping LÜ, Qi LIU, Xudong LIU, Shulian XIE
School of Life Science, Shanxi Key Laboratory for Research and Development of Regional Plants, Shanxi University, Taiyuan 030006, China
Abstract Twelve putative “Chantransia” isolates were collected from six locations across Hubei, Shanxi,Guizhou, and Henan Provinces in China. Their morphological characters were evaluated via the Ward’s method of hierarchical cluster analysis in SPSS software to classify phylogenetic relationships among the isolates. The morphological data revealed that isolate HN31 (called group “MALL”) was distinct from the other specimens being macroscopic with large vegetative cells and monosporangia (>20 μm in diameter).The 11 other isolates were grouped into three clusters, corresponding to the species Audouinella tenella, A.hermannii, and A. pygmaea. The morphological “Chantransia” stage of the species, reportedly belonging to the orders Batrachospermales, Thoreales, and the phylogenetically distant genus Audouinella, are very similar, resulting in the diffi culty to distinguish them based just on morphology. Therefore, molecular analysis of rbc L, UPA, and COI-5P was conducted to infer the phylogenetic position of all isolates in this study. All “ A. tenella” and “ A. hermannii” sequences belong to order Batrachospermales, while the isolate HN31 was the “Chantransia” of Thorea hispida. The six other specimens varied morphologically, but they were within the circumscription of “ A. pygmaea”. All three molecular markers show that all “ pygmaea”isolates also represent the “Chantransia” of T. hispida. Furthermore, results from this investigation proposed a new species— Sheathia qinyuanensis, corresponding to the isolates QY1 and QY2.
Keyword: Batrachospermales; COI-5P; rbc L; Thoreales; UPA
1 INTRODUCTION
The freshwater red algal orders Batrachospermales and Thoreales belong to Florideophyceae(Rhodophyta). Freshwater red algal orders Batrachospermales and Thoreales reportedly have triphasic life history, including a macroscopic gametophyte, carposporophytes that develop on the gametophyte thallus, and a “Chantransia” asexual reproduction stage (Sheath, 1984). The morphological characteristics of their “Chantransia” stages are small tufts from a macro perspective and branched filaments under a microscope. However, its simplicity makes this phase a hindrance to species identification. On the one hand, trueAudouinellaand the “Chantransia”stages of orders Batrachospermales and Thoreales cannot be distinguished due to similar morphological features. Therefore, to solve this problem, researchers proposed that bluish-coloredAudouinella-like species manifest the “Chantransia” stage, whereas the reddish-colored species are the trueAudouinellaspecies (Skuja, 1934; Necchi et al., 1993a, b). That being said, other studies have confirmed that extrinsic factors cause color changes (Kaczmarczyk and Sheath, 1992). On the other hand, no correlation exists between certain species of orders Batrachospermales and Thoreales and their morphological “Chantransia” stage characteristics.Some researchers have found that “pygmaea”morphology probably represents the “Chantransia”stage of numerous species, and theBatrachospermumantipodites(currently regarded as a synonym ofNocturamaantipodites(Entwisle) Entwisle &M.L.Vis in Entwisle et al. 2016: 388, 389) has been associated with two “Chantransia” morphologies(Zucchi and Necchi, 2003; Vis et al., 2006; Necchi and Oliveira, 2011).
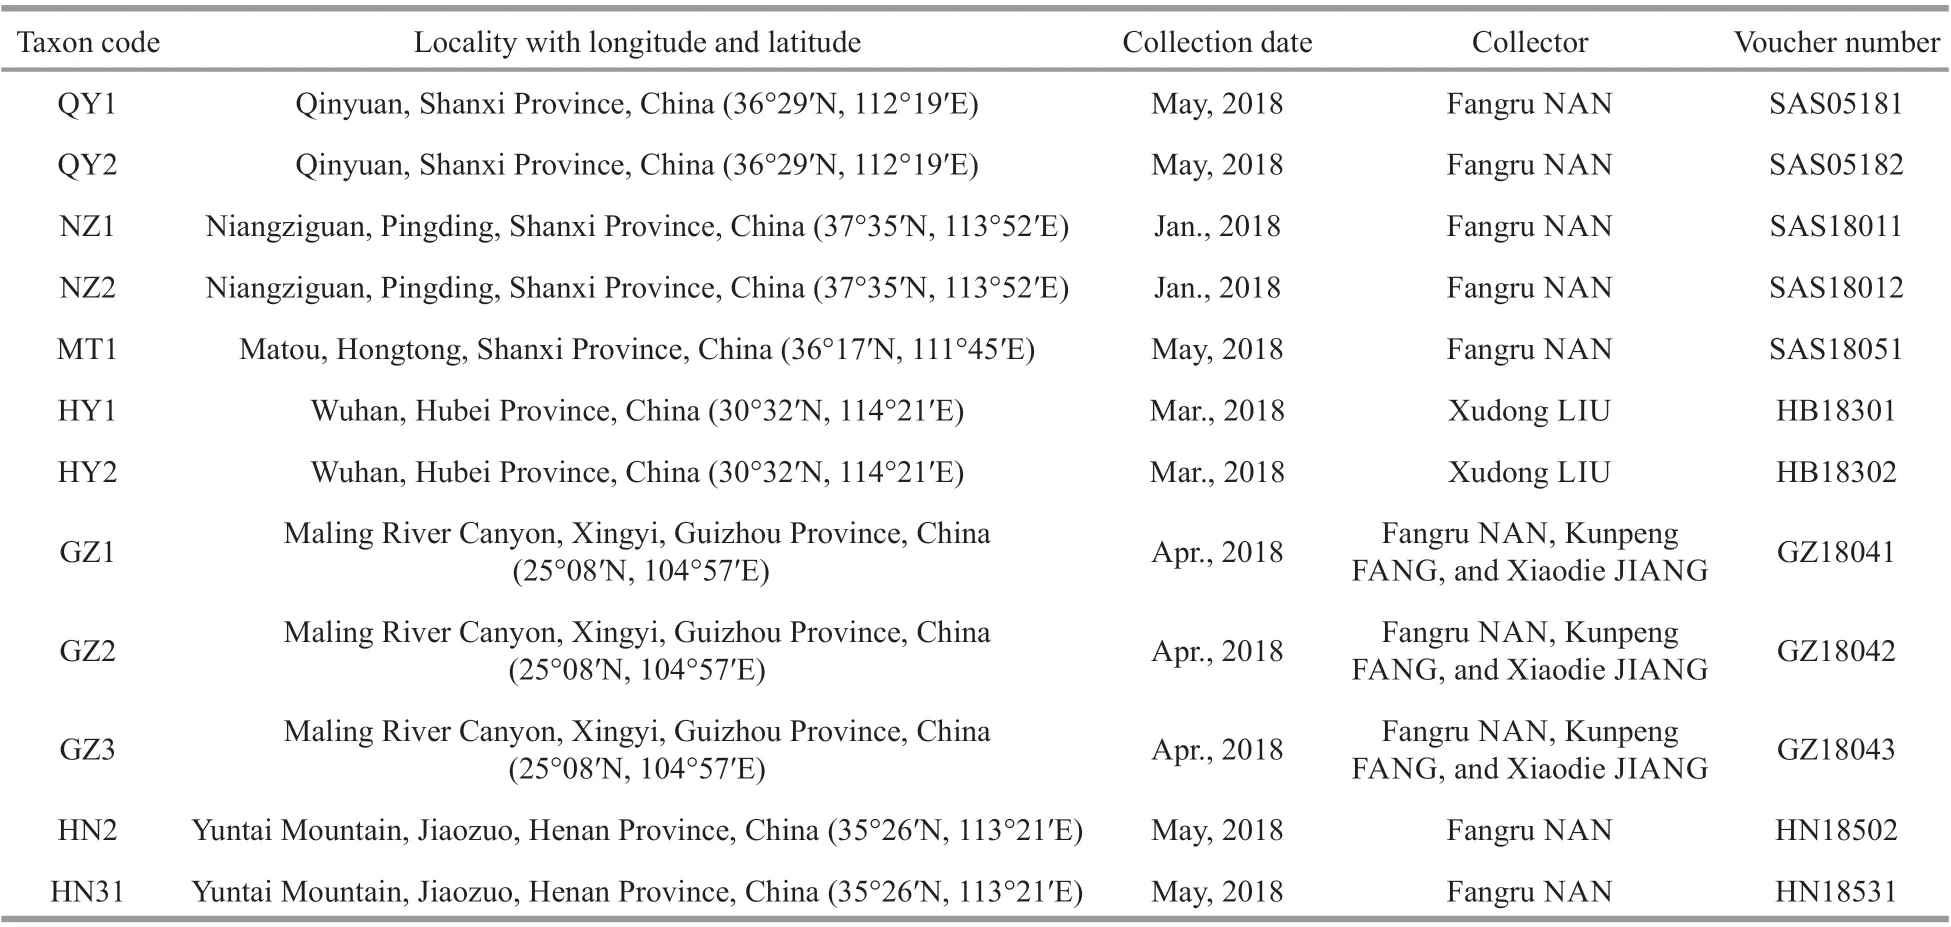
Table 1 Sample information for taxa analyzed in this study
Phylogenetic tree reconstructions are traditionally applied as representations of the phylogenetic relationships among species. Currently, the phylogenetic trees were established based on sequences with appropriate evolutionary rates.Studies of molecular sequences of the organellar genes, such as the plastidrbcL, the plastid 23S rRNA gene (UPA), and the mitochondrial COI-5P have made significant contributions to elucidate the relationships within Rhodophyta (e.g., Li et al., 2010;Hind and Saunders, 2013; Nan et al., 2014). TherbcL gene has been analyzed to determine the affi nities of fourteen putative “Chantransia” isolates collected from locations in French Guiana, Brazil,and Bolivia from South America, and Mississippi,USA in North America (Chiasson et al., 2005).Phylogenetic analysis showed that “macrospora”isolates were the “Chantransia” ofB.macrosporum(currently regarded as a synonym ofMontagniamacrospora(Montagne) Necchi, M. L. Vis & A. S.Garcia in Necchi et al. 2019: 587, Figs.3–14), while the “pygmaea” morphology more likely represents numerous species (Chiasson et al., 2005). In addition,other studies also indicated thatA.pygmaeaspecimens (Kützing, Weber Bosse 1921: 191) were related most closely toB.arcuatum(currently regarded toSheathiaarcuata(Kylin) Salomaki &M.L.Vis in Salomaki et al. 2014: 535) andNemalionopsistortuosa(Yoneda & Yagi in Yagi &Yoneda 1940: 85, Figs.1, 2: 1–8) as based onrbcL sequences (Chiasson et al., 2007). Furthermore, Nan et al. (2016) reported that fourAudouinella-like species from China could be classified asThoreahispida((Thore) Desvaux 1818: 16) as based on UPA and COI-5P. The purpose of this study was to use morphological and molecular data to determine the phylogenetic positions of the twelve “Chantransia”stage specimens from several regions of China.
2 MATERIAL AND METHOD
2.1 Sample collection
Twelve freshwater isolates, putatively recognized as “Chantransia”, were collected from locations ranging across the Hubei, Shanxi, Guizhou, and Henan Provinces in China. Figure 1 and Table 1 show collection information. Materials were collected using a knife and tweezers and were transferred immediately to the laboratory. Materials were rinsed several times in ultrapure water,removing impurities and epiphytic algae. Specimens for DNA extraction were desiccated in silica gel,whereas the morphological examination material was placed in centrifuge tubes and fixed with a 4%formalin solution.
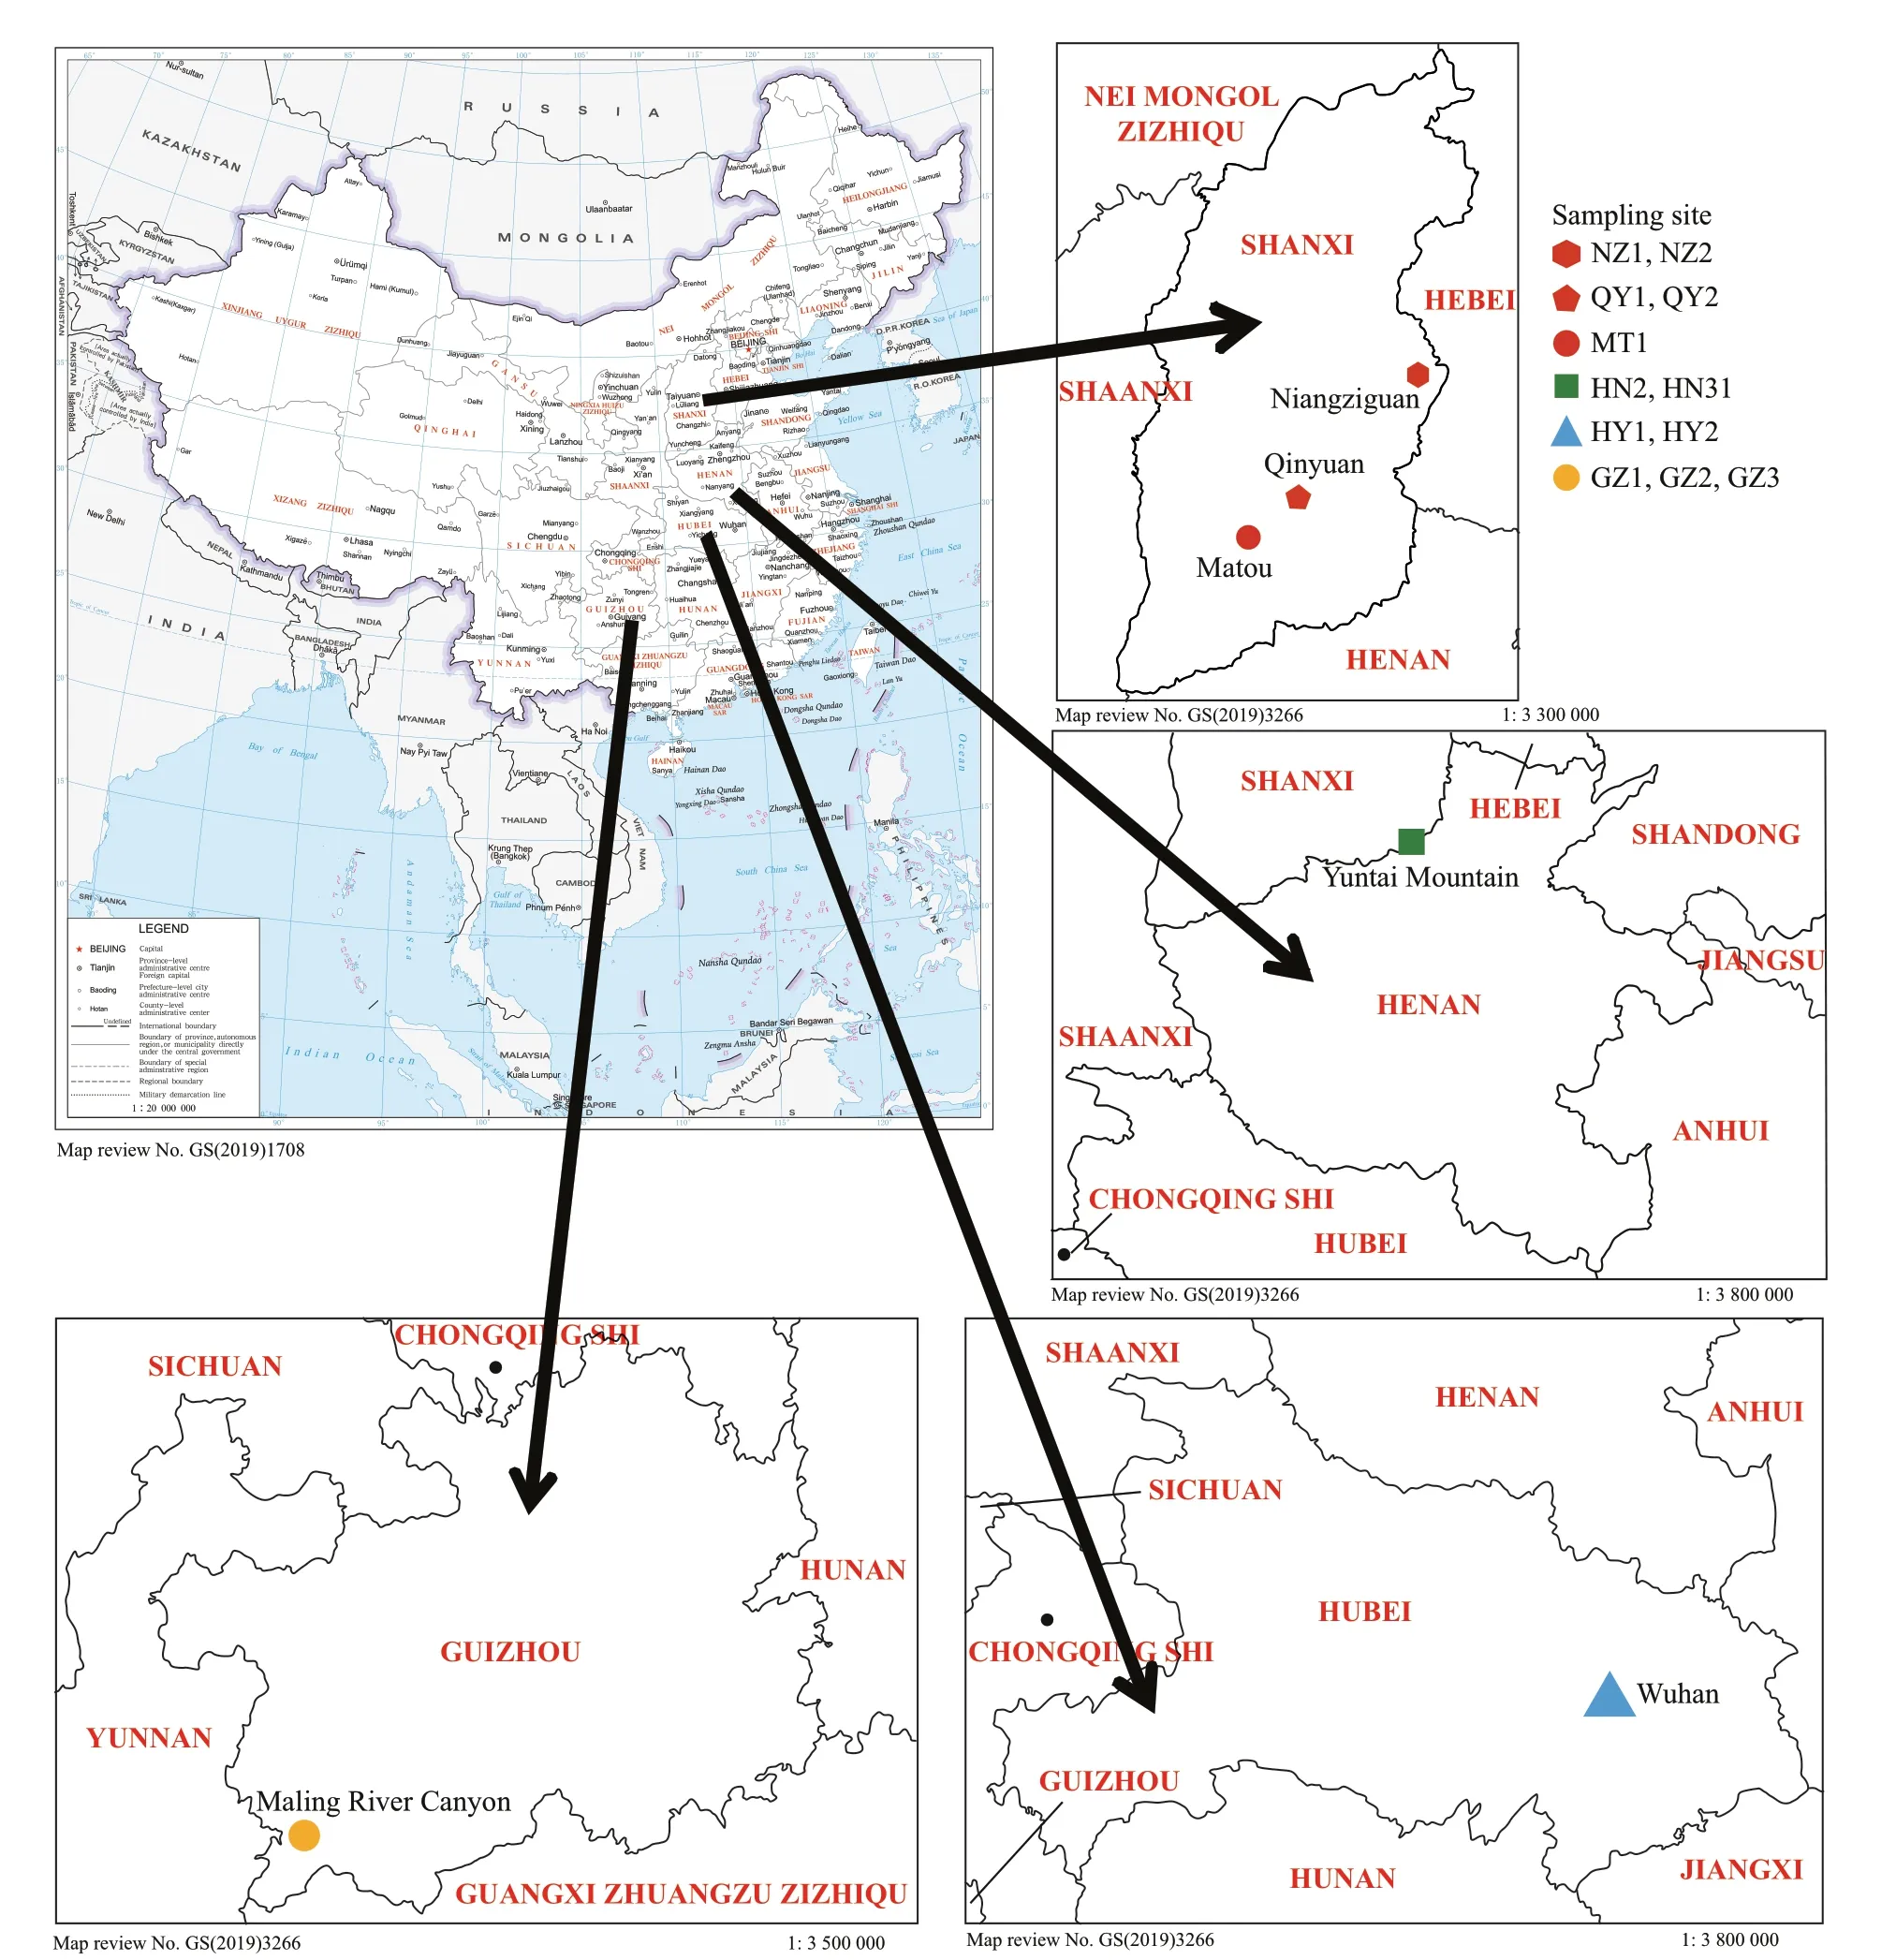
Fig.1 Map of China (map review No. GS (2019)1708) showing the collection sites of “Chantransia” stage samples investigated in this study
2.2 Morphological observation and data analysis
For morphology observations, both fresh and formalin preserved thalli were examined under a BX-51 Olympus microscope equipped with a chargecoupled device (DP72; Olympus, Tokyo, Japan) for taking photographs.
The morphological characteristics of all specimens utilized in this study and three specimens of the genusAudouinella(Table 2) were evaluated using Ward’s method of Hierarchical cluster analysis in SPSS 19.0 package (George and Mallery, 2010). The diff erences among the groups were analyzed by one-way ANOVA via SPSS 19.0 package.P<0.05 was considered for statistical significance.
2.3 Objective sequence amplification
Total DNA was extracted following the protocol originally described by Saunders (1993) and revisedby Vis and Sheath (1997). Polymerase chain reaction amplification reaction volume was 20 μL, consisting of 10.8-μL ddH2O, 2.0-μL 10×buff er, 2.0-μL 2.5-mmol/L dNTPs, 0.2-μL Taq DNA polymerase (all from Sangon Biotech Co., Ltd., China), 2.0 μL of each primer (10 mmol/L), and 1.0 μL of genomic DNA. The reaction was executed in a MyCycler thermal cycler (Bio-Rad, USA).rbcL gene was amplified using the primer pair F160(5′-CCTCAACCAGGAGTAGAT-3′) andrbcLR(5′-ACATTTGCTGTTGGAGTCTC-3′) (Vis et al.,1998). Also, another pair of primers, F650(5′-ATTAACTCTCAACCATTTATGCG-3′) andrbcLR (Salomaki et al., 2014) were the substitutive primers so long as the first pair did not produce a PCR product. ForrbcL, the PCR procedure consisted of an initial denaturation at 95 °C for 2 min, 35 cycles of denaturation at 93 °C for 1 min, annealing at 47 °C for 1 min, extension at 72 °C for 2 min, and a final extension of 2 min at 72 °C. The primer p23SrV_f1(5′-GGACAGAAAGACCCTATGAA-3′) and p23SrV_r1 (5′-TCAGCCTGTTATCCCTAGAG-3′)(Sherwood and Presting, 2007) were utilized to amplify UPA sequences. PCR cycling conditions for UPA were as follows: 2 min initial denaturation at 94 °C, 35 cycles at 94 °C for 20 s, 55 °C for 30 s,72 °C for 30 s, and a final extension at 72 °C for 10 min. The primers GazF1 (5′-TCAACAAATCATAAAGATATTGG-3′) and GazR1 (5′-ACTTCTGGATGTCCAAAAAAYCA-3′) (Saunders, 2005) were utilized to amplify COI-5P. For COI-5P, thermal cycling conditions included an initial denaturation step at 94 °C for 4 min, 35 cycles at 94 °C for 1 min,45 °C for 30 s, 72 °C for 1 min, and a final extension at 72 °C for 7 min.

Table 2 Morphological characteristics of specimens in this study and three specimens of genus Audouinella
2.4 Sequence determination and data analysis
PCR products, along with their amplification primers, were sent to the BGI Tech Corporation(Beijing, China) for sequencing on an ABI 3730XL sequencer. Sequences generated in this study were deposited in GenBank (Table 3). The other Batrachospermales, Thoreales, andAudouinellataxa sequences utilized in this study for analysis were downloaded from GenBank (http://www.ncbi.nlm.nih.gov/) (listed in Supplementary Table S1), and two genera,CompsopogonandBangia, were incorporated as outgroup taxa. DNA sequence data produced by thisstudy were aligned with sequences obtained from GenBank using Clustal-X 2.0 (Thompson et al., 1997)and MEGA 5.0 (Tamura et al., 2011). Untrimmed bases on both ends were deleted to produce identical length alignment. Furthermore, MEGA 5.0 was utilized to calculate the pairwise sequence distances. Phylogenetic trees were constructed based on the aligned sequences.Appropriate models of sequence evolution and related parameters of therbcL, UPA, and COI-5P gene sequences datasets were generated by adopting Modeltest 3.7 (Posada and Buckley, 2004) with the results listed in Table 4. MEGA 5.0 was utilized to establish Neighbor-joining (NJ) trees with 1 000 bootstrap replications. PHYML software (Felsenstein,1981; Guindon and Gascuel, 2003) was utilized toconstruct the Maximum Likelihood (ML) trees with 1 000 replicates of bootstrap analysis. Meanwhile,Bayesian Inferences (BI) was developed in MrBayes version 3.1.2 (Ronquist and Huelsenbeck, 2003). The Markov chain Monte Carlo (MCMC) algorithm was utilized to establish 4 Markov chains. Three hot chains,1 cold chain, and 5 million generations sampling every 1 000 generations were employed. The burn-in for each run, determined by plotting the overall likelihood scores against the generation, was set as 25 °C of the total tree by default. Resulting phylogenetic trees were edited using Figtree1.3.1 (http://tree.bio.ed.ac.uk/software/figtree/).
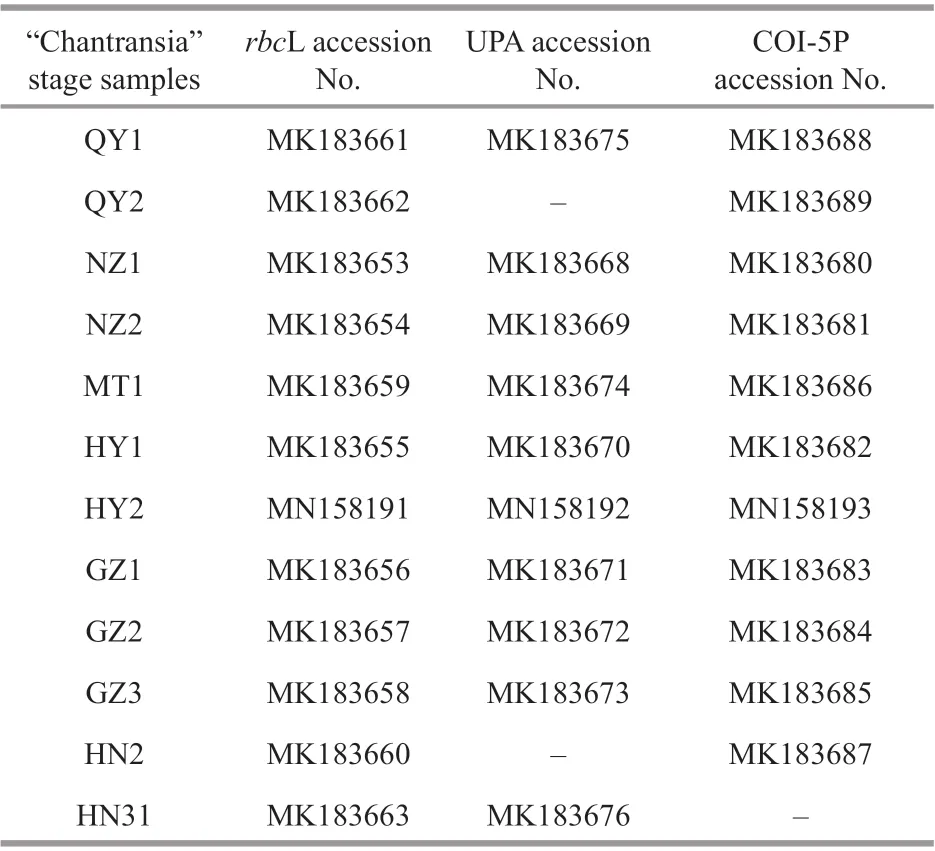
Table 3 GenBank accession numbers for rbc L, UPA, and COI-5P sequences of “Chantransia” stage samples sequenced in this study
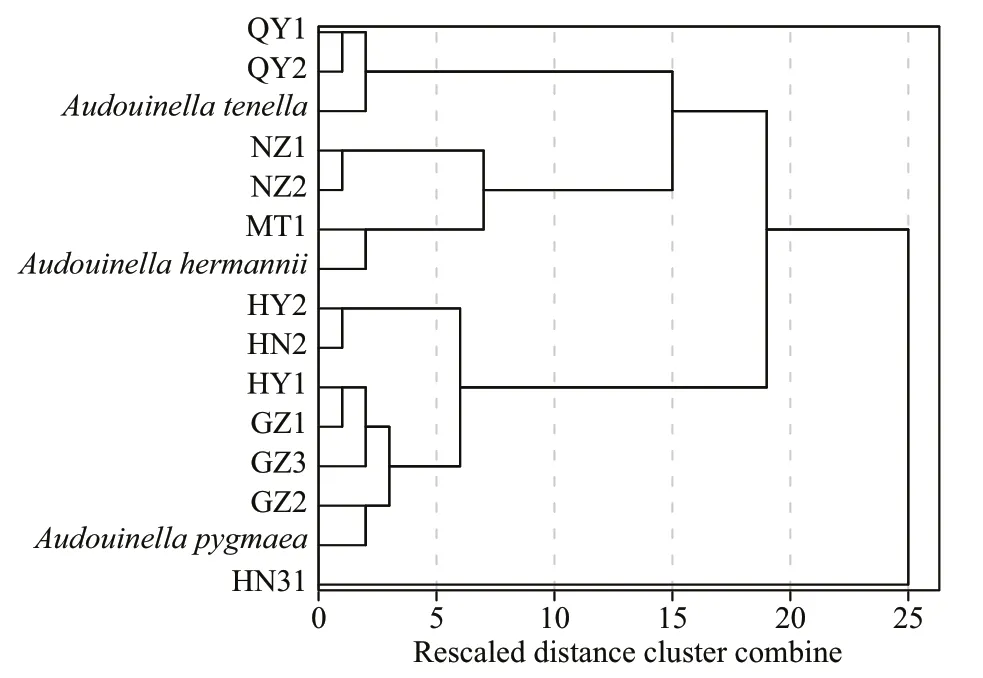
Fig.2 The cluster relationship of 12 putative “Chantransia”isolates and three specimens of freshwater Audouinella showing four groupings
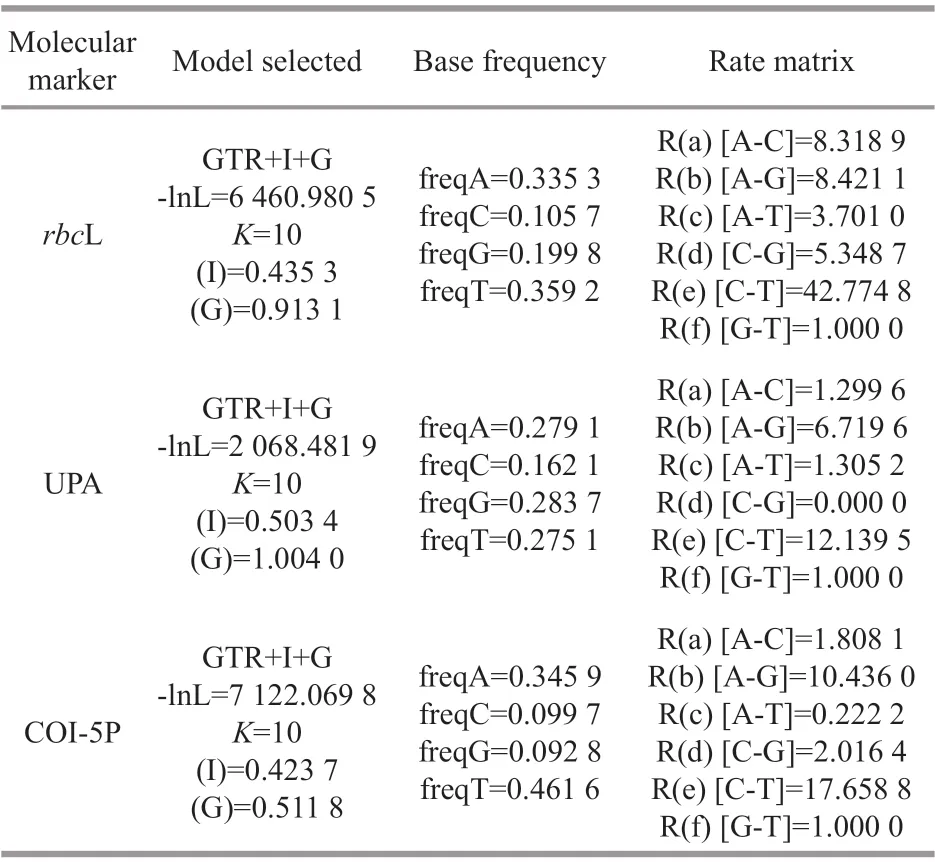
Table 4 Substitution models obtained for each gene sequence using Modeltest 3.7 analysis
3 RESULT
3.1 Morphological observations
Morphometric data showed a wide range in all characteristics among isolates. Hierarchical cluster analysis grouped these specimens and three species of genusAudouinellainto four clusters (Fig.2).
The first group (namedtenella) included two isolates (QY1 and QY2) in this study, as well as a species of genusAudouinella(A.tenella(Skuja)Papenfuss 1945: 326). Specimens of this group are distinguished as macroscopic (13.2–15.8 mm), having small vegetative cells ((7.3–16.4) μm×(3.6–7.3) μm),and monosporangia ((4.4–6.7) μm in diameter) (Table 2; Fig.3a & b).
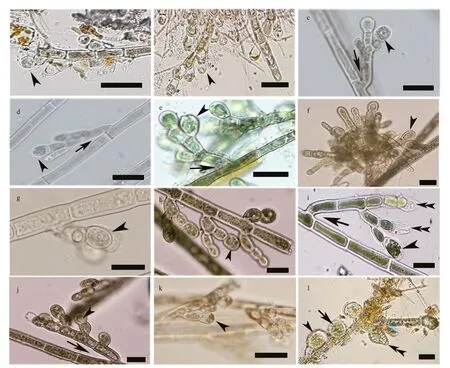
Fig.3 Morphological features of putative “Chantransia” isolates in this study
The second group (namedhermannii) consisted of three isolates (NZ1, NZ2, and MT1), as well as a species of genusAudouinella(A.hermannii(Roth)Duby 1830: 972). This group is characterized as macroscopic (9.1–26.7 mm), having large vegetative cells ((29.7–59.7) μm×(5.6–15.3) μm), and small monosporangia ((4.7–12.2) μm in diameter) (Table 2;Fig.3c–e).
The third large group (calledpygmaea) contained six isolates (HY1, HY2, GZ1, GZ2, GZ3, and HN2),as well as a species of genusAudouinella(A.pygmaea).It is separated from the other groups as microscopic(4.1–14.2 mm), having large vegetative cells ((16.7–64.4) μm×(7.3–15.6) μm), and small monosporangia((4.7–15.0) μm in diameter) (Table 2; Fig.3f–k).
The fourth group (called MALL) included one isolate (HN31) and noAudouinellataxa. It is distinct from other groups as macroscopic (10.0–13.6 mm),having large vegetative cells ((27.3–43.6) μm×(5.5–9.1) μm), and monosporangia ((21.8–23.6) μm in diameter) (Table 2; Fig.3l).
Isolate HN2 had the smallest mean tuft length(5.0 mm) and isolate NZ1 had the largest (20.0 mm),with their overall range being 13.3–26.7 mm. The mean tuft length significantly diff ered (P<0.05) from each group, and only the isolates belonging to groups“tenella” and “MALL” were similar. Isolates of group“hermannii” were significantly larger (P<0.05) than others regarding mean tuft length and vegetative cell length, but they did not diff er from at least some of the other isolates in vegetative cell diameter and monosporangia size. The mean vegetative cell diameter significantly diff ered (P<0.05) among the isolates belonging to groups “pygmaea”, “tenella”,and “MALL”. Isolates belonging to groups“hermannii” and “pygmaea” were quite consistent regarding monosporangia size, whereas isolates of group “tenella” were significantly smaller (P<0.05)than all other isolates regarding monosporangia length, and isolate HN31 was significantly larger(P<0.05) than the other isolates regarding monosporangia length and diameter (Table 2).
3.2 Molecular analysis
3.2.1 Analysis ofrbcL sequences
rbcL data matrix included 46 specimens of two orders Batrachospermales and Thoreales and 3 species of a phylogenetically distant genusAudouinella, as well as 2 outgroup taxa, consisting of 644 characters, of which 295 (45.81%) were variable and 272 (42.24%) were parsimony informative.Supplementary Table S2 lists the pairwise distance among “Chantransia” isolates and other specimens of orders Batrachospermales and Thoreales.
Table 2 lists the pairwise distance based onrbcL sequences between all 12 “Chantransia” isolates and other species of orders Batrachospermales and Thoreales. Results show that isolate MT1 was identical toVirescentiahelminthosa(Bory) Necchi,D. C. Agostinho & M. L. Vis 2018: 318. However, thep-distance between isolates QY1 and QY2 was 1%,corresponding to 8 single-bp diff erences. The pairwise distance between isolates collected from Qinyuan of Shanxi Province (QY1 and QY2) and the other species of genusSheathiashowed larger variance than among intraspecific distance of the genusSheathia(0.0582 vs 0.0565). Thep-distances among isolates NZ1, NZ2, and four species of genusSheathia(S.hongdongensis(S. L. Xie & J. Feng) J. -F. Han et al. 2018: 68,S.jinchengensisJ. -F. Han et al. 2018:65, Fig.1,S.longipedicellata(Hua & Shi) J. -F. Han et al. 2018: 68, andS.matouensisJ. -F. Han et al.2019: 258, Fig.2) were 0%–1%. Similarly, divergences between the remaining seven isolates used in this study andT.hispidaspecimens (including both the gametophyte and “Chantransia” stage) were 0%–1%.
Three phylogenetic methods (NJ, BI, and ML)produced trees with similar topological structures among “Chantransia” isolates and their sister specimens, except that the main branches were arranged diff erently. Therefore, only the BI tree with supporting values calculated from three methods was displayed (Fig.4).
rbcL tree was composed of three main branches representing orders Batrachospermales, Thoreales,and genusAudouinella. In the Batrachospermales branch, four putative “Chantransia” isolates clustered withSheathiataxa that had high support values(1.00/98.8/100). Isolates collected from Qinyuan of Shanxi Province (QY1 and QY2) clustered into an independent clade. However, they were separated from other species of genusSheathiawith moderate Bayesian posterior probabilities (PP) and NJ support values (0.82/66.6/80). Among theSheathiataxa, four speciesS.hongdongensis,S.jinchengensis,S.longipedicellata, andS.matouensisshowed the closest relationship with isolates NZ1 and NZ2, which was well-supported (1.00/99.7/100). Isolate MT1 was also in the Batrachospermales branch and clustered withV.helminthosathat had robust values(1.00/100/100). Within theThoreabranch, the seven other “Chantransia” isolates andT.hispidaclustered together with moderate to high support values(1.00/99.7/89). They were sister to a clade formed by a species ofT.okadae(Yamada 1949: 158, Figs.1–3(as ‘okadai’)) andT.indica(Necchi, E. K. Ganesan &J. A. West 2015: 268, Fig.2A–I). However, none of the 12 isolates clustered withAudouinellaalgae.
3.2.2 Analysis of UPA sequences
The UPA sequence determined for the 10 (except for isolates HN2 and QY2) “Chantransia” isolates utilized in this study were 310 bp, of which 115(37.10%) were variable and 99 (31.94%) were parsimony informative. Supplementary Table S3 lists the pairwise distance among “Chantransia” isolates and other specimens of orders Batrachospermales and Thoreales. For the UPA gene, three diff erent phylogenetic methods produced trees in similar topology. Therefore, only the BI tree was shown indicating supporting values calculated from the three methods in Fig.5.
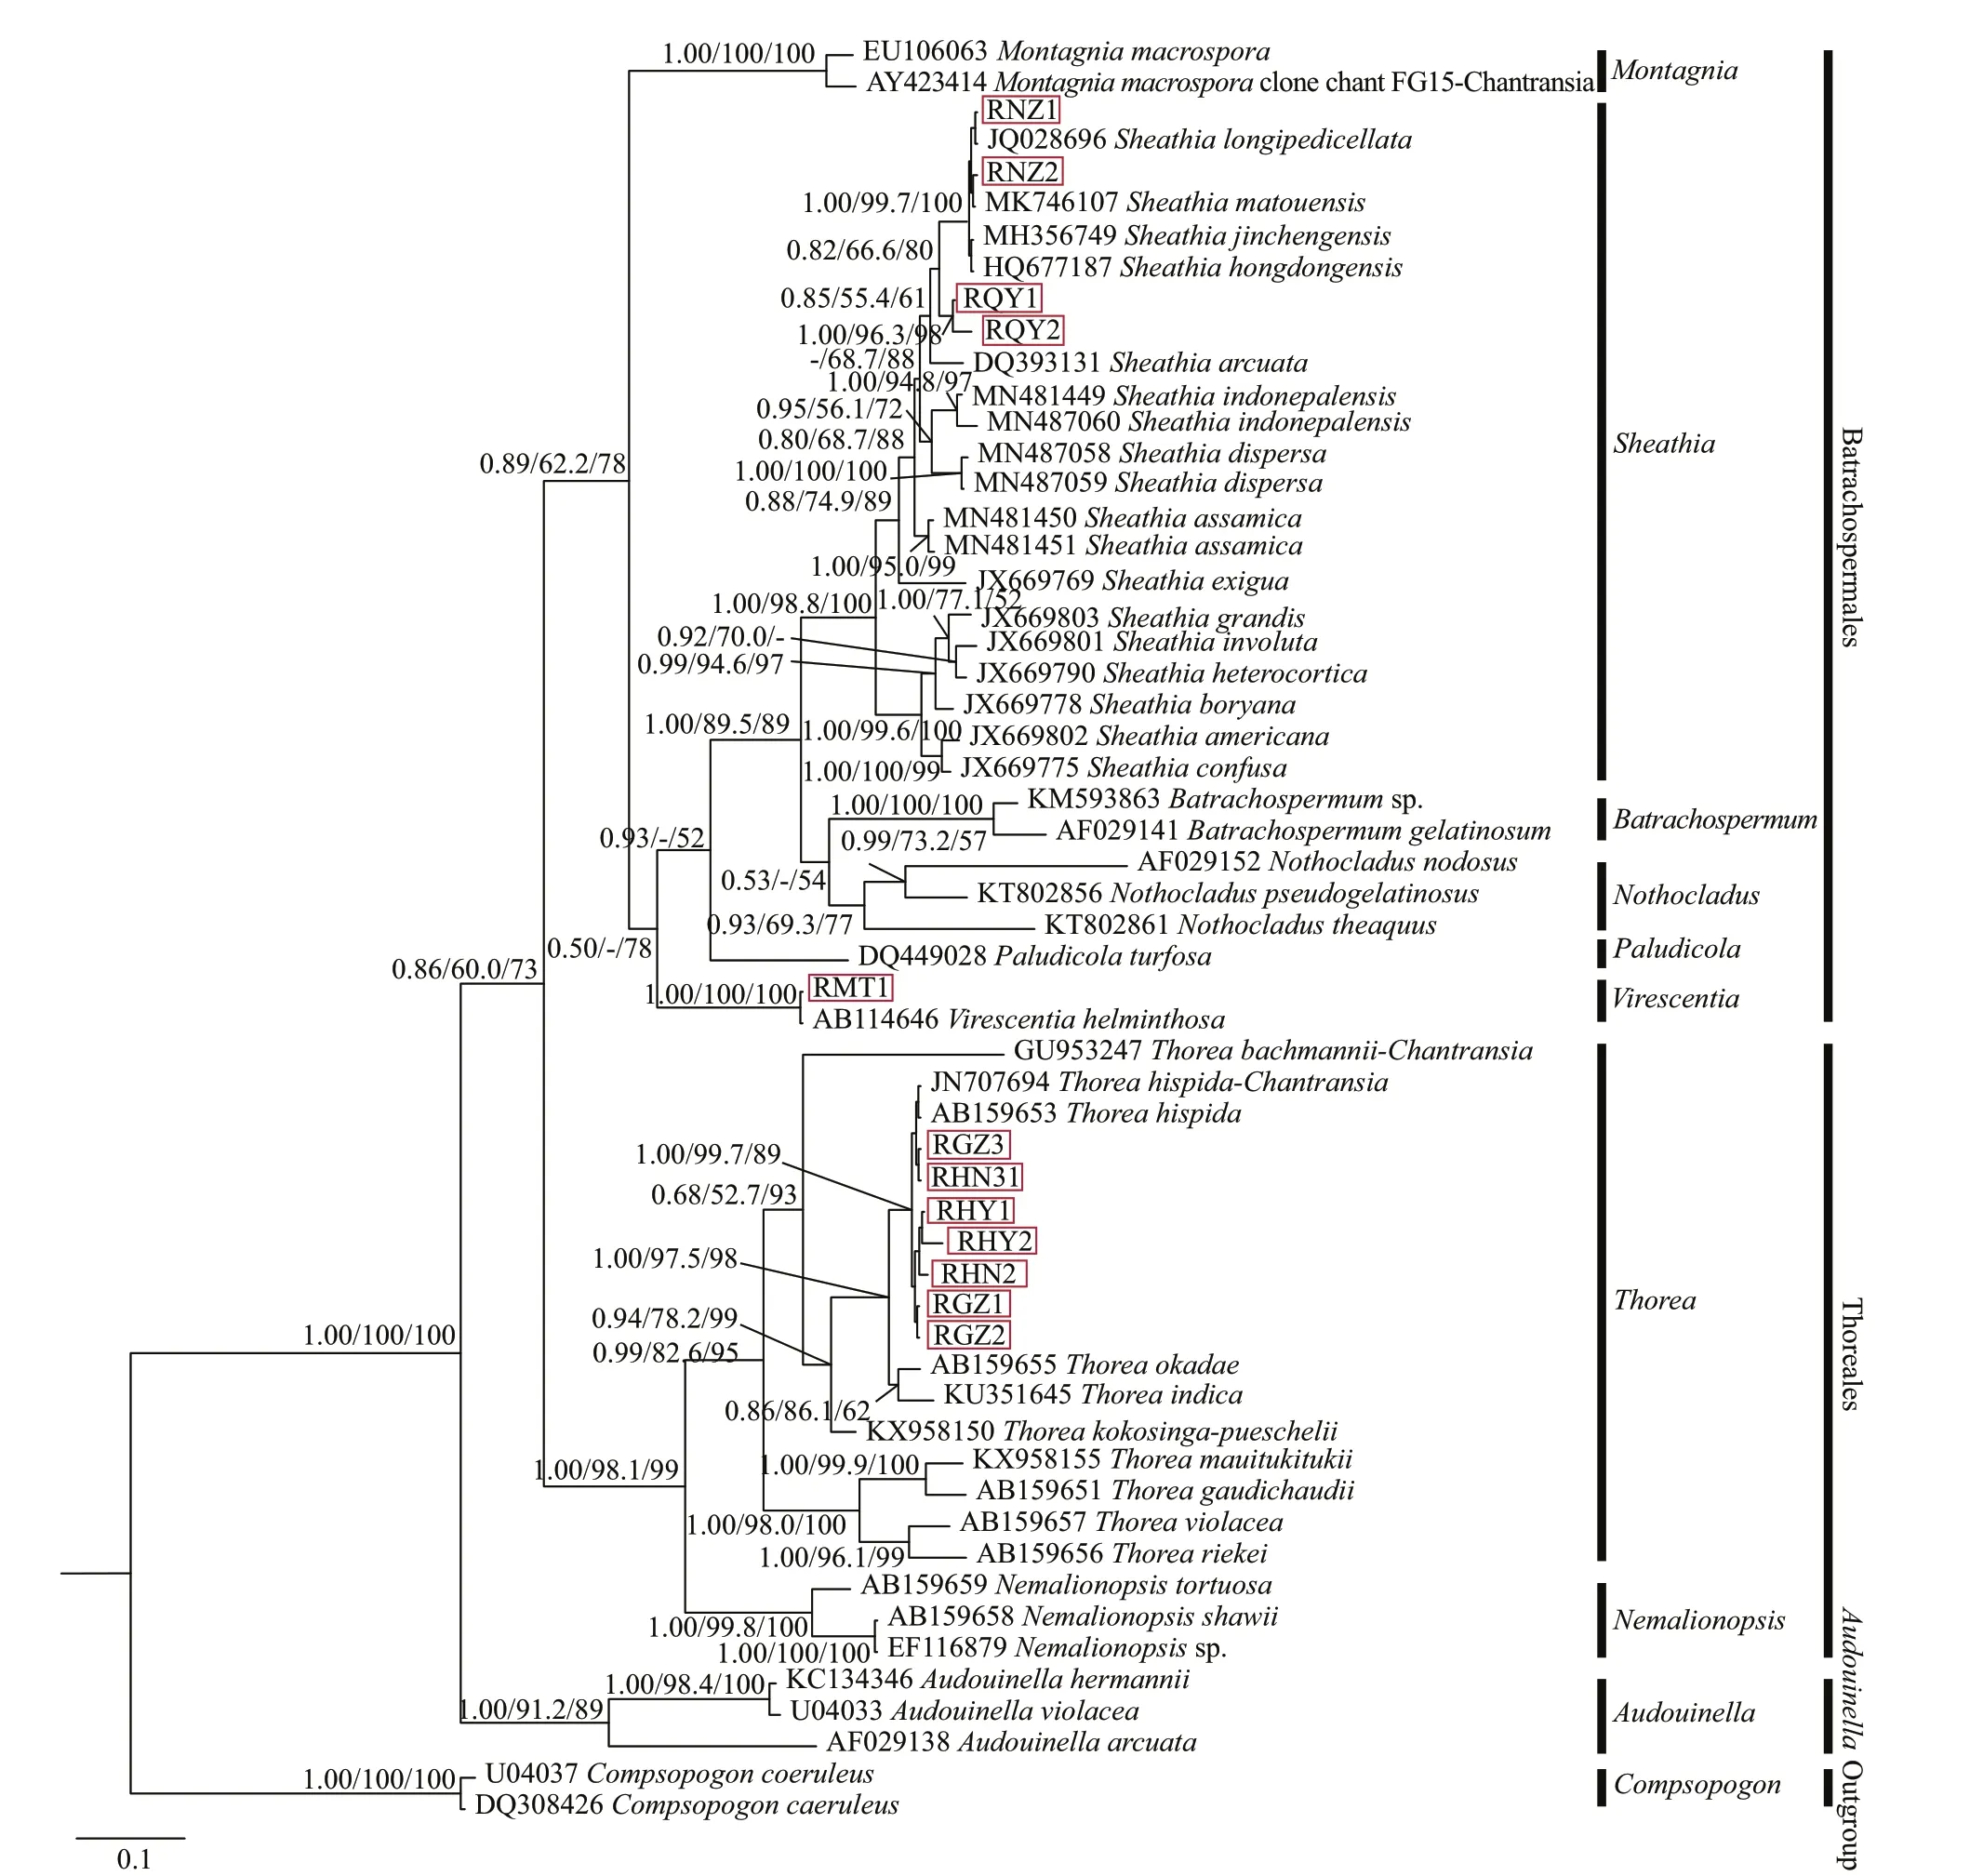
Fig.4 Bayesian inference tree based on the rbc L gene sequences
Isolate MT1 was located in the Batrachospermales branch and formed a moderately-to-strongly supported clade with theVirescentiaspecies(1.00/83.2/85). Divergence within this clade was 4%,corresponding to 11-bp diff erences. Furthermore,within theSheathiaclade, three putative “Chantransia”isolates formed two independent clades that roughly related to the gathering places: the first clade was composed ofisolates NZ1 and NZ2 collected from Niangziguan of Shanxi Province. They clustered together with moderate-to-high support values(0.95/81.0/85) and were sister to a clade formed by species ofS.hongdongensisandS.boryana((Sirodot)Salomaki & M. L. Vis in Salomaki et al. 2014: 535),while isolate QY1, collected from Qinyuan of Shanxi Province, formed the second weakly supported independent clade. The remaining six samples (GZ1,GZ2, GZ3, HY1, HY2, and HN31) in this study were in the Thoreales clade. Among theThoreaspecies,T.hispidademonstrated the closest relationship with these six “Chantransia” isolates, which was well supported by thep-distance (0%–2%). However, in the UPA tree, these six isolates clustered together withT.hispidathat only had high support values for NJ(-/66.9/99).
3.2.3 Analysis of COI-5P sequences
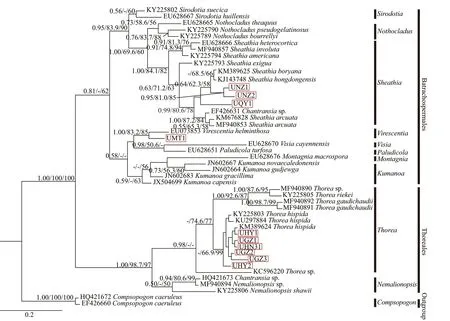
Fig.5 Bayesian inference tree based on the UPA gene sequences
In this study, the COI-5P alignment of species was 573 bp, with 287-bp variable sites (among which 265 bp were Parsimony-Informative sites).Supplementary Table S4 lists the pairwise distance between the “Chantransia” isolates and other specimens of orders Batrachospermales and Thoreales. All three phylogenetic analyses (NJ, BI,and ML) based on COI-5P alignments showed similar topological structures. Therefore, only the BI trees were shown indicating supporting values calculated from the three methods in Fig.6.
Pairwise distance based on COI-5P sequences showed that sequence divergences among MT1 and other species of the order Batrachospermales were 16%–21%, which were much larger than the variation between MT1 andV.herminthosa(9%). Meanwhile,two identical isolates, NZ1 and NZ2, diff ered fromS.hongdongensisandS.longipedicellataat a single nucleotide position. Similar to results based on therbcL sequences, isolates (QY1 and QY2) collected from Qinyuan of Shanxi Province had unique sequences, and the distances between them and the other species of genusSheathiawere larger than the intraspecific distances of this genus (0.112 0 vs 0.092 8). Furthermore, divergences between the remaining six isolates utilized in this study and the specimens ofT.hispidawere only 0%–2%,corresponding to 0–11-bp diff erences, while the average distance between these 6 isolates in the Thoreales branch and the other species of genusThoreawas 14%.
All in-group species were clustered into three main branches, corresponding to Batrachospermales,Thoreales, andAudouinella. Within the Batrachospermales branch, isolate MT1 clustered withV.helminthosaand formed a strongly supported clade(1.00/99.8/100). The four other putative “Chantransia”isolates NZ1, NZ2, QY1, and QY2 clustered together with species of genusSheathiaand formed a monophyletic clade that had high support values(0.98/90.6/98). Meanwhile, isolates NZ1 and NZ2 clustered withS.hongdongensisandS.longipedicellatathat had high support values (1.00/100/100), while the other two isolates (QY1 and QY2) collected from Qinyuan of Shanxi Province formed an independent clade. However, they were separated from other species of genusSheathiawith moderate support values for PP and NJ (0.85/63.7/78). Moreover, the remaining six samples (GZ1, GZ2, GZ3, HY1, HY2,and HN2) in this study, together with previously reported species of genusThorea, clustered with genusNemalionopsisto form the Thoreales branch. In this branch, isolates GZ1, GZ2, GZ3, HY1, HY2, and HN2 clustered in a single clade together withT.hispidathat had high support values (1.00/98.4/100).
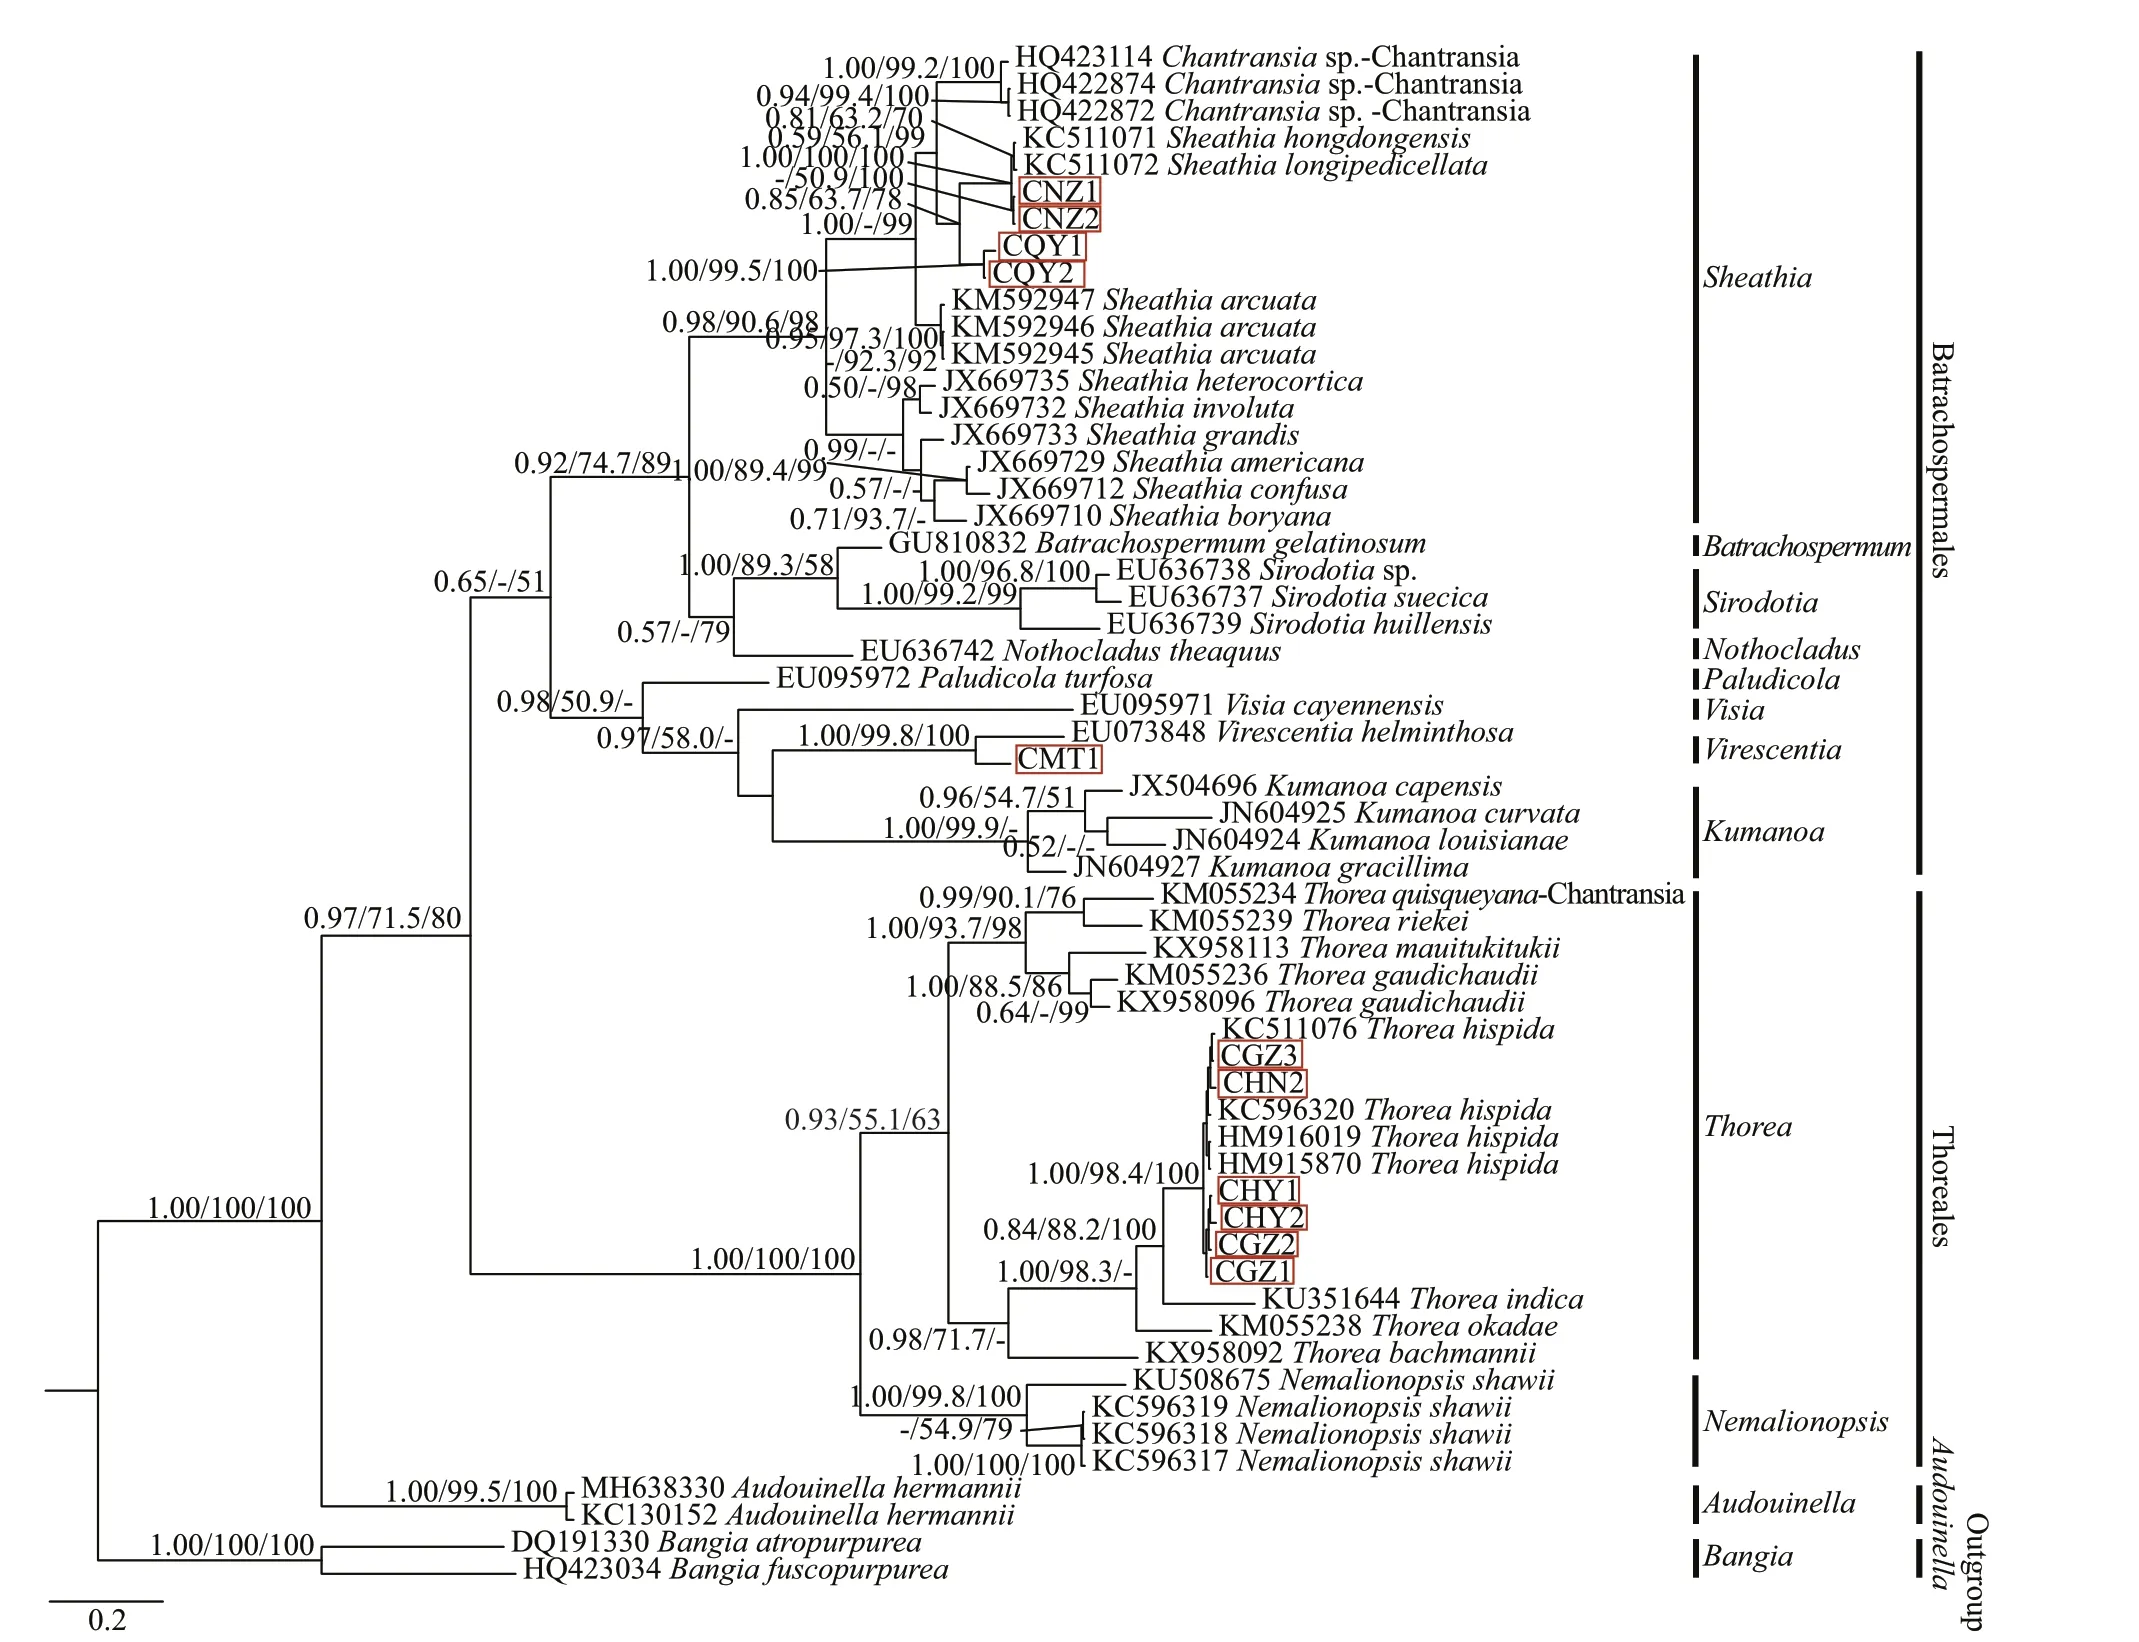
Fig.6 Bayesian inference tree based on the COI-5P gene sequences
4 DISCUSSION
Despite the research on the delimitation of Acrochaetiaceae having been executed for a long time, some controversy remains one aspect of which is the applicability of criteria proposed by Skuja(1934). Based on his proposal, all reddish species morphologically similar toAudouinellaare trueAudouinella, while bluish species represent the“Chantransia” stage. However, several subsequent studies have queried this conclusion. For example,Kaczmarczyk and Sheath in 1992 clarified that freshwater red algae color change is related to irradiance (Kaczmarczyk and Sheath, 1992).Additionally, Chen et al. (2014) reported color changes (bluish-green in the stream that turned reddish in light) of an acrochaetioid algae aff ected by light. These results, supported by both morphological and molecular data, show that all 12 isolates that are reddish, bluish, and brownish belong to the“Chantransia” stages of orders Batrachospermales and Thoreales. Consequently, when combined with previous studies, caution is recommended in thallus color criteria which were considered a standard for identifying trueAudouinella, combining molecular analysis with morphological methods is essential.
Owing to the limitations of morphological methods when analyzing the affi nities of putative “Chantransia”stages, molecular-assisted methods have been used extensively (Harper and Saunders, 1998; Pueschel et al., 2001). Similar toA.macrospora((Wood) Sheath& Burkholder 1985: 111 (Table 1)), isolate HN31 has large monosporangia (>20 μm in diameter) (Table 2)(Necchi and Zucchi, 1997). In previous studies, all“A.macrospora” is indicated to be the “Chantransia”ofB.macrosporum(Pueschel et al., 2001; Chiasson et al., 2005). However, molecular phylogeny obtained in this study unequivocally demonstrated that isolate HN31 was the “Chantransia” stage ofT.hispida. In addition to isolate HN31, this study also confirmed that six “pygmaea” isolates (GZ1, GZ2, GZ3, HY1,HY2, and HN2) collected from the Guizhou, Hubei,and Henan Provinces also belong toT.hispida.Considering the locations ofT.hispidathat were previously reported in China, including Shanxi,Jiangsu, Yunnan, and Guizhou Provinces, the number ofT.hispidadistribution sites is proposed to have expanded to six (Shi, 2006). Pairwise distance and molecular phylogenetic trees both supported that one of the three “hermannii” isolates MT1 can be assigned toV.helminthosa, while the other two “hermannii”isolates NZ1 and NZ2 formed a lineage and were allied with severalSheathiataxa. Furthermore, a new species of genusSheathia, corresponding to two“A.tenella” morphologies (QY1, QY2), is proposed primarily based on the DNA sequence data generated in this study, otherwise known asS.qinyuanensis.
SheathiaqinyuanensisHAN, NAN ET XIE sp.nov. (Fig.3a & b)
Known only from the “Chantransia” sporophyte generation. Tuft-shape, with the thallus being brownish, 13.2–15.8 mm length, with erect and densely branched filaments, and branch angle<25°.Vegetative cells are cylindrical, 7.3–16.4 μm in length and 3.6–7.3 μm in diameter, reproducing via abundant ovoid or sub-spherical monosporangia, 3.6–7.8 μm in length and 4.4–6.7 μm in diameter.
Etymology—The species epithet refers to the type locality (Qinyuan, China).
Type—China, Shanxi Province, Qinyuan (36°29′N,112°19′E): on the surface of the stone in flowing water, May 2018, Fang-Ru NAN (Holotype: SXUQY18051; Paratype: SXU-QY18052). It is deposited in the Herbarium of Shanxi University (SXU), Shanxi University, Taiyuan, Shanxi Province, China.
Authentic strain—SXU-QY18051.
Iconotype—Fig.3a & b.
Representative DNA Barcode: GenBank MK183661 and MK183662 forrbcL, MK183675 for UPA, and MK183688 and MK183689 for COI.
The red algal genusThoreais classified in the Rhodophyta (Florideophyceae, Thoreales,Thoreaceae). Until now, sixteen species have been reported worldwide. However, only two species (T.hispidaandT.violaceaBory 1808: 133, pl. 18: Fig.2)have been reported in China (Xie and Shi, 2003).Also, some research has confirmed thatT.hispidais associated with several diff erent morphological“Chantransia” stages. Based on seven gene markers,Han (2012) performed a phylogenetic analysis ofA.sinensis(C.-C.Jao 1940: 241, pl. 1: Figs.5 & 6) andA.heterospora(S. L. Xie & Y. J. Ling 1998: 281,Fig.1) and found that they are actually “Chantransia”ofT.hispida. On the bases ofrbcL and SSU rDNA,Chen et al. (2014) found that samples morphologically identified asA.heterosporarepresent the“Chantransia” stage ofT.hispida. Furthermore, Nan et al. (2016) reported that fourAudouinella-like species (both reddish and bluish thalli included) were the “Chantransia” stage ofT.hispida. Combined with the results of this study,T.hispidais concluded to be associated with at least four “Chantransia”morphologies (“A.sinensis”, “A.heterospora”,“A.pygmaea”, and the specimens morphologically similar to the isolate HN31 in this study).
Order Batrachospermales belongs to class Florideophyceae (Rhodophyta), which included most freshwater red algae (Entwisle et al., 2009). In this order, the genusBatrachospermumwas divided into several sections according to morphological characteristics (Kumano, 2002). However, molecular phylogenetic analysis has confirmed that some sections of this genus are monophyletic and can be separated from genusBatrachospermum(Entwisle et al., 2009; Vis et al., 2012; Salomaki et al., 2014;Necchi et al., 2019). GenusVirescentiawas elevated from one section (sectionVirescentiaSirodot) of the genusBatrachospermum(Necchi et al., 2018). Until now, six species of this genus have been reported worldwide, of whichV.helminthosais the holotype species (Guiry and Guiry, 2020). In China, up to this point in time, this new genus has not been extensively studied, while sectionVirescentiahas been studied in a few reports (Xie, 2001; Ji, 2013). According to morphometric identification,B.helminthosum(currently regarded as a synonym ofV.helminthosa)was reported from Zhejiang and Chongqing (Jao,1941). In this study, isolate MT1, which is morphologically similar toA.hermannii, was collected from Matou of Shanxi Province and was concluded to represent the “Chantransia” stage ofV.helminthosa.Consequently, the number ofV.helminthosadistribution sites in China expands to three.
Traditional classification methods are mainly based on the morphological characteristics of algae.However, the morphological characteristics of“Chantransia” stages will change under the influence of factors such as physiology and ecology. Nucleotides are carriers of genetic information; therefore evaluating the evolutionary relationship of species via the homology of nucleotide sequences is extremely important. Ji et al. (2017) assessed DNA barcode markers for freshwater red algae and suggested that four sequence regions (COI-5P,cox2–3 spacer, UPA,andrbcL) were useful for species-level identification in genusBatrachospermum, except for some allied species.rbcL marker was utilized by Chiasson et al.(2005) and by Necchi and Oliveira (2011) for identifying “Chantransia” isolates in members of Batrachospermales and Thoreales, strongly confirming that all “macrospora” isolates were “Chantransia” ofB.macrosporum, whereas “C.pygmaea” was associated with at least nine species. Also, molecular sequences of COI-5P and UPA were utilized to assess phylogenetic positions of fourAudouinella-like species from China, showing high species identification resolution (Nan et al., 2016). Johnston et al. (2018)reported a new species—Thoreaquisqueyana(E. T.Johnston & M. L. Vis)—based on its “Chantransia”stage samples and three DNA sequences (rbcL, COI-5P, and LSU). Based on the phylogenetic analysis ofrbcL and the COI-5P gene, a new genusVirescentiaand a new speciesV.viride-americana(Necchi, D. C.Agostinho & M. L. Vis 2018: 323, Figs.18–22) were proposed by Necchi et al. (2018). Moreover, another new genusMontagniawas also proposed that was based onrbcL and COI-5P sequence data (Necchi et al., 2019). Furthermore, much research revealed that the UPA gene can distinguish samples at the species level, even though the sequence is shorter and the intra- and inter-specific divergence values are relatively lower (Sherwood and Presting, 2007;Clarkston and Saunders, 2010). In this study, two chloroplast genes (rbcL and UPA) and a mitochondrial gene (COI-5P) were used to elucidate the relationships between all twelve “Chantransia” isolates and the species ofAudouinella, Batrachospermales, and Thoreales. Twelve isolates were demonstrated to belong unequivocally to the “Chantransia” stages of orders Batrachospermales and Thoreales. Moreover,many species of freshwater red algae, especially orders Batrachospermales and Thoreales, may exist in the“Chantransia” stage for a long time when environmental conditions are unsuitable for gametophyte growth.When compared with two longer molecular markers,SSU and LSU, utilized by Chen et al. (2014) and Johnston et al. (2018), the three DNA markers used in this study (rbcL, UPA, and COI-5P) are more rapid and convenient for species identification.
5 CONCLUSION
Based on all three DNA fragments, includingrbcL,UPA, and COI-5P, all twelve isolates in this study were demonstrated to belong unequivocally to three diff erent generaSheathia,Virescentia, andThorea,corresponding to the two orders Batrachospermales and Thoreales. The proposal ofS.qinyuanensisas a new species of genusSheathiafrom China is supported by DNA sequence data generated in this study. Furthermore, isolate MT1 was demonstrated to be the “Chantransia” ofV.helminthosa, which expands theV.helminthosaspecies distribution in China to three. Seven isolates (GZ1, GZ2, GZ3, HY1,HY2, HN2, and HN31) represented the “Chantransia”ofT.hispida, of which the descriptions of HY1, HY2,HN2, and HN31 expand theT.hispidaspecies distribution in China to six.
6 DATA AVAILABILITY STATEMENT
The data that support the findings of this study are available on request from the corresponding author(email: xiesl@sxu.edu.cn).
7 ACKNOWLEDGMENT
Dr. S. James (University of California, Davis) is acknowledged for the English editing. We sincerely thank Prof. LIU Guoxiang from Institute of Hydrobiology, Chinese Academy of Sciences for providing samples. Dr. ZHU Huan from Institute of Hydrobiology, Chinese Academy of Sciences is acknowledged for providing information on the sample collecting.
 Journal of Oceanology and Limnology2021年3期
- Journal of Oceanology and Limnology的其它文章
- Steady increase in water clarity in Jiaozhou Bay in the Yellow Sea from 2000 to 2018: Observations from MODIS*
- Phylogenetic diversity and bioactivity of culturable deepsea-derived fungi from Okinawa Trough*
- Allelopathic eff ects of mixotrophic dinoflagellate Akashiwo sanguinea on co-occurring phytoplankton: the significance of nutritional ecology*
- Investigation of the decline of Ulva prolifera in the Subei Shoal and Qingdao based on physiological changes*
- Effi ciency of phosphorus accumulation by plankton,periphyton developed on submerged artificial substrata and metaphyton: in-situ observation in two shallow ponds*
- Petroleum exploitation enriches the sulfonamide resistance gene sul2 in off shore sediments
