
Preparation and physicochemical/antimicrobial characteristics of asparagus cellulose films containing quercetin
2021-06-05 06:29ToJinLingYnWeiLiuShuiLiuChnghongLiuLeiZheng
食品科学与人类健康(英文) 2021年2期
To Jin, Ling Yn, Wei Liu, Shui Liu, Chnghong Liu,*, Lei Zheng,c,*
a School of Food and Biological Engineering, Hefei University of Technology, Hefei 230009, China
b Intelligent Control and Compute Vision Lab, Hefei University, Hefei 230601, China
c Research Laboratory of Agricultural Environment and Food Safety, Anhui Modern Agricultural Industry Technology System, Hefei, 230009, China
ABSTRACT
Due to the increased potential for application of natural biopolymers in the food industry, the goal of this study was to prospectively produce antimicrobial films using asparagus residue. In this study, cellulose was extracted from asparagus residue, and then 3 cellulose solutions of 0.008, 0.01 and 0.025 g/mL were applied to prepare films using a phase inversion process. Films were characterized by Fourier transform infrared spectroscopy (FTIR), X-ray diffraction (XRD), thermal gravimetric analysis (TGA) and scanning electron microscopy (SEM). The film produced by 0.01 g/mL asparagus cellulose solution exhibited a swelling ratio of 125.4% and excellent antimicrobial activity against Escherichia coli and Staphylococcus aureus using the disk agar diffusion method. This study presents a promising method for producing antimicrobial films with asparagus residue.
Keywords:
Asparagus
Cellulose films
Quercetin
Antimicrobial properties
1. Introduction
Asparagus (Asparagus officinalis, L.) is a high-nutrient crop,with a global harvest of 8.95 million tons in 2017. China, Peru and Germany are the major producers, and China is the largest asparagus producing country in the world [1]. Asparagus has been shown to contain large amounts of natural cellulose and quercetin(QUE), which a re beneficial to the human body [2,3]. Because of the harvesting, transportation and production processes, a large amount of damaged a sparagus is discarded, which results in a great loss of asparagus. The conventional solution to this problem is to directly feed animals with the asparagus residue. Thus, there is an emergent demand to reasonably and effectively utilize the asparagus residue.
Cellulose is a natural polymer that is abundant in the nature. It has gradually become the focus of natural polymer development and utilization due to its non-toxic, non-harmful and biocompatible characteristics [4]. Many studies have examined environmentally friendly, edible and biodegradable packaging films generated from cellulose [5]. Films with anti-inflammatory, anticancer and antimicrobial properties could be obtained by incorporating one or more functional factors in cellulose mixtures [6,7]. Additionally, natural cellulose, consisting of bacterial cellulose extracted from Acetobacter,Agrobacterium and Pseudomonas, could also be used to prepare films[8-10]. However, the extraction process of bacterial cellulose involves high energy consumption and cost [11-13]. Compared to bacterial cellulose, natural cellulose can be obtained directly from crops such as sugarcane bagasse [14]. To the best of our knowledge, little information is available regarding the utilization of asparagus residue.
In the current study, the cellulose obtained from asparagus residue was used to prepare cellulose films by a phase inversion method, and QUE-loaded asparagus cellulose (QUE-AC)films were developed by incorporating QUE. The cellulose content, swelling ratio and QUE loading capacity were investigated. Furthermore, the characteristics of the QUE-AC films were studied by Fourier transform infrared spectroscopy (FTIR), X-ray diffraction (XRD) and thermal gravimetric analysis (TGA). Then, the morphologies of unloaded-AC and QUE-AC films with different cellulose concentrations were observed by scanning electron microscopy (SEM). Finally, the antimicrobial properties of the unloaded-AC films, QUE-AC films and QUE powder against Staphylococcus aureus and Escherichia coli were evaluated.
2. Materials and methods
2.1 Materials
Asparagus was obtained from a commercial greenhouse in Hefei,China. Hydrogen peroxide, sodium hydroxide, hydrochloric acid,methanol and ethanol were of analytical grade and obtained from the Sinopharm Group Co., Ltd (Shanghai, China). N,N-dimethylacetamide(DMAc) solvent was purchased from Cool Chemical Science and Technology (Beijing) Co., Ltd (Beijing, China). Lithium chloride(LiCl) was purchased from Hefei Bomei Biotechnology Co., Ltd(Hefei, China). QUE was purchased from Sigma-Aldrich Co., Ltd (St.Louis, MO, USA). The water used in this study was prepared from a Milli-Q water purification system (Zelab Instrument Technology Co.,Ltd. Shanghai, China).
2.2 Determination of the main composition of asparagus residue
Freshly picked asparagus spears was obtained from a commercial greenhouse; then, highly lignified and dehydrated spears were cut and collected every day for a week. The cut parts were freeze-dried,crushed, and passed through a 40-mesh sieve. Then, asparagus cellulose (AC) powder was extracted by the following steps [15-17]:
1) Removal of pectin:firstly, 0.1 mol/L hydrochloric acid solution was added to a conical flask containing asparagus residue at a ratio of 1:20 (g/mL). The mixture was shaken for 2 h in a water bath at 85 °C.Then,filtered residue was obtained using a vacuum filtration device,followed by washing 3 times with ultrapure water.
2) Removal of hemicellulose:firstly, 2.35 mol/L sodium hydroxide solution was added to a conical flask at a ratio of 1:20 (g/mL).The mixture was sonicated at 200 W, 60 °C for 80 min. Then,filtered residue was obtained and rinsed 3 times with ultrapure water.
3) Removal of lignin:firstly, 8% hydrogen peroxide solution was added to a conical flask at a ratio of 1:20 (g/mL), and the pH was adjusted to 11.0. After 30 min of reaction in a water bath at 30 °C,filtered residue was obtained and rinsed 3 times with ultrapure water.
4) The esters and several residue pigments were washed 3 times with 95% alcohol. Finally, AC was obtained after drying in an oven at 60 °C.
According to AOAC Official Method 2009.01 and Brunt et al.,[18,19] the insoluble dietary fibre (IDF) and ash content in asparagus residue was measured by the enzymatic-gravimetric method.
2.3 Preparation of QUE-AC films
The operation flow chart is shown in Fig. 1. The dried asparagus cellulose was placed in a centrifugal tub, then 10 mL of distilled water was added, and the mixture was incubated for 12 h. The cellulose supernatant was centrifuged at 6 000 r/min for 15 min, and the cellulose was collected. Afterward, 5 mL of methanol was added to the cellulose, and the mixture was shaken for 15 min and left to stand for 30 min. Then, the methanol was replaced with pure DMAc solution using the same method. Each of the above replacement procedures was repeated 3 times [20]. Finally, 3 cellulose solutions of 0.008, 0.01 and 0.025 g/mL were obtained by dissolving asparagus cellulose in 8% LiCl/DMAc solvent.

Fig. 1 The flow chart of preparing QUE-AC film.
To obtain the same size films, 2 mL of different concentrations of cellulose solutions was added to small petri dish (d = 35 mm); then,2 mL of absolute ethanol was slowly added to the dish along the wall.Cellulose gels were obtained after 24 h and then placed in a petri dish (d = 70 mm) containing 4 mL of 5 mg/mL QUE solution. QUEAC gels were obtained after 48 h at 4 °C. Finally, QUE-AC films,containing 0.008, 0.01 and 0.025 g/mL AC (coded as QUE-AC0.008,QUE-AC0.01 and QUE-AC0.025films, respectively), were obtained from QUE-AC gels using a vacuum freeze dryer. Unloaded-AC films, including unloaded-AC0.008, unloaded-AC0.01 and unloaded-AC0.025films, were also produced by the same processes.
2.4 Characterization of QUE-AC films
2.4.1 FTIR analysis
FTIR measurement was carried out on a Thermo Scientific™Nicolet™ iS™10 FTIR spectrometer. All samples were mixed with solid KBr powder and then pressed into a stable sheet by a hydraulic tableting machine at room temperature. Spectral data were collected in the wavenumber range of 4 000 cm-1to 400 cm-1. Air was regarded as the background, and the Y-axis was set as transmittance (%).The characteristic peaks of the sample were compared to determine whether QUE was successfully loaded in the cellulose.
2.4.2 XRD measurement
XRD was typically applied for the analysis of crystal structures.Sharp peaks usually represent the crystallization of components,and the weakening or enhancement of the characteristic peak signals usually indicates structure changes [21]. XRD patterns of QUE-AC films, AC, unloaded-AC films and QUE powder were recorded using a Rigaku Mini flex-600 X-ray diffractometer with Cu Kα radiation(λ = 0.154 06 nm) at 40 kV and 15 mA. Scattered radiation within the 2θ degree range from 5° to 80° was tested continuously at a scan rate of 10 °/min.
2.4.3 TGA analysis
Detection of the thermal properties of QUE-AC films, QUE,unloaded-AC films and AC was carried out with a Netzsch STA449F5 thermal analyzer. All samples were heated from 30 °C to 400 °C at 10 °C/min under a stable flow of nitrogen (20 mL/min). Finally,approximately 17 761 points were investigated from each sample.
2.4.4 SEM analysis
The morphologies of unloaded-AC and QUE-AC films (0.008,0.01 and 0.025 g/mL) were observed and acquired by a SU8220 Cold Field Emission Scanning Electron Microscope (resolution: 0.8 nm, 15 kV; 1.1 nm, 1 kV; Hitachi, Japan).
2.5 Determination of swelling ratio and QUE loading rate
2.5.1 Swelling ratio
The swelling ratio of the unloaded-AC films was determined by the weight method [22]. Dried films were first weighed and then immersed in ultrapure water, and then each sample was weighed at 4,12, 24, 36 and 48 h. The swelling ratio (SR) of the unloaded-AC films was investigated by the following Equ 1:

Where Wtwas the weight of films at each time point (4, 12, 24, 36 and 48 h), and Wdriedwas the original weight of the freeze-dried films.
2.5.2 QUE loading rate
According to the procedure described in previous study [23],a standard curve of different concentrations of QUE solutions was prepared at 375 nm using an ultraviolet spectrophotometer(GENESYS 10S UV-Vis, Thermo Fisher, USA). The QUE-AC gels were rinsed twice using ultrapure water after immersion in a petri dish containing 4 mL of 5 mg/mL QUE solution for 48 h at 4 °C.Then, the washed solution and remaining QUE soaking solution were mixed, and the same volume of solution was prepared using absolute ethanol. The absorbance values were measured at 375 nm by a spectrophotometer, and the QUE loading rate (QLR) was calculated according to Equ 2.
Where C0= 5 mg/mL, V0= 4 mL; C1and V1were the concentrations and total volume of the wash solution and remaining QUE soaking solution; Mgelwas the mass of the unloaded-AC gel.
2.6 Antimicrobial properties
The antimicrobial property assay was carried out according to[24] with some modifications. Firstly, 500 μL of S. aureus or E. coli suspension was inoculated in Luria-Bertani (LB) liquid medium and incubated in a gas bath shaker incubator for 24 h at 37 °C and 180 r/min. After 100-fold dilution, 100 μL of the diluted bacteria solution was applied to LB agar medium. Unloaded-AC films(d = 10 mm), QUE-AC films (d = 10 mm, containing 5 mg of QUE) and QUE powder (5 mg) were placed on the medium and gently pressed to make contact with the surface of the medium.Finally, the inhibition zone was measured. Antimicrobial assays were conducted in triplicate. The average of three repetitions was recorded as the final result.
2.7 Statistical analyses
IBM SPSS Statistics 21 was used to determine the differences among groups. The asparagus composition was recorded as the mean ±standard deviation (SD), and different letters represent significant differences (P < 0.05).
3. Results and discussion
3.1 Main compositions of asparagus residue
The main compositions of asparagus residue are shown in Table 1. The contents of IDF, cellulose and ash were 28.2%, 11.5% and 11.8%, respectively. Moreover, the cellulose content accounted for nearly 45% of the IDF in the asparagus residue, which indicated that asparagus residue could be a good source of cellulose. Fig. 2B shows the XRD profile of AC. The XRD results of AC indicated four unique peaks at 20°-30°, 30°-40°, and in particular, a doublepeak at 10°-20°, which illustrated that the extracted AC consisted of cellulose I [25].

Table 1Main composition of asparagus residue.
3.2 Characterization of QUE-AC films
3.2.1 FTIR
As shown in Fig. 2A, the FTIR spectra of the QUE-AC films were similar to those of AC and unloaded-AC films. The peak at 1 186 cm-1was considered related to the C-H bending vibration, and the peak at 1 226 cm-1was considered an essential unit of glucose. The C=C vibration exhibited a broad peak from 1 443 cm-1to 1 520 cm-1, and the peak at 1 578 cm-1was relevant to the stretching vibrations of the benzene ring. The band at 1 673 cm-1was associated with the bending vibration of C=O [26-28]. Characteristic spectral absorption peaks of QUE and AC were both found in QUE-AC films. However, the absorption peak intensity of QUE in QUE-AC films was significantly weakened, probably because QUE was well encapsulated by the cellulose matrices through hydrogen bonds [29,30]. The QUE-AC films, AC and unloaded-AC films showed similar curves, which suggested that the LiCl/DMAc solvent system affected the magnetic relaxation phenomena of the respective carbons in an anhydroglucose unit of AC but did not change the cellulose structure.

Fig. 2 The FTIR (A) and XRD (B) results of QUE, QUE-AC films, AC and unloaded-AC films.
3.2.2 XRD
The XRD characteristic signal curves of QUE, QUE-AC films,AC, and unloaded-AC films are shown in Fig. 2B. AC showed characteristic peaks of cellulose I at 15.02°, 16.78°, 22.82° and 34.70°. However, the QUE-AC films and unloaded-AC films only presented one peak between 20° and 30°, which is a feature of cellulose II. When QUE was compared to QUE-AC films, the sharp characteristic peaks of QUE disappeared in the curve of QUE-AC films. These results were similar to those of [31,32], which mentioned that the QUE would stay an amorphous state and its crystallinity would decrease when encapsulated in cellulose molecule. As the XRD spectrum of QUE-AC films showed, only the crystal structure of cellulose could be detectable.
3.2.3 TGA
The TGA analysis was performed to further confirm that QUE was successfully loaded in cellulose. The thermal stability of QUE,QUE-AC films, AC, and unloaded-AC films is shown in Fig. 3.QUE exhibited a unique degradation spot at 340 °C. Additionally,AC and unloaded-AC films both exhibited a characteristic stage at 270 °C, indicating the specific degradation stage of cellulose [33,34].Compared to QUE and AC, the QUE-AC films simultaneously showed degradation stages of QUE and cellulose, which suggested that QUE was successfully loaded in cellulose. The thermal stability of the QUE-AC films was different from unloaded-AC films due to the loading of QUE in the cellulose.

Fig. 3 The TGA results of QUE, QUE-AC films, AC and unloaded-AC films
3.2.4 SEM
The surface morphologies of the unloaded-AC and QUE-AC films with the cellulose concentration of 0.008, 0.01 and 0.025 g/mL were observed by SEM (Fig. 4). Compared with each unloaded-AC film (Fig. 4A-4C), the pore number of the films increased as the cellulose concentration increased from 0.008 g/mL to 0.01 g/mL and then significantly decreased from 0.01 g/mL to 0.025 g/mL. A similar trend was shown by Geng [35], who illustrated that more stable intramolecular and intermolecular hydrogen bonds would form between the cellulose molecules when the cellulose concentration increased. Meanwhile, compact intramolecular and intermolecular hydrogen bonds network would make it hard for functional substances getting connected with cellulose molecules [36]. As a result, the QUE-AC0.01films presented higher QUE loading ability than QUEAC0.008 and QUE-AC0.025films (Fig. 4D-4F).

Fig. 4 The morphology images of unloaded-AC0.008films (A), unloaded-AC0.01films (B), unloaded-AC0.025films (C), QUE-AC0.008films (D),QUE-AC0.01films (E) and QUE-AC0.025films (F).
3.3 Swelling ratio and QUE loading rate
As shown in Fig. 5A, the swelling ratios of unloaded-AC0.008,unloaded-AC0.01 and unloaded-AC0.025films were 166.4%, 125.4% and 52.1%, respectively. From 0 to 12 h, the swelling ratios of the 3 films were significantly increased due to capillary action. Then,the swelling ratios increased gradually from 12-36 h. Finally, the swelling ratios remained stable after 36 h. The results were similar to those of Wang et al. [37] and Wei et al. [38], who reported that films would have difficulty absorbing additional water due to the relaxation stress of cellulose molecules and diffusion resistance of the absorbed water molecules. Furthermore, Djahed et al. [39] also found that the molecular chains of cellulose would become tightly entangled when the cellulose concentration was increased.
As shown in Fig. 5B, the QUE loading rate was increased when the AC concentration changed from 0.008 g/mL to 0.01 g/mL and then decreased when the AC content increased from 0.01 g/mL to 0.025 g/mL. As a result, the unloaded-AC0.01 films displayed the highest QUE loading rate as compared with the unloaded-AC0.008 and unloaded-AC0.025films (P< 0.05).
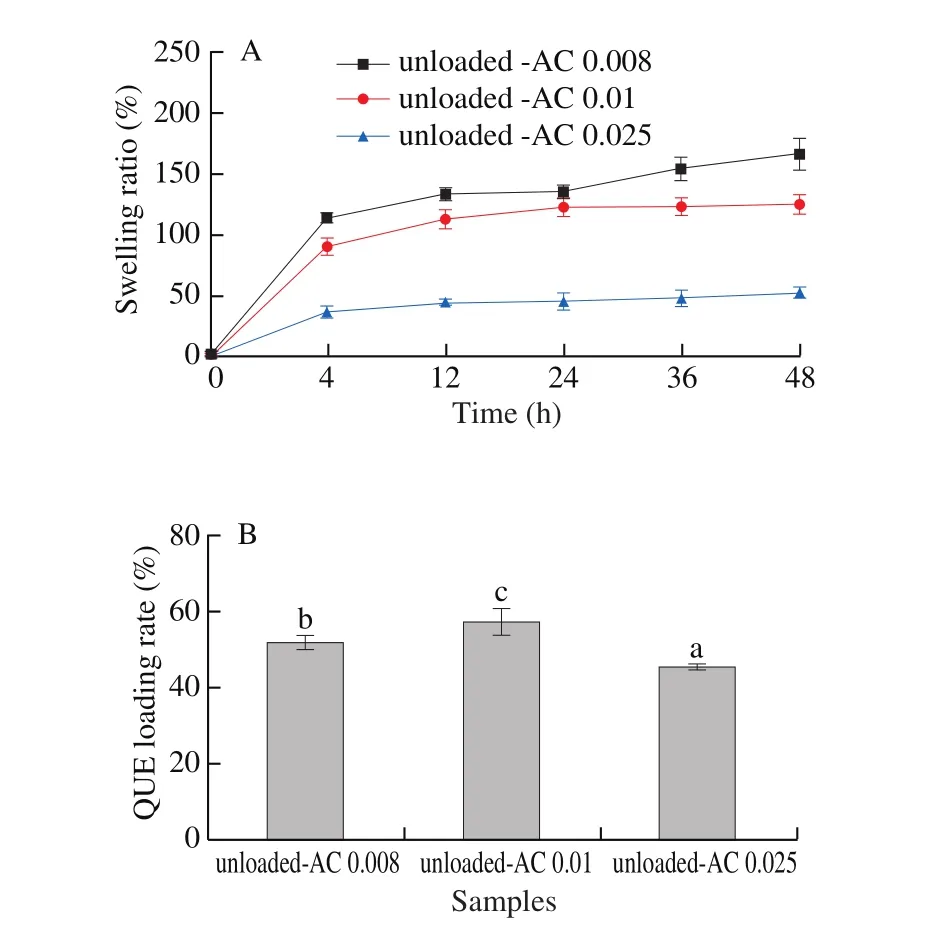
Fig. 5. The swelling ratio (A) and QUE loading rate (B) of unloaded-AC0.008,unloaded-AC0.01 and unloaded-AC0.025films. Different letters represent significant differences among films (P < 0.05).
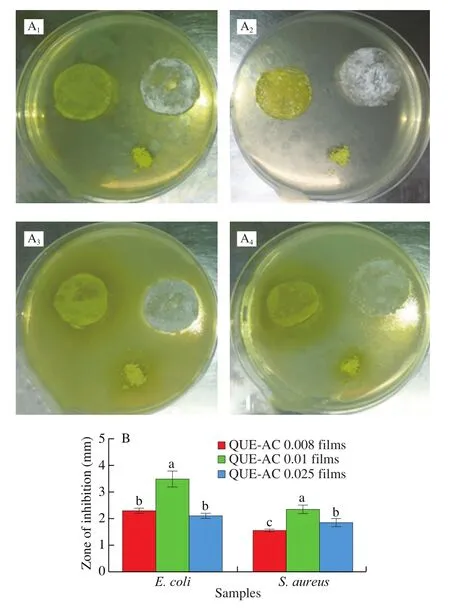
Fig. 6. The inhibitory effect of QUE-AC0.008, QUE-AC0.01 and QUEAC0.025films on E. coli and S. aureus. Lowercase letters in (B) represent significant differences among treatments (P < 0.05).
3.4 Antimicrobial properties
The results of the antimicrobial assay are shown in Fig. 6. The unloaded-AC films and QUE powder did not show any zone of inhibition againstE. coliandS. aureus. The results are similar to the comments by Kumar et al. [40] and Sabya et al. [41], who indicated that the main reason to enhance the antibacterial activity of QUE loaded polymeric nanoparticles is due to alteration in membrane permeability, absorption, and adhesion of nanoparticles with possible fusion with the cell membrane. On the contrary, all QUE-AC films(d = 10 mm) showed obviously antibacterial activities and the QUEAC0.01 films exhibited larger inhibition zones (P < 0.05) of 3.5 and 2.35 mm against E. coli and S. aureus (Fig. 6B) respectively,as compared with QUE-AC0.008 and QUE-AC0.025 films, at 24 h after inoculation on LB medium. This may have occurred because the QUE-AC0.01 films could load more QUE than QUE-AC0.008 and QUE-AC0.025films (Fig. 5B, P < 0.05). These results indicated that the QUE-AC0.01films had better antimicrobial properties than previous studies [42,43].
4. Conclusion
In this study, cellulose was extracted from asparagus residue, and the cellulose content in asparagus residue was 11.8%. Cellulose films prepared by asparagus residue presented different morphological structures with various concentrations of cellulose solutions. The unloaded-AC0.01 films showed more pores and a higher swelling ratio of 125.4%. The QUE-AC films were examined by FTIR, XRD and SEM analysis, which indicated that the preparation process of QUE-AC films did not change the structure of the cellulose. The TGA results emphasized that QUE-AC films displayed the characteristics of both QUE and AC. Moreover, QUE-AC films exhibited excellent antimicrobial activity against E. coli and S. aureus. This study provides a reference to prepare films based on natural cellulose, which can be beneficial for food packaging, the pharmaceutical industry and environmental protection.
Conflict of Interest
None
Acknowledgements
This study is supported by the National Natural Science Foundation of China (31972134), the Key Science & Technology Specific Projects of Anhui Province (201903b06020003),the Fundamental Research Funds for the Central Universities(JZ2019YYPY0027), and the Funds for Huangshan Professorship of Hefei University of Technology (407-037019).
- 食品科学与人类健康(英文)的其它文章
- Bioactive compounds and probiotics-a ray of hope in COVID-19 management
- Approaches to evaluate nutrition of minerals in food
- The role of glutamine in supporting gut health and neuropsychiatric factors
- Anti-hyperglycemic effects of dihydromyricetin in streptozotocin-induced diabetic rats
- Aroma profile of two commercial truffle species from Yunnan and Sichuan, China:inter- and intraspecific variability and shared key compounds
- Stability of phenolic compounds and drying characteristics of apple peel as affected by three drying treatments