
Investigation of physicochemical, microbiological and sensorial properties for organic and conventional retail chicken meat
2021-06-05 06:29BernaapanAytungaBadatli
食品科学与人类健康(英文) 2021年2期
Berna Çapan, Aytunga Bağdatli*
* Manisa Celal Bayar University, Faculty of Engineering, Department of Food Engineering, Yunusemre, 45140 Manisa, Turkey
ABSTRACT
In this study, the commercially available chicken thigh and breast meat produced by organic and conventional methods were investigated in terms of physicochemical, microbiological and sensorial properties. The organic chicken breasts had higher fat content than the conventional chicken breasts. The protein content of organic thighs was higher than conventional thighs. Organic chicken meat contains more mineral substances than conventional chicken meat and has higher pH value, cooking loss and water holding capacity. Alpha-linoleic acid, docosahexaenoic acid was found to be higher in organic chicken meat. Salmonella spp. was detected in all conventional chicken and 66.66% of organic chicken.
Keywords:
Organic chicken
Conventional chicken
Chicken breast
Chicken thigh
Chicken meat quality
Fatty acid composition
1. Introduction
The rapid increase in the world population leads to an increase in food needs. The demand for animal foods with fundamental strategic importance in our nutrition continues to grow day by day [1]. The choice of poultry is greatly influenced by its nutritive and sensorial values, as well as its low price, bountiful supply, varied assortment,price relative to that of red meat and other animal products [2]. In order to increase food demand, commercial poultry breeders chose to grow faster, increasing the number of animals per unit area. These practices, which are carried out uncontrolled in order to achieve the highest possible productivity with the lowest cost and to increase the performance of the animals, cause some food safety problems for the consumers. Organic agriculture, an environmentally friendly method within the scope of the search for alternative systems to eliminate the negative effects of conventional agricultural practices on human health, animals and environment. Organic poultry farming, which has been developed in conjunction with organic (ecological) agriculture and is one of the most important organic livestock activities due to its health, has been established in the sector depending on the preferences of the consumers [1].
Organic agriculture and organic animal husbandry have been brought to the agenda in the world, USA and EU in terms of prevention of environmental problems and pollution in animal and human as a result of the use of artificial chemicals in animal nutrition and health. However, when switching from conventional animal husbandry to organic animal husbandry, animal feed contents, meat production, live weight gain, feed efficiency and animal health comparisons should be emphasized. According to the results of the research, it is seen that, although it works with less animals in the natural environment with lower productivity, the healthier herd can be obtained and the economic life of the animals increases because the stress effect on the animals is reduced [3].
Organic poultry is defined as a production model that allows animals to exhibit their natural behaviour. It is a form of production in which animal rights and welfare are emphasized foreseen not to use synthetic and chemical compounds in the nutrition, health and protection activities of chickens. Organic chicken production has gained an important share in the present day and this share is expanding day by day [1]. With the increasing consumer demand for organic and free-range broiler production based on the perception of improved welfare, it is important that the meat and eating quality from these chickens is considered [4].
The aim of this study is to determine the effects of production method (organic, conventional), brand (A, B, C, D, E, F) and carcass region (thigh, breast) on the quality characteristics of chicken meat purchased from the market. In this study, increasing interest in the production and consumption, which is grown in Turkey, organic chicken meat compared to conventional chicken meat for the physicochemical, textural and sensorial properties.
2. Materials and Methods
2.1 Materials
The conventional (slaughter age is 42 days) and organic (slaughter age is 81 days) chicken meat was obtained from 6 different brands (A,B, C, D, E, F) in the market. Chicken meats were brought to the Meat Technology Laboratory of the Faculty of Engineering at Manisa Celal Bayar University without breaking the cold chain of chicken meats,which were purchased from different markets by paying attention to the last consumption date. The chicken meat was stored in refrigerator conditions (4 °C) until analysis. In the study, two different carcass region (thigh and breast) obtained from each brand were used for physicochemical, textural and sensory analysis.
2.2 Methods
2.2.1 Proximate analysis
Moisture, protein, fat and ash content was measured following AOAC methodology [5].
2.2.2 pH measurement
Ten grams of chicken meat samples were diluted with distilled water at 1/10 (10 g/100 mL distilled water) and homogenized using a suitable mixer. The obtained homogenates were calibrated with buffer solutions of pH 4.0 and 7.0 before reading [5].
2.2.3 Cooking loss
In order to determine the cooking losses, the chicken meat samples were cooked at 180 °C. Then, chicken meat samples were cooled to room temperature, reweighed, and cooking loss values over the weight difference calculated as a percentage [6,7].
2.2.4 Water holding capacity
To determine the water holding capacity, 1 g of sample was placed on filter paper and centrifuged at 1 500 × g for 4 min. After centrifugation, the sample in the filter paper was dried overnight at 70 °C. After the drying process, the water holding capacity values of each sample were determined [8].
Water holding capacity = (M1-M2)/m × 100%. M1is sample weight after centrifugation, M2is end of drying sample weight, m is first sample weight.
2.2.5 Colour analysis
The colour analysis of the raw and cooked breasts and thigh meat was measuring with Minolta CR-310 (Osaka, Japan). Following the calibration, CIE L* (lightness), a* (redness) and b* (yellowness)values of the chicken meat samples were determined by three measurements from different points randomly selected. The areas selected for colour measurements have been excluded from significant colour defects (bruises, loss of colour, bleedings, all blood vessels, or any other condition that may have influenced uniform colour reading) [6].
2.2.6 Fatty acid profile
The fatty acid analysis of the skinless raw breast and thigh meat obtained from the market was carried out using the gas chromatography device. 1 mL of methylation agent (boron trifluoridemethanol) was added to the test tube and stored in a water bath at 90 °C for 50 min. After 50 min, 2 mL of hexane and 5 mL of water were added, and the mixture was stirred well. This mixture was allowed to stand at room temperature for 1 night to ensure phase separation.Methylated fatty acids obtained from hexane in the upper layer were taken into the vials for use in the gas chromatography device.Automatic injector, flame ionizing detector (FID) and capillary column (having a film thickness of 60 m × 0.25 mm × 0.25 μm)were used to determine the fatty acid composition of the samples.The temperature of the oven used was gradually increased. Ramped oven temperature conditions increased from 190 °C to 200 °C at 5 °C/min, held for 6 min, and then it increased by 10 °C/min and the oven temperature reached to 220 °C. Finally, by increasing the temperature at 5 °C/min, the oven temperature was reached to 230 °C and kept at this temperature for 8 min. Operating temperatures are set at 280 °C for the injection block and 320 °C for the detector. Hydrogen was used as the carrier gas and the flow rate was kept constant at 1.0 mL/min. The air of the flame ionizer detector and the flow rates of H2gas were determined to be 350 mL/min, 35 mL/min, respectively.Supelco 37 FAME mix (C4-C24) was used as the standard for the identification of fatty acids [9].
2.2.7 Warner-Bratzler shear force analysis
Samples were cooled to room temperature after cooking at 180 °C for 35 min and cut into rectangular (1 cm × 1 cm × 5 cm). (Load cell:5 kg; pre-test speed: 2 mm/s; test speed: 2 mm/s; post-test speed: 10 mm/s; cutting distance: 30 mm) [10,11].
2.2.8 Total aerobic mesophilic bacteria
To determine the total number of aerobic mesophilic bacteria in the samples, PCA (Plate Count Agar) was prepared. The petri dishes were inverted and incubated at 35 °C for 48 h. Counting in parallel petri dishes containing 30-300 colony at the end of the incubation period. The results obtained by counting are expressed as lg (CFU/g) [7].
2.2.9 Total coliform bacteria
To determine the total number of coliform bacteria in the samples,VRB (Violet Red Bile Agar) was prepared. The petri dishes were incubated at 35 °C for 24 h. Dark-red colonies with a diameter of 0.5-2 mm are counted as bacteria in the coliform group [12].
2.2.10 Salmonella spp.
Chicken meat brought to the laboratory under the aseptic conditions. Then 25 g sample weighed. 225 mL Selenite-cystine broth(Aqumedia) taken to the flask and samples enriched at 37 °C for 24 h. For the enriched samples, Salmonella Shigella Agar (SS Agar) was prepared. Incubate at 37 °C for 18-24 h. At the end of the incubation,the samples which were developed as black dots were inoculated to Triple Sugar Iron Agar (TSI Agar) and incubation at 37 °C. If there are gas bubbles in the tubes that are developing and the colour turns black,Salmonellaspp. positive, if there is no improvement,Salmonellaspp. negative [7].
2.2.11 Yeast-mold
Potato Dextrose Agar (PDA) with 10% sterile tartaric acid was used for yeast and mold count. Petri dishes were incubated at 25 °C for 5 days to determine the total number of yeasts and molds [7].
2.2.12 Sensory evaluation
Chicken meats were baked at 180 °C for 35 min and then divided into 2 cm × 2 cm × 2 cm pieces. The chicken meat was prepared without skin, salt and spices. The evaluation panels were carried out in the Sensory Tasting Room of the Department of Food Engineering at Manisa Celal Bayar University on the same day at 11:00 am.A total of 8 trained panellists of faculty members and staff of the Department of Food Engineering at Manisa Celal Bayar University were selected. Each panel included 8 panellists of the same people.Panellists were asked questions about appearance, odor, tenderness,juiciness and flavour. In each application, 6 different examples are presented to the panellists. Sample presentations include water and bread to neutralize the flavours in the mouth. A 5-point scale was used in the evaluation. Appearance features of the samples 5 (with its unique and desirable surface color) to 1 (unacceptable darkening of chicken meat); odor characteristics 5 (in the case of a typical chicken fragrance, the absence of foreign odor) to 1 (unacceptable degree of unpleasant odor in chicken smell);flavor 5 (typical chicken flavor and no foreign flavor) and to 1 (unacceptably uncomfortable foreign taste in chicken flavor); juiciness 5 (very juicy) to 1 (very dry); tenderness 5 (very tender) to 1 (very hard) points. The results were evaluated by using variance analysis for the obtained data [11].
2.3 Statistical analysis
The analysis of the data obtained from the study was performed using the Statistical Analysis System (SAS) program. Variance Analysis Technique (ANOVA) was used to determine whether the difference between the groups averages. The results were interpreted by the Duncan test in order to reveal the difference between the results with significant effect. In addition, PROC CORR procedure was applied and the correlation levels between the variables were examined and interpreted [13].
3. Results and Discussion
3.1 Moisture content
The moisture contents of the organic and conventional chicken(thigh and breast) meat samples are given in Table 1. The mean moisture content of organic and conventional chicken meat values was assessed between 72.62% and 76.42%. The mean moisture content of conventional and organic thigh meats was determined as 74.79% and 74.39%, respectively (P> 0.05). The mean moisture content of conventional and organic breast meats was 74.21% and 73.76%, respectively (P> 0.05). In this case, the mean moisture content of conventional chicken meat was higher than organic chicken meat (P> 0.05). The body and muscle composition of animals vary depending on age. It is known that as the age of the chickens increases, the amount of moisture in their bodies decreases [14].Therefore, considering that organic chickens are cut when they are at least 81 days old, it is expected that organic chicken meat will contain less moisture than conventional chicken meat.

Table 1Moisture, ash, fat and protein content and Duncan multiple comparison test results of chicken thigh and breast meat samples produced by conventional and organic methods.
Husak [9] found that the difference between the moisture content of organic and conventional breast meat statistically significant (P<0.05). Similar to our study, it was found that conventional breast meat had higher moisture than organic breast meat.
3.2 Fat content
The fat content of chicken thigh and breast meat samples and Duncan multiple comparison test results are given in Table 1. The mean fat content of conventional and organic thigh meats was found as 7.97% and 7.96%, respectively (P> 0.05). Mean fat content values of conventional and organic breast meats were 1.50% and 2.05%,respectively (P> 0.05). In this case, it was found that organic chicken breast meat had higher fat content than conventional chicken breast meat (P> 0.05). It is thought that this difference occurs depending on the age, type or race of the animals.
Husak [9] did not find a statistically significant difference between organic chicken meat (breast and thigh meat) and conventional chicken meat (breast and thigh meat) (P> 00.05). However, organic chicken meat for both thigh and breast meat were found to be fattier than conventional chicken meat. Similar results were obtained in our study.
Castellini et al. [8] used Ross male broiler as material in their study. As a result of their studies, they found that the fat content of the conventional thigh and breast meats were higher than organic thigh and breast meats (P< 0.01). According to our study, this result is different from thought by Castellini et al. which suggested caused by the race and sex of broilers used as materials.
3.3 Protein content
The protein contents of chicken thigh and breast meat samples and Duncan multiple comparison test results are given in Table 1.The mean protein content of the conventional and organic chicken thigh meats was determined as 18.29% and 19.99% (P> 0.05). The mean of the protein content of conventional and organic breast meats was 22.34% and 22.24% (P> 0.05). In this case, the mean of protein in conventional thigh meat is higher than organic thigh meats (P>0.05). It is also determined that organic and conventional breast meat contain higher protein than thigh meat.
3.4 Ash content
The ash content of chicken thigh and breast meat samples and Duncan multiple comparison test results are given in Table 1.The mean ash content of conventional and organic thigh meats were determined as 1.06% and 1.18%, respectively (P> 0.05). The mean ash content of conventional and organic breast meats were 1.20% and 1.28%, respectively (P< 0.05). In this case, it was observed that the organic chicken breasts examined in the study contain more mineral substances than the chicken breasts of conventional (P< 0.05).
3.5 pH values
The pH values of chicken thigh and breast meat samples and Duncan multiple comparison test results are given in Table 2.The mean pH values of the conventional and organic thigh meats were found to be 6.36 and 6.76, respectively (P< 0.01). Mean values of conventional and organic breast meats were 5.95-6.19, respectively(P< 0.01). In this case, the pH value of organic chicken was higher than that of conventional chicken (P< 0.01).

Table 2pH, cooking loss, water holding capacity values and Duncan multiple comparison test results of chicken thigh and breast meat samples produced by conventional and organic methods.
Husak and Işık [9,15] have reported the higher pH associated with a darker colour, while lower pH associated with lighter colour. In our study, the pH values of organic chicken were higher than conventional chicken meat. In contrast to our study, Castellini et al. [8] found that organic chicken meats had a lower pH than conventional chicken meat.
Similar findings were reported by Husak [9] who found that the pH value of organic chicken meat was statistically higher than conventional chicken meat (P< 0.05).
3.6 Cooking loss
The cooking loss values of chicken thigh and breast meat samples and Duncan multiple comparison test results are given in Table 2.The mean cooking loss values of the conventional and organic thigh meats were 26.94% and 31.14% respectively (P> 0.05). The mean values of cooking loss for conventional and organic breast meats were 26.42% and 28.69% respectively (P< 0.05). Therefore, it was observed that organic chicken breasts had a higher cooking loss than conventional chicken breast meat.
Similar to our study, Castellini et al. [6] found that the cooking loss of organic thigh and breast meat was significantly higher than conventional thigh and breast meat. This statistical difference was found to be significant (P< 0.05) for thigh meat, however very important for breast meat (P< 0.01) [8].
3.7 Water holding capacity
The water holding capacity values of chicken thigh and breast meat samples and Duncan multiple comparison test results are given in Table 2. The mean water holding capacity values of conventional and organic thigh samples were 56.67% and 58.99% respectively(P< 0.05). The mean water holding capacity of conventional and organic breast meat was 54.55%-58.67% respectively (P< 0.05).Therefore, it was concluded that chicken meat produced by organic methods has a higher water holding capacity than chicken meat produced conventionally (P< 0.05).
Improvement in water holding capacity is observed with increasing pH value [12]. In our study, it was found that the pH value and water holding capacity of organic chicken meat were higher than conventional chicken meat.
In contrast to the results obtained in our study, Castellini et al. [8]found that organic chicken meats have lower water holding capacity than conventional chicken meats.
Young et al. [12] has been associated with lower pH values in conventional chicken meat with a lighter colour (higherL*) and lower water holding capacity.
3.8 Colour values
TheL*,a*,b* values of raw and cooked chicken (thigh and breast) meat produced by conventional and organic methods and Duncan multiple comparison test results are given in Table 3.
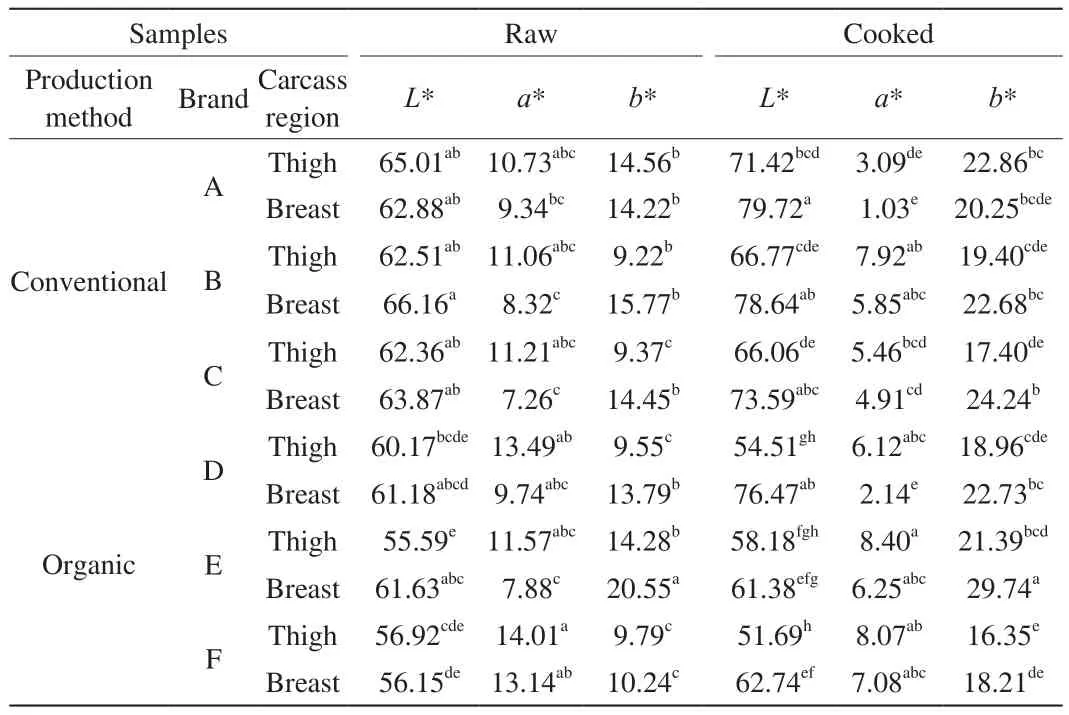
Table 3The L*, a*, b* values of raw and cooked chicken (thigh and breast) meat and Duncan multiple comparison test results.
The meanL* values of the conventional and organic raw thigh meats were 63.29 and 57.56, respectively (P< 0.05). The meanL* values of conventional and organic raw breast meats were 64.30 and 59.65,respectively (P> 0.05). When chicken meat samples were examined in terms ofL* value, it was found that conventional chicken meat had higherL* values (lighter) compared to organic chicken meat.
The meana* values of the conventional and organic raw thigh meats were determined as 11.00 and 13.02, respectively (P> 0.05). Thea*values of conventional and organic raw breast meats were determined as 8.31-10.25, respectively (P> 0.05). In this case, organic chicken meats were redder than conventional chicken meat (P> 0.05).
The meanb* values of conventional and organic raw thigh meats were determined as 11.05 and 11.21, respectively (P> 0.05).The meanb* values of conventional and organic raw breast meats were determined as 14.81-14.86, respectively (P> 0.05). Therefore,organic chicken meat was found to be more yellow than conventional chicken meat (P> 0.05).
Husak [9] found thatb* value of conventional raw thigh and breast meat was higher than organic thigh and breast meat (P< 0.05).This result, which is different from our study, is thought to be due to the differences in genetic characteristics and feed rations of the broilers used by Husak [9] as material.
MeanL* values of conventional and organic cooked thigh meats were determined as 68.08 and 54.79, respectively (P< 0.05). The meanL* values of conventional and organic cooked breast meats were determined as 77.32-66.86, respectively (P< 0.05). In this case, organic chicken meats were darker than conventional chicken meat (P< 0.05).
Meana* values of conventional and organic cooked thigh meats were determined as 5.49 and 7.53, respectively (P> 0.05). The meana* values of conventional and organic cooked breast meats were determined as 3.93-5.16, respectively (P> 0.05). In this case, organic chicken meats were more red than conventional chicken meat (P> 0.05).
Meanb* values of the conventional and organic cooked thigh meats were 19.89 and 18.90, respectively (P> 0.05). The meanb* values of conventional and organic cooked breast meats were 22.39, 23.56,respectively (P> 0.05). Therefore, organic breast meats were found to be more yellow than conventional breast meat. Conventional thigh samples were found to be more yellow than organic thigh (P> 0.05).
3.9 Fatty acid profile
The total saturated fatty acids, total monounsaturated fatty acids,total polyunsaturated fatty acids ratios of the organic and conventional breast and thigh meat samples are shown in Table 4.

Table 4Total saturated, total monounsaturated, total polyunsaturated fatty acids ratios and Duncan multiple comparison test results of chicken thigh and breast meat samples produced by conventional and organic methods.
The ratio of total saturated fatty acids in organic and conventional chicken meat ranges from 32.08% to 42.53%. The mean total saturated fatty acid ratios of conventional and organic thigh meats were found as 33.47% and 39.17%, respectively (P< 0.05). The mean total saturated fatty acid ratios of conventional and organic breast meats were 34.57% and 40.76%, respectively (P< 0.05). In this case,the average rate of total saturated fatty acids in organic chicken meat was higher than in conventional chicken meat (P< 0.05).
Total monounsaturated fatty acids ratio of organic and conventional chicken meat ranges from 24.27% to 32.05%. The mean total monounsaturated fatty acid ratios of conventional and organic thigh meats were 28.37% and 27.94%, respectively (P> 0.05). The mean monounsaturated fatty acid ratios of conventional and organic breast meats were 28.94% and 28.82%, respectively (P> 0.05).
Total polyunsaturated fatty acids ratio of organic and conventional chicken meat ranges from 16.34% to 30.12%. The mean total polyunsaturated fatty acid ratios of conventional and organic thigh meats were found as 26.54% and 20.60%, respectively(P< 0.05). The mean of the total polyunsaturated fatty acid ratio of conventional and organic meats were 26.60% and 24.92%,respectively (P> 0.05). Therefore, the ratio of the mean total polyunsaturated fatty acids of conventional thigh meats was higher than the organic thigh meats (P< 0.05).
3.10 Warner-Bratzler shear force values
Warner-Bratzler shear force mean values and Duncan multiple comparison test results are given in Table 5. The Warner-Bratzler shear force values of the breast and thigh meat samples produced by conventional and organic methods were found between 15.40-38.06 N.The mean of shear force values for conventional and organic thigh meats were determined as 17.07 and 24.46 N, respectively (P< 0.01). The mean of shear force values for conventional and organic breast meats was 27.21 and 30.25 N, respectively (P> 0.05). In this case, organic thigh meat was found to be harder than conventional thigh meat (P< 0.01).

Table 5Warner-Bratzler shear force mean values and Duncan multiple comparison test results of chicken thigh and breast meat samples produced by conventional and organic methods.
When the cutting age of chickens increases, it is known that most of the collagen is cross-linked. In this case, chicken meat is getting a harder structure. For this reason, it is thought that the shear force values of organic chicken meat are high in our study.
3.11 Microbiological analyses
The results of the total aerobic mesophilic bacteria, total coliform bacteria, yeast-mold counts and the Duncan multiple comparison test results of the organic and conventional chicken (breast and thigh)meats are given in Table 6.

Table 6The results of the total aerobic mesophilic bacteria, total coliform bacteria, yeast-mold counts and the Duncan multiple comparison test results of chicken thigh and breast meat samples produced by conventional and organic methods.
3.12 Total aerobic mesophilic bacteria
The mean total aerobic mesophilic bacteria count for conventional and organic chicken thigh meats were 6.60 and 6.98 (lg (CFU/g)),respectively (P> 0.05). The mean total number of aerobic mesophilic bacteria in conventional and organic chicken breast meats were determined as 6.56 and 7.13 (lg (CFU/g)) respectively (P> 0.05). It was found that organic chicken breast and thigh meat had more total aerobic mesophilic bacteria than conventional chicken breast and thigh meat (P> 0.05).
3.13 Total coliform bacteria
The mean total coliform bacteria count for conventional and organic thigh meats were 3.58 and 3.78 (lg (CFU/g)), respectively(P< 0.05). The mean total number of coliform bacteria in conventional and organic breast meats were 4.18 and 4.15 (lg (CFU/g)),respectively (P> 0.05).
3.14 Salmonella spp.
In our study,Salmonellaspp. were positive in 100% of conventional chicken meats and 66.66% of organic chicken meats in Table 7.

Table 7Contamination with Salmonella spp. in organically and conventionally produced chicken samples.
3.15 Yeast-mold
The mean number of yeast-molds of conventional and organic chicken thigh meats were determined as 5.43 and 5.34 (lg (CFU/g)),respectively (P> 0.05). The mean number of yeast-molds of conventional and organic chicken breast meats was 5.46 and 6.08 (lg (CFU/g)) respectively (P< 0.05).
3.16 Sensory evaluation
The results of sensory evaluation of the samples are shown in Table 8. The mean appearance values of conventional and organic thigh meat were determined as 3.74 and 3.53, respectively (P>0.05). The appearance means values of conventional and organic breast meats were 4.48 and 4.23, respectively (P> 0.05). In this case, the appearance of conventionally grown chicken meat was more appreciated by panellists compared to the appearance of organically grown chicken meat (P> 0.05). It was determined that the carcass area affected statistically significant (P< 0.01).When the appearance values of two different carcass regions were examined, it was found that the breast meat had higher scores than the thigh meat in all samples.
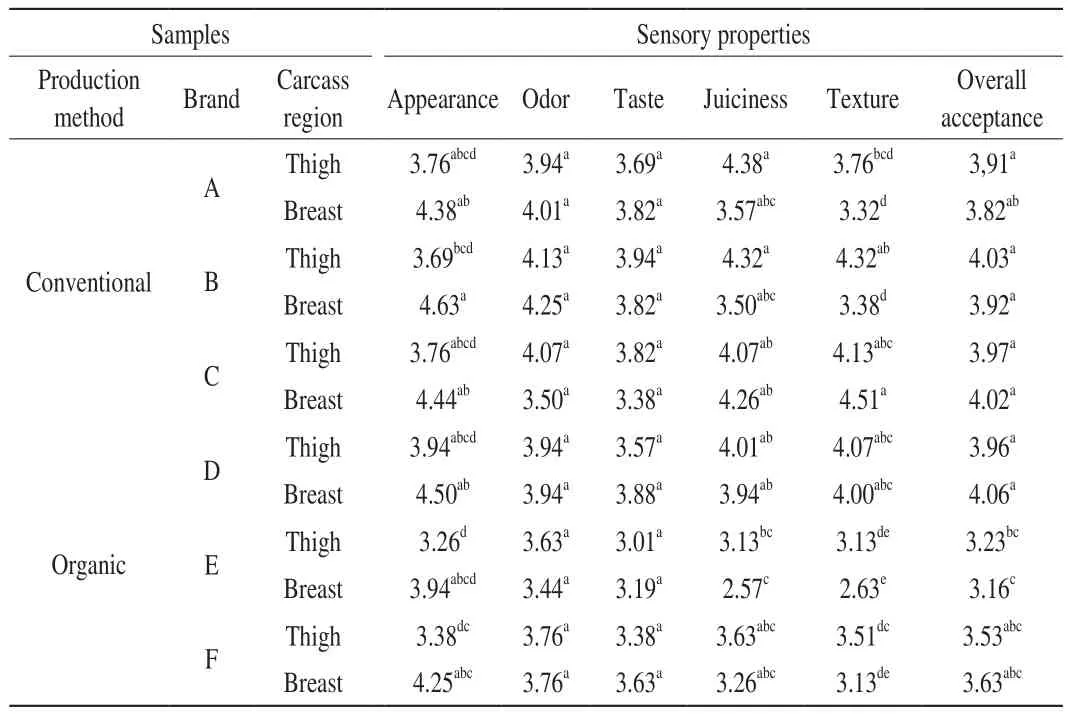
Table 8The results of sensory evaluation of chicken thigh and breast meat samples produced by conventional and organic methods and Duncan multiple comparison test results.
The mean odor values of the chicken meats were found between 3.44 and 4.25. The mean odor values of conventional and organic thigh meats were 4.05 and 3.78, respectively (P> 0.05). The mean odor values of conventional and organic breast meats were 4.05 and 3.78, respectively (P> 0.05). When the mean odor values were examined, it was found that the thigh meat had higher odor scores than the breast meat. Thigh meats are oilier than breast meats and the odorant volatile components are localized in the oil and maybe the reason for the preference of meat in terms of odor [11].
The mean taste values of the chicken meats were found between 3.01 and 3.94. The mean taste values of conventional and organic breast meats were 3.67 and 3.57, respectively (P> 0.05).In this case, chicken meat, which was grown by the conventional method, was found to be more delicious than organically grown chicken meat (P> 0.05).
The mean juiciness values of the chicken meats were found between 2.57 and 4.38. The mean juiciness values of the conventional and organic thigh meats were 4.26 and 3.59, respectively (P> 0.05). The mean juiciness values of conventional and organic breast meats were 3.78 and 3.26, respectively (P> 0.05). When the mean juiciness values were examined, the mean juiciness values of conventional breast and thigh meats were higher than organic breast and thigh meat (P> 0.05).
In contrast to this study, Castellini et al. [8] found that the juiciness and overall acceptance of organic breast meat were higher than conventional breast meat (P< 0.05).
The mean tenderness values of the chicken meats were found between 2.63 and 4.51. The mean tenderness values of the conventional and organic thigh meats were 4.07 and 3.57, respectively(P> 0.05). The mean tenderness values of conventional and organic breast meats were 3.74 and 3.25, respectively (P> 0.05). When the results were examined, it was found that chicken meat grown by the conventional method was tenderer than chicken meat grown with the organic method (P> 0.05).
Overall acceptance scores of chicken meat samples were found between 3.16 and 4.06. The mean overall acceptance scores of conventional and organic thigh samples were determined as 3.97 and 3.57, respectively (P> 0.05). The mean overall acceptance values of conventional and organic breast meat were determined as 3.74 and 3.25, respectively (P> 0.05).
In this study, it was found that conventional chicken meat was more preferred than organic chicken meat. In contrast, Napolitano et al. [16] determined that consumers gave higher expected liking scores for organic than for conventional products (P< 0.001).
Grashorn and Serini [17] found that organic chicken meats were juicier and more delicious than conventional chicken meats. However,they found that conventional chicken meat was tenderer than organic chicken meat. These researchers attributed the low scores of organic chicken meat to sensory evaluation by the panellists not accustomed to the consumption of organic chicken meat.
4. Conclusion
It has been concluded that organic chicken meat is more nutritious and healthier because of the protein content of the thigh region, the fat and mineral content of the breast region, and the docosahexaenoic acids,α-linolenic acids and omega-3 fatty acids. It is considered that it is safer than conventional chicken meat because of its presence at a lesser rate ofSalmonellaspp. It is concluded that organic poultry farming is an alternative production method for conventional chicken breeding because of its advantages such as human health, animal welfare and environmental friendliness.
The objective of this study was to investigate the quality characteristics of organic chicken meat that has grown in Turkey and has also put forward the resulting differences compared to conventional chicken meat. As a result of the literature research in Turkey, it was observed that the experimental studies inadequate on the quality of chicken meat grown with organic methods. With this study, it is thought that this issue will be remarkable. Since consumers have inaccurate or inadequate information about the production of organic poultry meat, it is aimed to provide a new source to inform the consumers in experimental terms. It is thought that our study will prepare the groundwork for further studies in this field.
Conflicts of Interests
None.
Acknowledgements
This work was supported by Manisa Celal Bayar University Research Project Funds, Turkey under Grant Project number 2017-186.

- 食品科学与人类健康(英文)的其它文章
- Bioactive compounds and probiotics-a ray of hope in COVID-19 management
- Approaches to evaluate nutrition of minerals in food
- The role of glutamine in supporting gut health and neuropsychiatric factors
- Anti-hyperglycemic effects of dihydromyricetin in streptozotocin-induced diabetic rats
- Aroma profile of two commercial truffle species from Yunnan and Sichuan, China:inter- and intraspecific variability and shared key compounds
- Stability of phenolic compounds and drying characteristics of apple peel as affected by three drying treatments