Microanalysis of supersaturated gas release based on wall-attached bubbles
Lu Lin ,Rn Li ,Jing-jie Feng ,,Ying-hn Hung ,Xio-ong Yong ,Yng-ming Ou ,You-qun Yun
a State Key Laboratory of Hydraulics and Mountain River Engineering,Sichuan University,Chengdu 610065,China
b Power China Zhongnan Engineering Corporation Limited,Changsha 410014,China
c Sichuan Qingyuan Engineering Consulting Co.,Ltd.,Chengdu 610072,China
d College of Architecture and Civil Engineering,Chengdu University,Chengdu 610106,China
Abstract Supersaturation of dissolved gases in natural water,due to spillage from high dams and other factors,may cause fish mortality.In previous experiments,the dissipation coefficient has been used to denote the degassing process of total dissolved gas(TDG)saturation.These experiments mainly analyzed supersaturated TDG dissipation from a macroscopic view.To precisely clarify the mechanism of supersaturated TDG release,this study investigated bubble adsorption at a wall surface from a microscopic view.The experiment was conducted in a Plexiglas-wall container filled with supersaturated TDG water.A model that calculates the adsorption flux of supersaturated TDG by a solid wall,and helps describe construction for a contact angle at a three-phase intersection,was developed according to Young"s equation.This model was used to investigate the formation process of bubbles adsorbed on a solid polymethyl methacrylate(PMMA)surface in supersaturated TDG water.The adsorption effect of a solid wall on TDG release was analyzed based on the experimental data.The modeling results were compared with observations under different wall area conditions,and it was found that TDG release tended to increase with wall area.This study helps improve our understanding of the mechanisms of supersaturated TDG release and provides an important theoretical method for accurate calculation of the release process.The adsorption flux model of the solid wall provides mitigation measures to combat the adverse effects of TDG supersaturation,which will be beneficial to the protection of aquatic organisms in hydropower-regulated rivers.© 2021 Hohai University.Production and hosting by Elsevier B.V.This is an open access article under the CC BY-NC-ND license(http://creativecommons.org/licenses/by-nc-nd/4.0/).
Keywords:Supersaturation;Total dissolved gas;Wall-attached bubbles;Release;Calculation model
1.Introduction
When a dam discharges water,a large amount of air is entrained into the water,and total dissolved gas(TDG)supersaturation occurs at a very high pressure in the plunge pool(Li et al.,2009).In practical engineering applications,vegetation can become a solid medium that adsorbs supersaturated TDG in water and impacts the flow velocity distribution(Anjum and Tanaka,2019;Pu et al.,2019).Ou et al.(2016)found that aeration in water could also effectively accelerate the dissipation of supersaturated TDG.Feng et al.(2012)reported that the release coefficient of TDG was positively correlated with sediment concentration in supersaturated sediment-laden water.Niu et al.(2015)found that the release rate of supersaturated TDG increased with the quantity of activated carbon in water.The process of the gas phase fraction separating in bubble form and the characteristic parameters that affect bubble shape play key roles in mass transfer between water and air.In comparison with previous studies that mainly focused on analyzing supersaturated TDG release from a macroscopic view,this study aimed to explore the effect of the wall surface on bubble separation from a microscopic view.
Gas accumulation and nucleation in water is the initial formation stage of a new phase in two-phase fluid systems.Brennen(1995)suggested that there were two major types of nucleation,and that two types of weak points existed in any practical tests or applications.In practical engineering,weak points generally occur at the boundary between liquid and solid container walls or suspended particles.The classical nucleation theory(CNT)is the earliest theory and has been validated by experimental data(Ward et al.,1970;Laaksonen et al.,1995).Nˇemec(2016)used the improved CNT to better predict bubble nucleation.Schenter et al.(1999)proposed the dynamic nucleation theory(DNT).Reguera and Reiss(2004)used DNT to predict the free energy of critical nucleation and calculated nucleation rates in different systems.Talanquer et al.(2001)first applied the density functional theory(DFT)to the homogeneous nucleation of bubbles in binary systems.Subsequently,the mean-field kinetic nucleation theory was proposed by Kalikmanov(2006).Zhou(2013)constructed a density functional theory model for mixed fluids based on DFT and explained the conditions for spontaneous bubble nucleation.
Gas dissolved in water tends to separate as bubbles on solid walls and escape because of the hydrophobicity of solid surface.At present,research on bubble nucleation and growth on solid surfaces focuses on analyzing the factors that affect the bubble growth,the growth morphology of bubbles attached to the wall,and the rules governing escape and separation of bubbles from the solid surface.Grinin et al.(2009)concluded that the factors affecting bubble growth in gas-liquid mixture systems included temperature,pressure,and dissolved gas concentration.Ou et al.(2016)found that the release process of supersaturated TDG in quiescent water was extremely slow,taking approximately 100 h for the amount of TDG to decrease from 140% to 120%.Aeration can significantly increase the release rate of supersaturated TDG,and the quantitative relationship between the release coefficient of supersaturated TDG and the aeration conditions has been obtained through theoretical analysis.Young"s equation(Adam,1957)indicates that the contact angle of a gas-liquid-solid three-phase interface is determined by the surface tension of each two-phase interface.Chen and Qiu(2015)inferred the presence of bubbles in two different hydrophilic media based on Young"s equation through experimental analysis and found that the bubbles formed between the surfaces of two different hydrophilic media tend to move from the hydrophilic surface to the hydrophobic surface.Li et al.(2016)conducted an experiment on a superheated super hydrophobic surface to study the formation and escape of a single bubble on the vessel wall.They improved the prediction equation of the bubble escape diameter and frequency in Zuber(1963)and obtained the relationships between surface tension,liquid density,and the equilibrium of the bubble diameter.
Previous studies on TDG release were mainly based on TDG concentration measurements.However,bubble nucleation on micro scales was not considered.Due to the lack of understanding of the release mechanism,the release coefficient has been used to generalize the TDG saturation change process,which may lead to certain errors.Therefore,the accuracy of prediction models has not been sufficiently reliable for practical applications.In natural water,the release process of supersaturated TDG is controlled by the gradual growth and release of bubbles after nucleation.To clarify the release mechanisms of supersaturated TDG,it is necessary to study the bubble formation from a microscopic view.
In order to supplement microscopic studies on TDG release,this study developed a calculation model of supersaturated TDG adsorption flux on a wall based on the statistics of bubble information.An experiment was designed to examine the adsorption of bubbles on the surface of containers caused by supersaturated TDG.The digital image processing method was used to extract useful information from bubble images to calculate the growth rate of bubbles on the wall.On this basis,the relationship between the release process of supersaturated TDG and wall surface properties was deduced.We hope that the proposed model has the potential to accurately calculate the TDG release process.The findings of this study are expected to provide an important tool and a theoretical basis for study of mitigation measures for supersaturated TDG,such as promoting supersaturated TDG release by wall media.
2.Methodology
The dissipation of supersaturated TDG in water should be generalized into the following three components:bubble-liquid mass transfer,air-water surface mass transfer,and wall adsorption.The submerged vegetation in the river can provide many walls to adsorb supersaturated TDG and subsequently accelerate the dissipation of supersaturated TDG.Yuan et al.(2018)proposed a supersaturated TDG dissipation model that describes the adsorption of TDG by the vegetation wall from a macroscopic perspective.In this study,an experiment was conducted to observe bubble adsorption on a wall.The purposes of this experiment were to obtain clear images of bubble growth and release in supersaturated TDG water for digital processing and to estimate the parameters that satisfy the accuracy requirements of model calculation.This section mainly describes the experimental device,method,and conditions.
2.1.Experimental device and method
The experiment was conducted in the State Key Laboratory of Hydraulics and Mountain River Development and Protection,at Sichuan University in China.The experimental device included rectangular polymethyl methacrylate(PMMA)tanks with a length of 25 cm,a width of 25 cm,and a height of 40 cm.The experimental device is shown in Fig.1.To obtain clear images during the experiment,the experimental water tank was set against a black background,a light-emitting diode lamp that was uniformly distributed above the water tank was used as the light source,and a camera was fixed in front of the water tank.The initial TDG saturation was 164%,and water temperature in the experimental tank was 22.5°C throughout the experimental process.
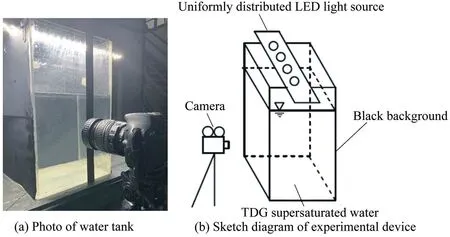
Fig.1.Experimental device setup.
The bubble development and escape process on the front wall of the water tank was tracked and photographed by a digital camera.The photographic equipment consisted of a Canon 600D digital camera with 17-85 lenses(Taiwan),a polarizer,and close-up lens for taking close-up pictures.According to the first-order kinetics reaction(Pickett et al.,2004),the distribution of TDG concentration in the water can be considered uniform on a laboratory scale,and no spatial difference exists in the release process.The experimental flume used homogeneous PMMA as the wall medium for bubble adsorption to ensure a uniform bubble nucleation density on the container surface.The TDG saturation level in the water was measured by a total dissolved gas pressure(TGP)detector composed of Pentair Point Four TGP portable trackers(California,in the United States)with a TGP measuring range of 0-200%and an accuracy of 2%.The TGP detector can measure water temperature over a range of 0-40°C with an accuracy of 2.5%.The bubble size was measured by a steel ruler and calibrated by pixels in image processing.The steel ruler has a measuring range of 0-50 cm with a precision of 0.2%.
2.2.Experimental conditions
The experiment was performed under atmospheric pressure.Supersaturated TDG water was provided by the supersaturated TDG generation system developed by Sichuan University,in China(Li et al.,2010),where the generated maximum supersaturated TDG level was 170%.The initial TDG saturation in the water tank was 164%,and water temperature in the experimental tanks was maintained at 22.5°C throughout the experimental process.
3.Results and discussion
3.1.Microscopic analysis of growth process of wall-attached bubbles
To conduct a quantitative bubble analysis,this study obtained bubble images and analyzed the bubble shape in the water tank with supersaturated water.The bubble pictures were taken at one-minute intervals,and the pictures were analyzed via image processing to investigate the bubble growth process.The actual bubble volume was deduced by estimating the bubble area.It was helpful to quantitatively analyze the effect of wall adsorption on supersaturated TDG release from a microscopic point of view.
3.1.1.Image source and pixel calibration
In image processing,image size is expressed in pixels,and it is necessary to calibrate the image pixels to restore the actual bubble size.In this study,the Microsoft drawing tool was used to determine the image pixels of bubble images,with 1 mm being equal to 74 pixels in the images.Fig.2 shows the growth,coalescence,escape,and re-adsorption of bubbles.From 0 to 60 min,bubbles no.1,2,3,and 4 grew and then escaped from the wall.At the locations where these bubbles departed,new bubbles no.10,11,7,and 8 were adopted and gradually enlarged.From 15 to 40 min,bubbles no.5 and 6 coalesced into one large bubble no.9.Fig.3 shows the bubble diameters at different departure times.The departure time of bubbles was mainly concentrated in the range of 35-55 min,and the bubble diameters at departure were 0.8-1.2 mm.From the initial stage to 20 min,a small number of bubbles escaped,owing to the water turbulence at the beginning of the experiment.
3.1.2.Binary image-filling processing

Fig.2.Growth,coalescence,escape,and re-adsorption of bubbles.
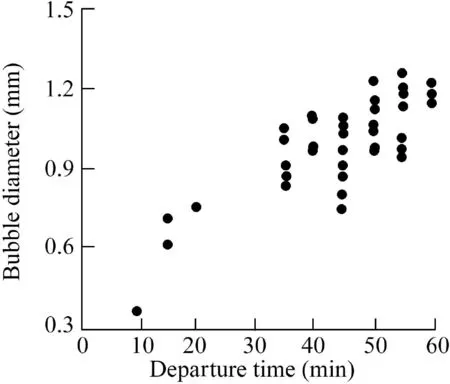
Fig.3.Statistics of bubble departure time and bubble diameters.
In this study,the Matrix Laboratory(MATLAB)digital image processing software was used to process and analyze the experimental images for bubble growth rate.Image binarization can distinctly separate the bubble area from the background area.In the MATLAB programming language,“0”and“1”are used to represent black and white pixels,respectively.Because of this feature,it is convenient to use MATLAB to obtain statistics of bubble number and size.In this study,the Otsu method was used to extract the image boundaries and fill the bubble gaps(Gonzalez and Woods,2007).Fig.4 displays the processing effect in Fig.2(b)as an example.It shows that the digital image processing technique clearly reveals the real bubble size,which helps to calculate bubble area statistics.
3.1.3.Bubble information statistics
The bubbles were numbered,and the area of each separated and connected white region was measured by MATLAB.After the binary image-filling processing,the statistics of wallattached bubble areas were obtained.Table 1 shows that the bubble area followed a normal distribution.80% of the bubbles had an area of 0.30-0.38 mm2.By contrast,bubbles with areas smaller than 0.30 mm2or larger than 0.38 mm2accounted for 20% of the total bubbles.
3.2.Bubble volume calculation
The shape of the bubble adsorbed on a solid wall is not a complete sphere because water,gas,and solids form certain angles at the contact point(Adamson,1990).To accurately calculate the actual bubble volume,the adsorption morphology of bubbles was studied by deriving the bubble volume equation on the adsorption area from digital image processing.
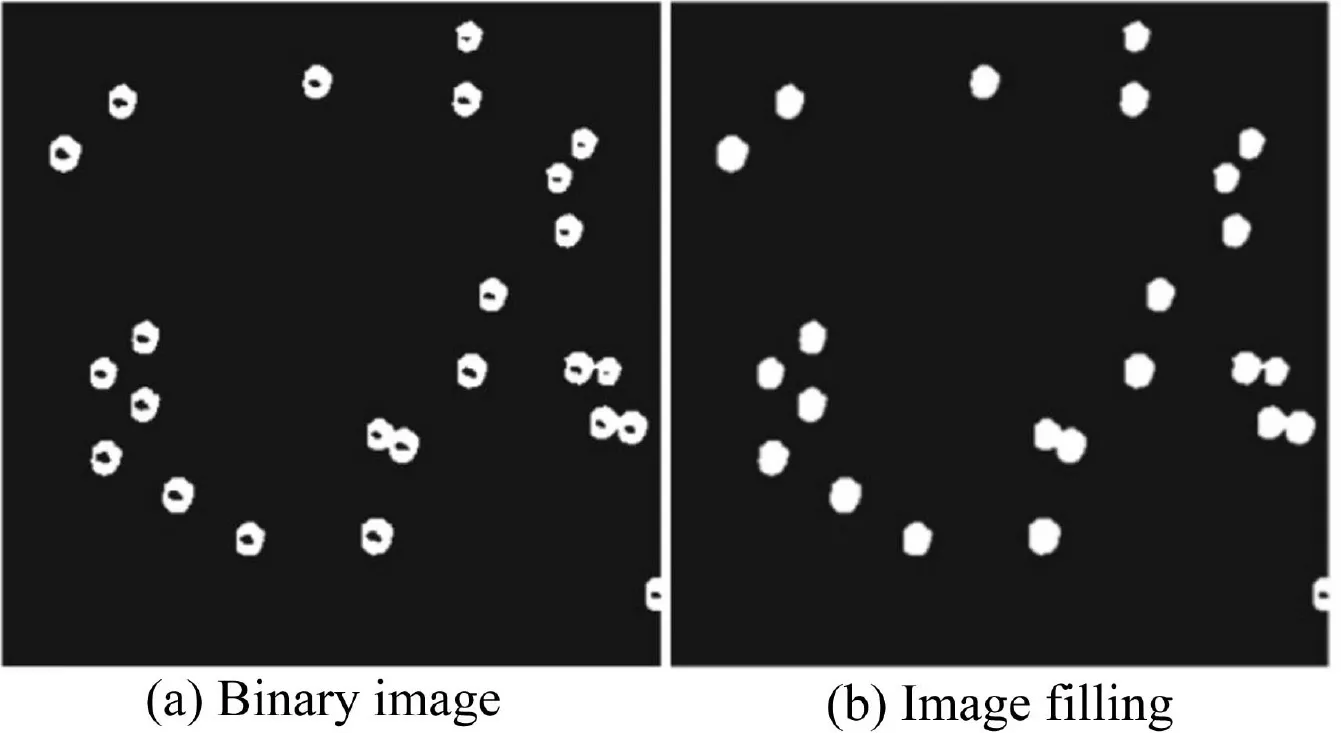
Fig.4.Image-filling effect.
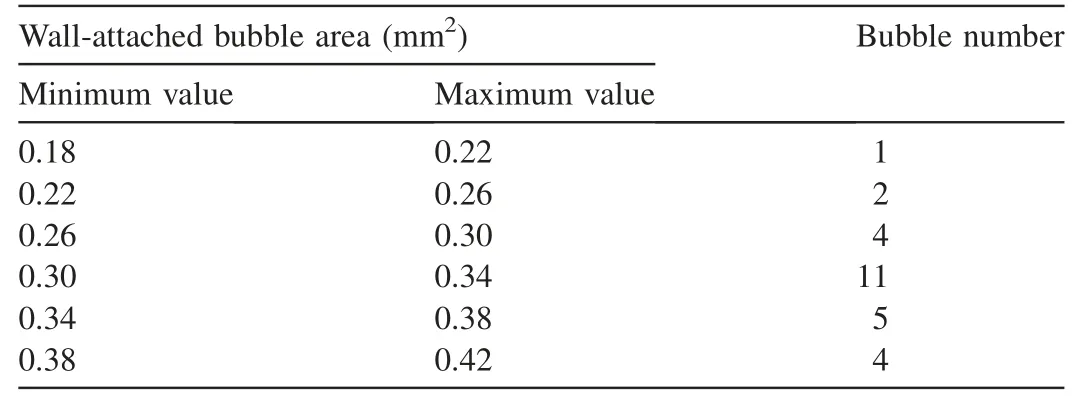
Table 1Bubble area statistics.
Young"s equation notes that the contact angle of an adsorbed wall(θ)depends on the interface properties of the solid wall in a three-phase system in a stable state,as follows:

whereγls,γvs,andγvlrepresent the free energy states of liquid-gas,solid-gas,and solid-liquid interfaces,respectively.The free energy is determined by the surface tension of different phase fluids.For the supersaturation of TDG in natural rivers,the contact angle between the adsorbed bubbles and a solid wall is mainly determined by the surface characteristics of the solid wall.
According to the experimental PMMA wall material,image information regarding the bubble shape and contact angle was obtained.Fig.5 shows that the wall-attached bubbles were spherical in shape and always had the same contact angle with the adsorbed wall.Therefore,the bubble volume is expressed as follows:

whereViis the bubble volume(m3),Riis the bubble circular radius(m),and the subscriptidenotes the serial number of a single bubble.The projected bubble areaAi(m2)is calculated as follows:

Kis used to denote the parameter related to the bubble contact angle,which is expressed as follows:

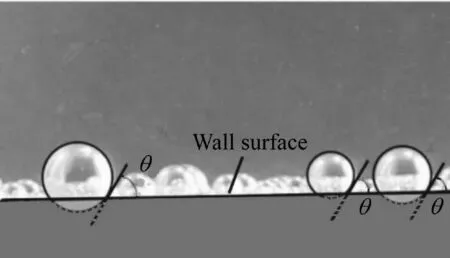
Fig.5.Diagram of contact angle between bubbles and wall.
By substituting Eqs.(3)and(4)into Eq.(2),the relationship between the volume of a single bubble and the circular area of the corresponding adsorption surface is obtained:

3.3.Mathematical expression of adsorption flux model
Here,the adsorption flux of supersaturated TDG per unit area of solid wall is defined asFw(mg/(L˙m2˙min)).Previously,Fwwas calculated by measuring the concentration change in TDG in supersaturated water under different solid wall surface area conditions.The adsorption flux on the solid wall is equal to the sum of bubble mass adsorbed on the wall per unit time and wall area,which is expressed as follows:

whereρis the air density(mg/L),Vgis the total bubble volume(m3),awis the wall surface area(m2),Vlis the water volume(m3),andΔtis the bubble precipitation time(min).Eq.(6)shows that the required variables for adsorption flux calculation areVg,aw,Vl,andΔt.ρis a parameter affected by temperature.The Young"s equation theory is used to calculate the actual volume of bubbles to satisfy the requirements of model calculation,and the total bubble volume is expressed as follows:

whereais the wall surface area in the image(m2),andndenotes the number of bubbles.In Eq.(7),the sampling inference method was used to calculate the bubble volume,and the total bubble amount on the contact surface was estimated according to the bubble information in the images.
By substituting Eqs.(5)and(7)into Eq.(6),the wall adsorption flux model can be expressed as follows:

This wall adsorption flux model for supersaturated TDG can be used to calculate the wall adsorption flux under other conditions.
3.4.Verification of wall adsorption flux model for supersaturated TDG
Yuan et al.(2018)conducted bubble adsorption experiments using PMMA sheets as the solid wall adsorption media.Four experimental cases were established,including a blank group.In this study,the reliability of the proposed wall adsorption flux model was validated with the experimental results of Yuan et al.(2018).
According to the findings of Brennen(1995),in the case of θ>π/2 at the liquid/solid/gas interface,the solid wall surface is hydrophobic,and in the case ofθ<π/2,the solid wall surface is hydrophilic.In our experiment,the angle between the bubbles and the wall was 58°.Therefore,the PMMA sheets can be considered hydrophilic.
From the initial stage to 15 min,there was no escape or coalescence of micro bubbles on the wall(Fig.2(a)and(b)).After comparing the two images,the bubble growth speed in this period was calculated.However,bubble nuclei were formed at the initial stage.According to the comparison of bubble diameters at the initial stage and 15 min,the dimension difference between the bubble diameters was approximately ten-fold.This implied that the difference in bubble volume was approximately 1 000-fold.Therefore,the volume of the microbubbles at the initial stage was neglected,and the total bubble volume growth at 15 min was represented by the statistical results shown in Table 1.According to Eq.(6),the total bubble volume in the experimental image was 4.37 mm3.Based on the pixel calibration of experimental images,the wall area was 2.1 cm2.
The air density at 22°C was 1.197 kg/m3.By introducing the known conditions into Eq.(8),the gas adsorption flux on the PMMA surface under the experimental conditions was calculated.IfFwis multiplied by the total area of solid wall in contact with water,the total amount of TDG adsorbed on the solid wall surface under any condition can be calculated.These results are shown in Table 2.
Fig.6 demonstrates that the modeling results are basically consistent with the findings of Yuan et al.(2018)under different wall area conditions.The calculated TDG release rose with the increase of wall area,and the total TDG release linearly increased with the rise of the wall area.According to the definition of the adsorption flux of supersaturated TDG,the total amount of TDG adsorbed on the wall surface should be zero in the case of zero wall surface.Therefore,the intercept of the fitting line of the model calculation value in Fig.6 should be 0.However,the experimental results of Yuan et al.(2018)had a positive intercept.This demonstrated that the error between the modeled results and the experimental observations in the experiment of Yuan et al.(2018)ignored the TDG adsorption flux on the side surface of the PMMA sheet.Meanwhile,the relative error might result from the calculation method of TDG adsorption using the experimental measurements,for example,the differences of TDG transfer in the gas-liquid interphase in the macroscopic measurement.In this study,an image source was usedto calculate the bubble volume and growth rate.However,it was difficult to completely record the departure information of bubbles,thereby resulting in certain errors in the calculated TDG release value.
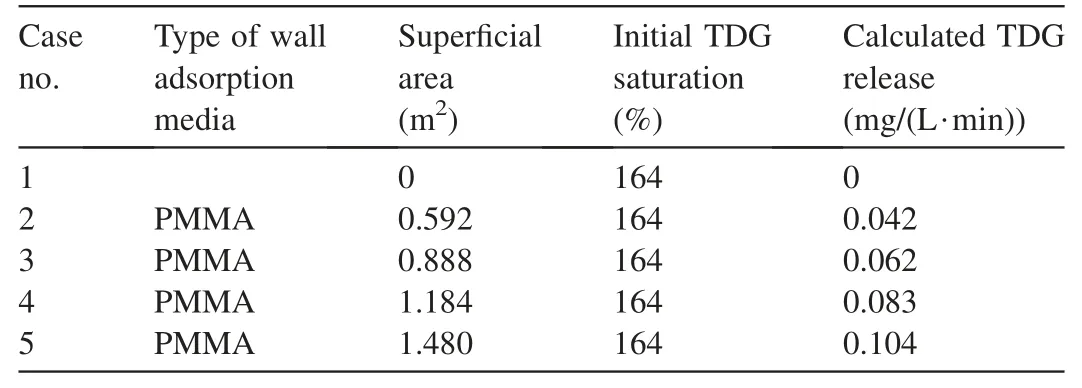
Table 2Model calculation values of TDG release.
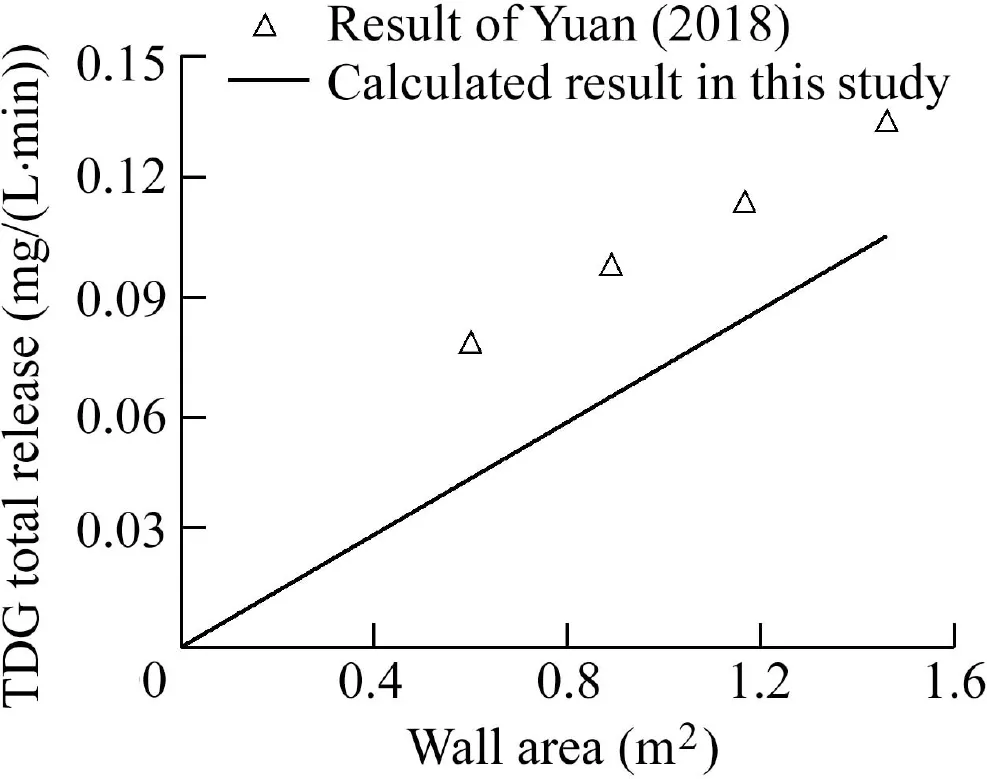
Fig.6.Verification of adsorption flux model.
3.5.Discussion
According to Eq.(8),the parameterKis related to the properties of the wall andρis the density of air,which is controlled by temperature.Therefore,the adsorption flux of supersaturated TDG on the wall is determined by the properties of the solid wall and is also affected by temperature.When water temperature in the experimental tank and wall properties are defined to be identical to the specific conditions of the experiment in Yuan et al.(2018),the proposed model can accurately quantify the TDG release on the wall from a microscopic viewpoint.This approach has the potential to provide important methodological tools and a theoretical basis for study of the release mechanism of supersaturated TDG and use of the wall media to promote the release of supersaturated TDG.
4.Conclusions
In this study,a model was developed to analyze the adsorption effect of a solid wall on TDG release.The quantitative relationship between the supersaturated TDG adsorption flux and the bubble image information was also established.This study can help improve our understanding of the release mechanisms of supersaturated TDG and provide an important theoretical method for accurate calculation of the release process.The adsorption flux model for the solid wall provides mitigation measures to combat the adverse effects of supersaturated TDG and is highly significant to the protection of aquatic organisms in hydropower-developed rivers.
The supersaturated gas release model established in this study achieved satisfactory results in comparison with the experimental results in stationary water.However,in complex natural rivers,water flow is affected by topographical distribution,and solid media in water vary greatly.Therefore,the application of this model will also be analyzed from the perspectives of solid wall materials and surface roughness.In addition,water flow will be investigated to establish a universal model to simulate the adsorption and release of supersaturated TDG on solid walls.The proposed model solves the TDG adsorption flux measurement problem through complex experiments and provides an important method to better identify the supersaturated TDG adsorption carriers.
Declaration of competing interest
The authors declare no conflicts of interest.
 Water Science and Engineering2021年1期
- Water Science and Engineering的其它文章
- Drought variability and its connection with large-scale atmospheric circulations in Haihe River Basin
- Impacts of climate change on water quantity,water salinity,food security,and socioeconomy in Egypt
- Simulation of maize drought degree in Xi"an City based on cusp catastrophe model
- Diffusion analysis and modeling of kinetic behavior for treatment of brine water using electrodialysis process
- Ultrafiltration for environmental safety in shellfish production:A case of bloom emergence
- Deformation early-warning index for heightened gravity dam during impoundment period
