Research on Novel Green-emitting La0.83MgGa10.95O19:A (A=Mn2+ or Mn2+,Zn2+) Phosphors
2021-03-02 14:46:36JiaJunjiao
中阿科技论坛(中英文) 2021年1期
Jia Junjiao
(Feixian Technology Market Service Center,Linyi 273400)
Abstract:In order to further promote applications of phosphors in fluorescent lamps and field emission displays (FEDs),a novel green phosphor,La0.83MgGa10.95O19:Mn2+was synthesized by high-temperature solid-state reaction.Study X-Ray powder diffraction (XRD),photoluminescence (PL),cathodoluminescence (CL) spectroscopy to characterize the synthesized phosphors.The PL spectrum exhibits green emission centered at 508 nm under ultraviolet excitation (278 nm),which can be assigned to the 6A1-4T1 transition of Mn2+ ions.Under low-voltage electron beams excitation,emission center of phosphor exhibits no shift,and emission intensity of La0.83MgGa10.95O19:0.025Mn2+phosphor is enhanced by codoping Mn2+ and Zn2+.
Key words:La0.83MgGa10.95O19; Mn; High-temperature solid-state; Luminescence properties
1 Introduction
Over the last few decades,extensive researches have been concentrated on rare earth and transition metal ions activated by gallate phosphors,as they are widely used in a variety of fields,such as FEDs,vacuum fluorescent display,plasma display panels(PDPs),and electroluminescent devices (ELDs).Moreover,Ga-rich compounds have attracted considerable attention for applications as sensors.For example,LaSrGa3O7is of interest as an optical material for solid state laser applications.Furthermore,the Er3+-doped Gd3Ga5O12 nanopowder obtained by co-precipitation method shows efficient up-conversion in the green region (around 550 nm) upon excitation at a wavelength of 800 nm[1]and LaGaO3:A (A=Sm3+and/or Tb3+) are proven to be promising phosphors for field emission displays.[2]MgGa2O4alloyed with different elements is also of technical interest due to its optical electronic properties.
The spectra of the Mn2+ions incorporated as an activator in various host materials have been well studied in the visible (green/red) region.[3-5]Mn2+is an excellent activator for yellow (ZnS),green(ZnGa2O4and LaMgGa11O19) and red (ZnMgS) phosphors.[6]FEDs have recently gained much attention as they are considered to be the next generation flat-panel displays and exhibit the potential of achieving comparable or superior levels of performance to the conventional cathode ray tubes (CRTs).Under low-voltage electron beams excitation,Zn2SiO4:Mn2+samples show the green emission is at 524 nm.[7]The synthesized La0.83MgGa10.95O19as a novel green-emitting host for ultraviolet (UV) phosphor,has potential applications in FEDs and fluorescent lamps.
2 Experiment
Powder samples of La0.83MgGa10.95O19:Mn2+were prepared by a conventional solid-state reaction.The starting materials were La2O3(A.R.),MgO (A.R.),Ga2O3(A.R.),ZnO (A.R.) and MnCO3(A.R.).They were homogenized by an agate mortar and placed in a crucible with a lid.The mixture was fired at 1 400 ℃ for 2 h in ambient air conditions.After firing,the obtained powders were ground and then reheated at 1050 oC for 2 h in CO reducing atmosphere.
XRD measurements were carried out on a D8 Focus diffractometer (Bruker) using Cu Ka radiation (λ=0.154 05 nm).The PL measurements were performed on a Hitachi F-4500 spectrophotometer equipped with a 150 W xenon lamp as the excitation source.
The CL measurements were carried out in an ultra-high vacuum chamber (1028 Torr),where the phosphors were excited by an electron beam in the voltage range of 2.0-5.0 kV,and the emission spectra were recorded using an F-4500 spectrophotometer.All the measurements were conducted at room temperature.
3 Results and Discussion
Phase Identification.Figure 1 shows the XRD patterns of the asprepared pure and doping 2.5 mol% Mn2+and codoping 2.5 mol%Mn2+and 5 mol% Zn2+La0.83MgGa10.95O19phosphers,the peaks of all of the samples are consistent with the literature data (JCPDS No.84-0889).No second phase is detected in the XRD patterns,revealing that the Mn2+,and Zn2+,Mn2+ions have been effectively doped into the host lattices of the La0.83MgGa10.95O19.When temperature is below 1300 ℃,impurities of MgGa2O4(JCPDS:73-1721),Ga2O3(JCPDS:76-0573) and LaGaO3(JCPDS:83-0566) appear.
According to the ionic radius and the charge balance rule,the radius of Zn2+ion (0.074 nm) and Mn2+ion (0.080 nm) are expected to occupy the Mg2+ion (0.066 nm) sites in the La0.83MgGa10.95O19host lattice.So,we expect Zn2+ion to increase the luminescence intensity of La0.83MgGa10.95O19:0.025Mn2+.
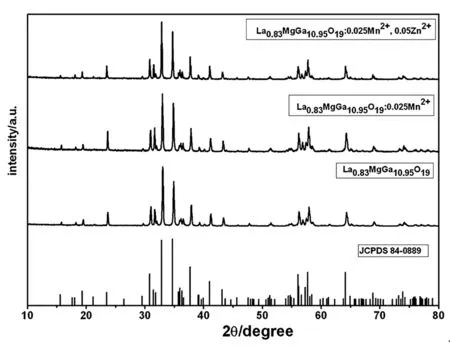
Figure1 XRD patterns of the as-prepared La0.83MgGa10.95O19,La0.83MgGa10.95O19:0.025Mn2+,La0.83MgGa10.95O19:0.025Mn2+,0.05Zn2+ samples and the standard data of La0.83MgGa10.95O19 (JCPDS No.84-0889) as a reference.
Luminescence Properties.Figure 2 shows the diffuse reflectance spectra of the La0.83MgGa10.95O19and La0.83MgGa10.95O19:0.025Mn2+.Both pure and Mn-doped La0.83MgGa10.95O19samples show strong absorption in the UV range around 300 nm with an estimated band gap at about 240 nm,which also has been served in the diffuse reflection spectra of La0.83MgGa10.95O19,corresponding to host-lattice absorption.In the Mn-doped samples,there is a weak absorption band in the wavelength range from 260 to 350 nm,which can be attributed to the transitions from the ground state A1 (S) of Mn2+to its excited state T1 (G).Because the d-d transitions of Mn2+ions are spin and parity forbidden,the absorption band of Mn2+in the wavelength range of 260-350 nm in the host lattice is a little weak,which is in agreement with the observed green emission of chromaticity coordinate (x=0.1608,y=0.6634) for Mn-doped La0.83MgGa10.95O19samples (Figure 3).

Figure 2.Reflection spectra of La0.83MgGa10.95O19 and La0.83MgGa10.95O19:0.025Mn2+
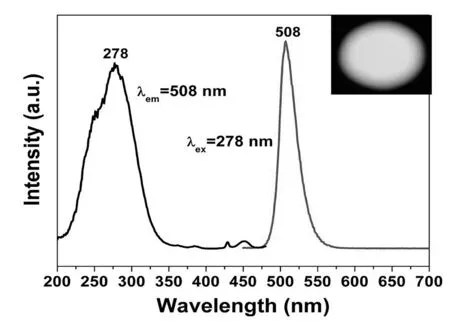
Figure 3.Excitation and emission spectra of La0.83MgGa10.95O19:0.025Mn2+.
Figure 3 shows the excitation and emission spectra of La0.83MgGa10.95O19:0.025Mn2+.The phosphor shows narrow symmetric bands in the wavelength range of 470-560 nm centered maximum at about 508 nm,irrespective of the excitation wavelength (Figure 3).The observed band emission is ascribed to the T1 (G)-A1(S)transition of Mn2+in the host lattice.The excitation spectrum extends a range from 200 to 350 nm and is consistent with the diffuse reflectance spectra.Definitely,the short strong excitation bands below 260 nm originate from host lattice excitation as can be concluded from the comparison with the reflection spectrum.The appearance of the host lattice excitation bands in the excitation spectrum of Mn2+indicates that there exists an efficient energy transfer from the host lattice to Mn2+ions.The remaining excitation bands in the wavelength range of 278-350 nm can be assigned to the transition of Mn2+from ground state A1 (S) to T1 (G) in lattice.The option is to excite host lattice,followed by efficient energy transfer from the host lattice to the Mn2+ion,which also results in the typical emission of Mn2+.
The green emission in La0.83MgGa10.95O19:Mn2+phosphor may be explained as Mn2++h→ Mn3++e-Where the energy needed in causing the photo excitation of Mn2+.The free electrons in the ground state are excited to the localized states within the forbidden band.From these states,there are non-radiative decays to 4T1 (G) state and from there a radiative transition decay to the ground state (6A1).Therefore,the green emission line at 508 nm in La0.83MgGa10.95O19:Mn2+phosphor is assigned to a transition from the upper 4T1 to the ground 6A1 state of Mn2+ions.
Figure 4 shows the dependence of the measured emission intensities upon the Mn2+concentration.It can be seen that the emission intensity of Mn2+ions increases almost linearly with an increase of Mn2+concentration in La0.83MgGa10.95O19 up to 2.5 mol%.However,a decrease of the measured emission intensities have been observed when concentration of Mn2+ions has exceeded 2.5 mol%.This result might be due to concentration quenching of Mn2+ions.Therefore,we select 2.5 mol% as the optimum concentration of Mn2+ions.
Figure 5 shows emission spectra of La0.83MgGa10.95O19:0.025Mn2+and La0.83MgGa10.95O19:0.025Mn2+,0.05Zn2+phosphors and the inset is the influence on emission intensity of different Zn-doped concentration monitored at 278 nm.We can see that the position of emission center has no shift and the spectrum shape has no change.Moreover,we can conclude that the luminescence intensity of Zndoped La0.83MgGa10.95O19:0.025Mn2+is stronger than single Mndoped,and the optimal concentration is 5 mol%.
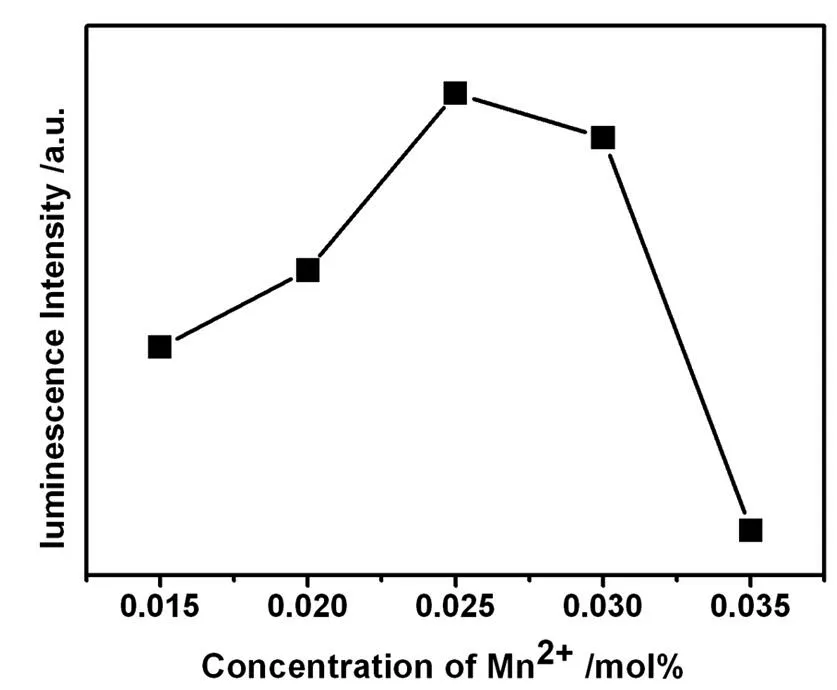
Figure 4 Concentration quenching curves of La0.83MgGa10.95O19:nMn2+.
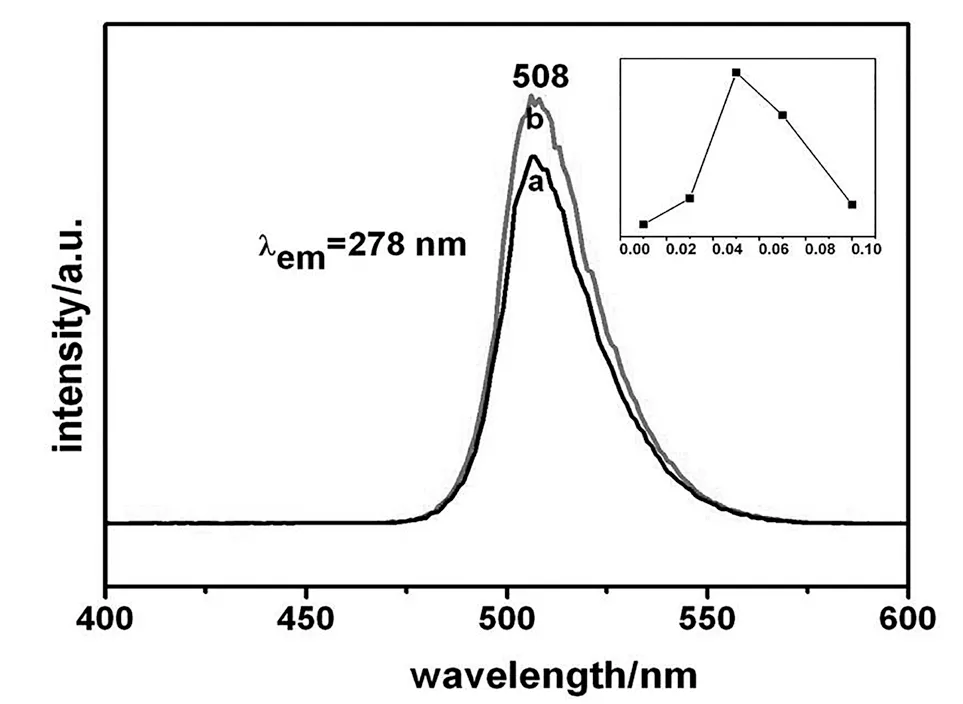
Figure 5 Black and red color online emission spectra of La0.83MgGa10.95O19:0.025Mn2+ and La0.83MgGa10.95O19:0.025Mn2+,0.05Zn2+phosphors (em=508 nm,ex=278 nm).The inset is the influence on emissionintensity of different Zn-doped concentrations monitored at 278 nm.
phosphor Lifetime.The photoluminescence decay curve for 4T1 -6A1 (508 nm) of La0.83MgGa10.95O19:0.025 Mn2+,0.05Zn2+phosphor is shown in Figure 6.It can be well fitted into a single exponential function as
I ()=A*exp(t/)+y0.The decay lifetime of Mn2+luminescence depends to a great extent on host,changing from 0.25 ms (ZnS:Mn2+) to 104 ms (KMgF3:Mn2+).[22]The lifetime of our phosphor is 4.146 ms,which is shorter than most of Mn2+doped phosphors.

Figure 6 Luminescence decay curve of La0.83MgGa10.95O19:0.025Mn2+,0.05Zn2+ for the 4T1 -6A1 (508 nm) emission of Mn2+.
Cathodoluminescence Properties.The representative CL spectrum of the La0.83MgGa10.95O19:0.025Mn2+under the excitation of electron beam (accelerating voltage=3.5 kV; filament current=104 mA) is shown in Figure 7 (a).Figure 7 (b) ascribes emission intensity of La0.83MgGa10.95O19:0.025Mn2+,nZn2+as current 104 mA and voltage 3.5 kV with concentration changing of Zn2+,which have identical shapes as the PL emission spectra.The optimum concentration of CL is 2 mol% while PL is 5 mol%.
The CL emission intensities for the phosphors have been investigated as a function of the accelerating voltage,as shown in Figure 7 (c).The CL intensity increases with the accelerating voltage from 2 to 4 kV.The increase in CL brightness with increasing electron energy can be attributed to deeper penetration of electrons into the phosphors.The electron penetration depth can be estimated using the empirical formula L[ ]=250(A/)(E/Z1/2)n,where n=1.2/(10.29-log10Z),A is the atomic or molecular weight of the material,is the bulk density,Z is the atomic number or the number of electrons per molecule in the case compounds,and E is the accelerating voltage (kV).[23]For CL,the Mn2+ions are excited by the plasma produced by the incident electrons.The deeper the electron penetration depth is,the more the plasmons will be produced.Thus,there are more Mn2+ions being excited and the CL intensity increases.
4 Conclusion
La0.83MgGa10.95O19:A (A=Mn2+or Mn2+,Zn2+) phosphors,showing strong emission in green region,have been synthesized by solid-state reaction.The effect of Mn2+ions on optical properties have been investigated in detail.When Zn2+is co-doped into La0.83MgGa10.95O19:Mn2+,PL and CL intensities increase compared to single Mn2+doped samples,and there are the no changes in spectrum shapes.The phosphor can be used as UV phosphors and in FEDs.
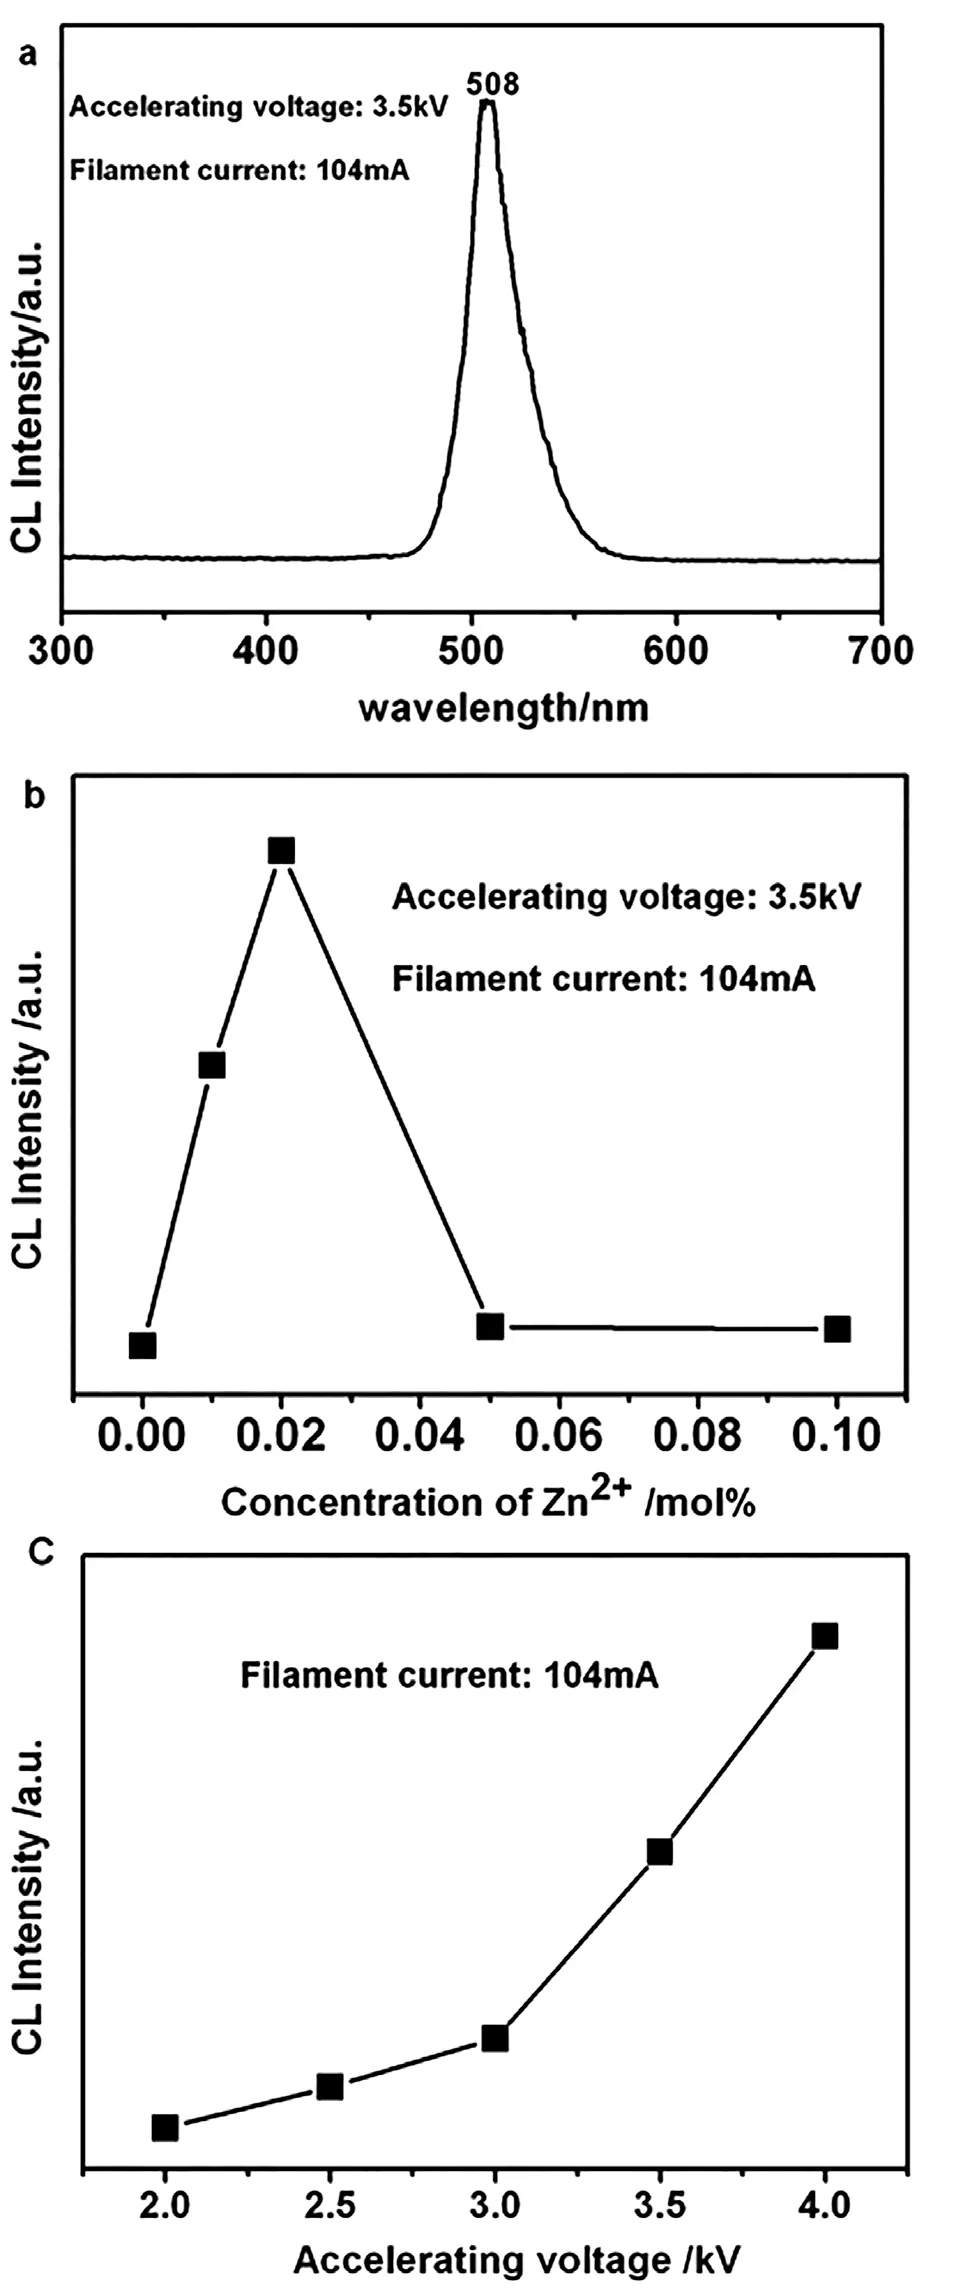
Figure 7 (a) Emission spectra of La0.83MgGa10.95O19:0.025Mn2+ as current 104mA and voltage 3.5 kV; (b) CL intesities of La0.83MgGa10.95O19:0.025Mn2+,nZn2+ as current 104 mA and woltage 3.5 kV and (c) the CL intensity of the La0.83Mg0.955Ga10.95O19:0.025Mn2+,0.02Zn2+ as a function of accelerating voltage.
This project is financially supported by the National Basic Research Program of China 973 Program,Grant No.2007 CB 935502 and the National Natural Science Foundation of China Grant No.20771098.