Comparative transcriptome analysis of abalone Haliotis discus hannai with green and gray egg colors*
Yanwei FENG , Bo YUAN , Xu JIANG , Xiangquan LIU Zan LI Guohua SUN Xiaohui XU
1 School of Agriculture, Ludong University, Yantai 264025, China
2 Shandong Provincial Key Laboratory of Restoration for Marine Ecology, Shandong Marine Resource and Environment Research Institute, Yantai 264006, China
3 National Demonstration Center for Experimental Fisheries Science Education, Shanghai Ocean University, Shanghai 201306, China
4 Shanghai Engineering Research Center of Aquaculture, Shanghai Ocean University, Shanghai 201306, China
5 Shandong Rice Research Institute, Shandong Academy of Agricultural Sciences, Jinan 250100, China
Abstract Haliotis discus hannai is an important marine economic species in China. Its egg color was found to be associated with economic traits, which provides a new idea for breeding. However, the molecular mechanism of the egg-color formation has not been reported. Thus, the pigment composition and comparative transcriptome analyses of H. discus hannai with green and gray egg color were conducted using high-performance liquid chromatography (HPLC) and RNA-Seq methods. Results show that individuals with green and gray eggs both possess the fucoxanthin. Lutein existed in gray-egged individuals, but not in green-egged individuals. In transcriptome analysis, 272 310 unigenes were received from 461 162 transcripts with a mean length of 985 bp and N50 of 1 524 bp, respectively. A total of 185 unigenes were identified as differentially expressed genes (DEGs). The DEGs involved in “flavin-containing compound metabolic process”, “melanosome”, “glutathione metabolism”, and “cytochrome b6f complex” were likely related to the formation of the egg color. Our results provide foundational information for the functional analysis of egg-color related genes and are beneficial to the selective breeding of H. discus hannai.
Keyword: Haliotis discus hannai; egg color; high-performance liquid chromatography; transcriptome; differentially expressed genes
1 INTRODUCTION
Haliotis discus hannai, which belongs to Mollusca, Gastropoda, is regarded as the most important cultivated abalone in China, Japan, and South Korea. It is known for its high nutritional value and high market value (Gordon and Cook, 2004). However, with the increasing density of culture and the deterioration of farming environment, many problems appeared, such as high mortality, slow growth, and poor resistance. It is urgent to develop new cultured strains.
Many efforts have focused on developing new strains by selective breeding (Symonds et al., 2012) and heterosis (You et al., 2009), but these are far from enough. Egg color may be closely related to specific economic traits. Hulet et al. (1978) reported that hatchability of brown and olive eggs was higher than that of blue and white eggs in pheasant. Cooley (1971) found the green eggs of Dinptomus oregonensis had a lower diapause rate than red eggs. Our team found that the growth index and immune enzyme activity of H. discus hannai with green egg-color were higher than other egg-colors’ (Zhao et al., 2016), which provides a new idea for the breeding of abalone. As the conventional breeding are time-consuming and labor-intensive, marker-assisted selection (MAS) was used to accelerate the progress of breeding greatly. However, the related markers and genes of egg-color were not reported in H. discus hannai.
The information provided by transcriptome analysis can reveal gene expression profiles and speculate unknown gene functions (Liu et al., 2015). RNA-Seq is a more eき cient, rapid, and sensitive method for deeply studying and analyzing the transcriptome of organisms (Metzker, 2010). Now, RNA-Seq has been applied in many aquatic animals, such as Oujiang carp ( Cyprinus carpio var. color) (Wang et al., 2014), small abalone ( Haliotis diversicolor) (Zhang et al., 2019), Whitefish ( Coregonus clupeaformis spp.) (Jeukens et al., 2010), California red abalone ( Haliotis rufescens) (Valenzuela-Miranda et al., 2015), Japanese scallop ( Patinopecten yessoensis) (Ding et al., 2015), European abalone ( Haliotis tuberculata) (Harney et al., 2016), and Pacific white shrimp ( Litopenaeus vannamei) (Guo et al., 2013). For H. discus hannai, the transcriptome analyses were mainly concentrated in reproduction (Kim et al., 2017), growth (Choi et al., 2015), and immunity (Nam et al., 2016; Shen et al., 2019), its egg color trait was not involved.
In this study, we analyzed the pigments existed in gonad of H. discus hannai by high-performance liquid chromatography (HPLC) and conducted a comparative transcriptome analysis between gray- and green-egged individuals in order to identify some differentially expressed genes and pathways that may determine egg-color formation. Our results will provide foundational information for further studying the molecular mechanism of egg coloring in H. discus hannai.
2 MATERIAL AND METHOD
2.1 Sample collection
The individuals of H. discus hannai were collected from Xunshan Breeding Base in Weihai, Shandong Province, China, in December 2017. Five gray- and five green-egged female individuals were chosen. The gonads and eggs are shown in Fig.1. All individuals under the same condition and were cultured under a standardized feeding regimen. The gonads of all samples were dissected and then stored at -80 °C.
2.2 HPLC analysis
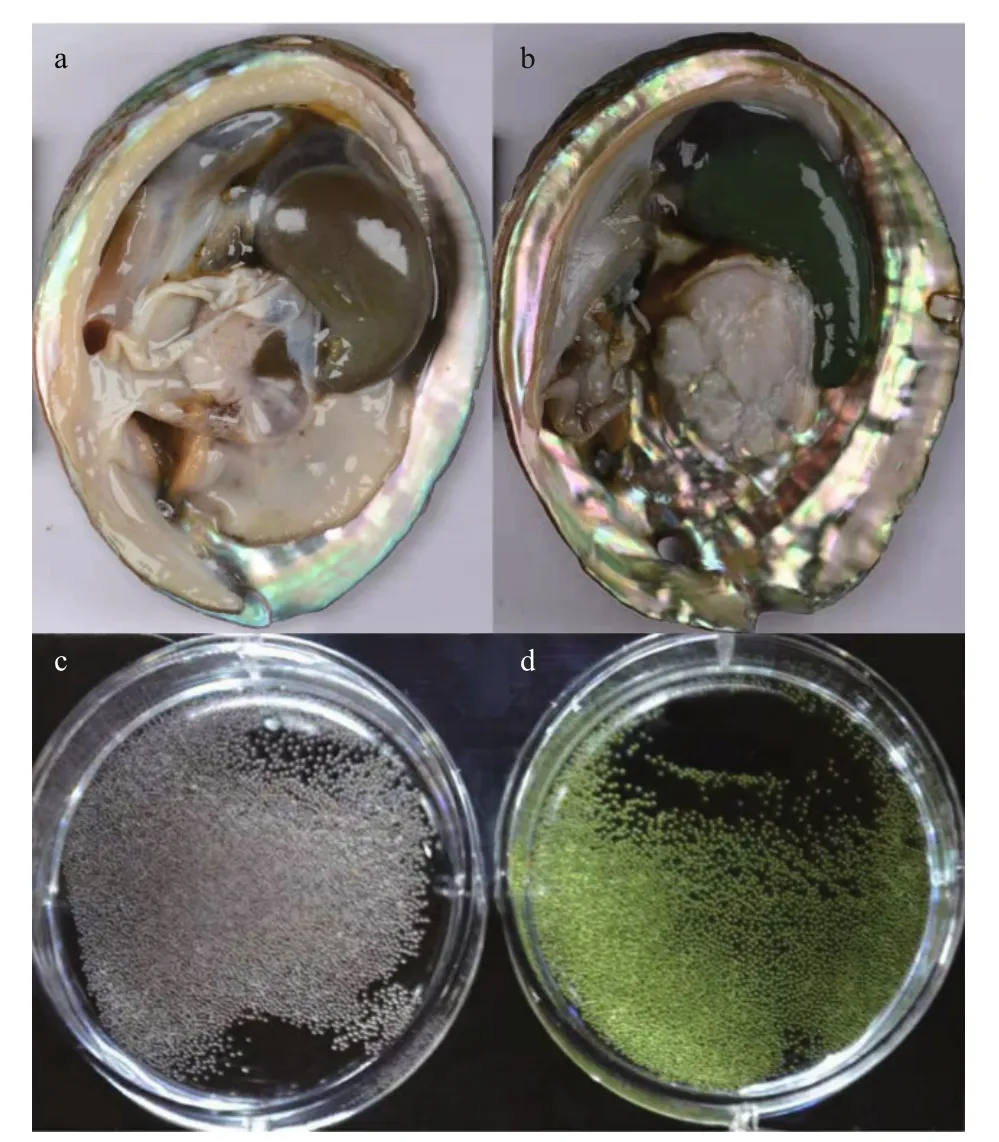
Fig.1 The gonads and eggs of Haliotis discus hannai
Five green- and five gray-egged female individuals were used to analyze the differences of pigments in gonads by HPLC. Fucoxanthin, astaxanthin, canthaxanthin, lutein, zeaxanthin and β-carotene were used as standards. The pigments were extracted with acetone, leached with petroleum ether, separated by pure water, and purified by LC-NH2. The analysis was carried out with ZORBAXEclipse SB-C18 column (Agilent, California, USA, 250 mm×4.6 mm, 5 μm) and determined at 450 nm. The mobile phase consisted of methanol:water (98:2). The types of pigments were determined by comparing the chromatogram of samples with standards.
2.3 Total RNA isolation, library construction and sequencing
Total RNA was extracted from three gray- (H1, H2, and H3) and three green-egged (L1, L2, and L3) female individuals using the TRIzolTMReagent (Invitrogen, California, USA). RNA quality was detected by NanoDrop Onecspectrophotometer (Thermo, Massachusetts, USA), agarose gel electrophoresis, and Agilent 2100 (Agilent, California, USA). A total amount of 1.5-μg RNA per sample was used to construct cDNA libraries using NEBNext®Ultra™ RNA Library Prep Kit for Illumina®(NEB, Massachusetts, USA). Briefly, total RNA was performed to purify mRNA by poly-T oligo-attached magnetic beads. First cDNA strand was obtained using random hexamer primer and M-MuLV Reverse Transcriptase (RNase H), which was followed by the synthesis of second strand. The purified doublestranded cDNA was end-repaired and added with “A” tail and adapters. AMPure XP beads were used for fragment size selection. The 250-300-bp fragments were amplified and purified to obtain the final library, followed by sequencing on Illumina Hiseq platform.
2.4 Transcripts assembly and annotation
Transcriptome assembly was performed using the program Trinity (Li and Durbin, 2009) with min_kmer_cov set to 2 and other parameters set default, and the longest transcript under each gene was regarded as unigene (Altschul et al., 1990). All unigenes function was annotated against NCBI nonredundant protein sequences (NR) (Deng et al., 2006), Gene Ontology (GO) (Ashburner et al., 2000), Swiss protein sequences (Swiss-Prot) (Apweiler et al., 2004), euKaryotic Ortholog Groups (KOG) (Huerta-Cepas et al., 2015), Kyoto Encyclopedia of Genes and Genomes (KEGG) (Kanehisa et al., 2004), and Protein family (Pfam) (Finn et al., 2013) databases.
2.5 Analysis of gene expression levels
Gene expression levels of the samples were estimated using RSEM (Li and Dewey, 2011). Clean reads were matched back to the assembled transcriptome. Readcount of each unigene was acquired from the matching results and then normalized to FPKM (Trapnell et al., 2010).
The DESeq R package (1.10.1) was used to conduct differential expression analysis of two groups. DESeq provides statistical routines for determining differential expression genes and the false discovery rate was limited by adjusting the resulting P-values. Genes with an adjusted P <0.05 and fold-change ≥2 were identified as significantly differential expression.
2.6 GO/KEGG enrichment analysis of DEGs
GO analysis of the differentially expressed genes (DEGs) was implemented by the GOseq R packages (Young et al., 2010). The calculated P-value goes through Bonferroni Correction, taking <0.05 as the threshold. The statistical enrichment of DEGs in KEGG pathways was tested using KOBAS (Mao et al., 2005) software.
2.7 Quantitative RT-PCR verification
To validate the reliability of our DEGs data, quantitative RT-PCR analysis was conducted on 9randomly selected genes. The same batch of RNA samples as sequenced was used, and the cDNA was synthesized using the PrimeScriptTMRT reagent Kit with gDNA Eraser (TaKaRa, Dalian, China). The used primers were designed using Primer Premier 5.0 software and are listed in Table 1. Quantitative RTPCR was carried out using TB GreenTMPremix Ex TaqTM(TaKaRa, Dalian, China) in the LightCycler®480 II Real Time instrument (Roche, Rotkreuz, Switzerland). The cycling conditions were 95 °C for 2 min; followed by 40 cycles of 95 °C for 15 s, 60 °C for 15 s and 72 °C for 1min; melt curve detection of 60 °C for 5 s to 95 °C increment 0.11 °C. The relative mRNA expression levels were calculated by normalizing to the reference genes (β-actin) (Wang, 2015). Three replicates were performed independently for each gene. Relative gene expression levels were calculated with the 2-ΔΔCtcomparative cycle threshold ( Ct) method (Livak and Schmittgen, 2001).
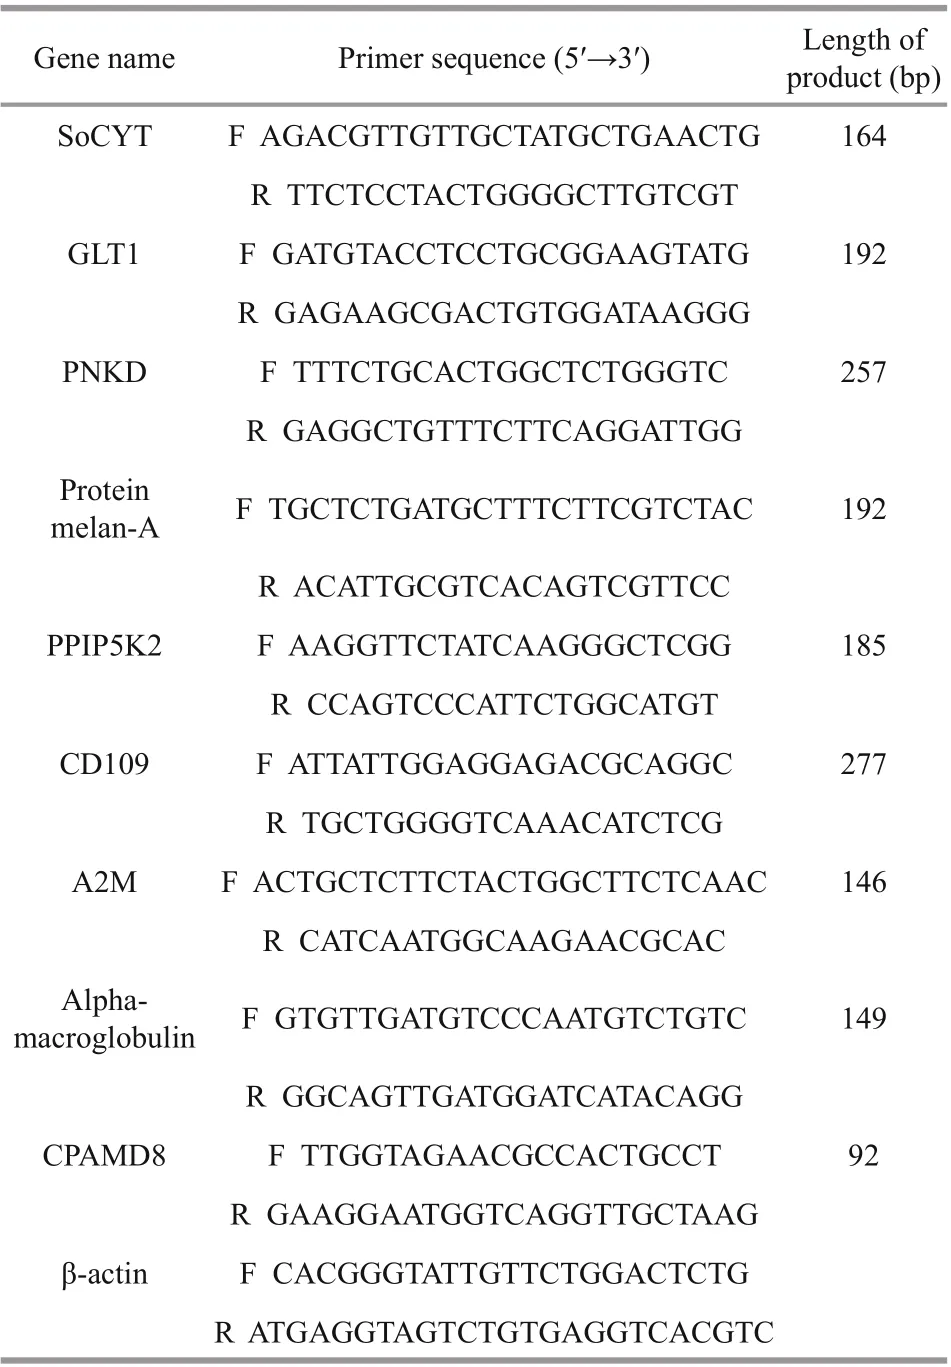
Table 1 Sequences of primers used in qRT-PCR analysis
3 RESULT
3.1 HPLC analysis

Fig.2 The chromatogram of mixed standard solution at 450 nm

Fig.3 The chromatogram of f ive gray-egged female individuals at 450 nm

Fig.4 The chromatogram of f vie green-egged female individuals at 450 nm

Table 2 Comparison of the HPLC results between gray-eggs and green-eggs
The chromatogram of mixed standard solution is shown in Fig.2. Fucoxanthin showed a peak at 6.5 min and β-carotene at 7.5 min. Astaxanthin had peaks at 12.5 min and 14.5 min. Lutein began to show a peak at 16.2 min and zeaxanthin at 18.1 min. Canthaxanthin showed peaks at 26.6 min and 29.9 min, respectively, and the characteristic peak was at 29.9 min. The six standards had obvious characteristic peaks and did not interfere with each other.
The female individuals with gray-egg mainly showed peaks at 5.1 min, 6.5 min, 8.8 min, 10.2 min, 15.3 min, and 16.2 min (Fig.3). Through comparing with the chromatogram of standards, the peak at 6.5 min can be inferred to be fucoxanthin and the peak at 16.2 min is lutein. The peaks at 5.1 min, 8.8 min, 10.2 min, and 15.3 min may be several unknown pigments. The chromatogram of female individuals with green-egg is shown in Fig.4. The peak at 6.5 min was fucoxanthin. The peaks at 5.1 min, 8.8 min and 10.2 min, consistent with the gray-egg individuals, were unknown pigments. The peak appeared at 13.1 min was the characteristic pigment. The comparison of the HPLC results between gray-eggs and green-eggs were summarized in Table 2.
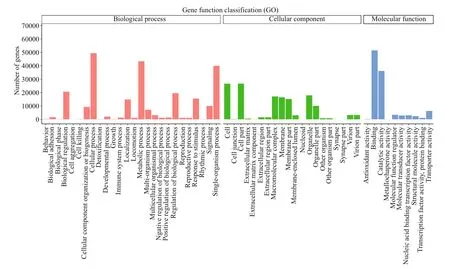
Fig.5 GO analysis of unigenes

Table 3 Statistical assessment of transcriptome sequencing data
3.2 Summary of RNA-Seq data sets
RNA-seq results are summarized in Table 3. In total, 44.56 Gb of clean data was obtained. 272 310 unigenes were assembled with a N50 of 1 524 bp and mean length of 985 bp. Q30 of each library was higher than 92%, with GC content of approximately 49%. More than 52% clean reads of each library were mapped to corresponding unigenes.
A total of 8 439 unigenes were matched successfully in all seven databases, accounting for 3.09% of the total unigenes (Table 4). A total of 89 004 (32.68%), 91 893 (33.74%), 31 200 (11.45%), and 27 357 (10.04%) unigenes were mapped to NR, GO, KOG, and KEGG databases, respectively.
3.3 GO, KEGG and KOG classification
A total of 91 893 unigenes were matched to 56 GOterms and three ontologies (Fig.5). For biological process (BP), “cellular process” was the most represented term, followed by “metabolic process” and “single-organism process”. For cellular component (CC), the highly represented terms were “cell part”, “cell” and “organelle”. For molecular function (MF), “catalytic activity” and “binding” were highly represented.
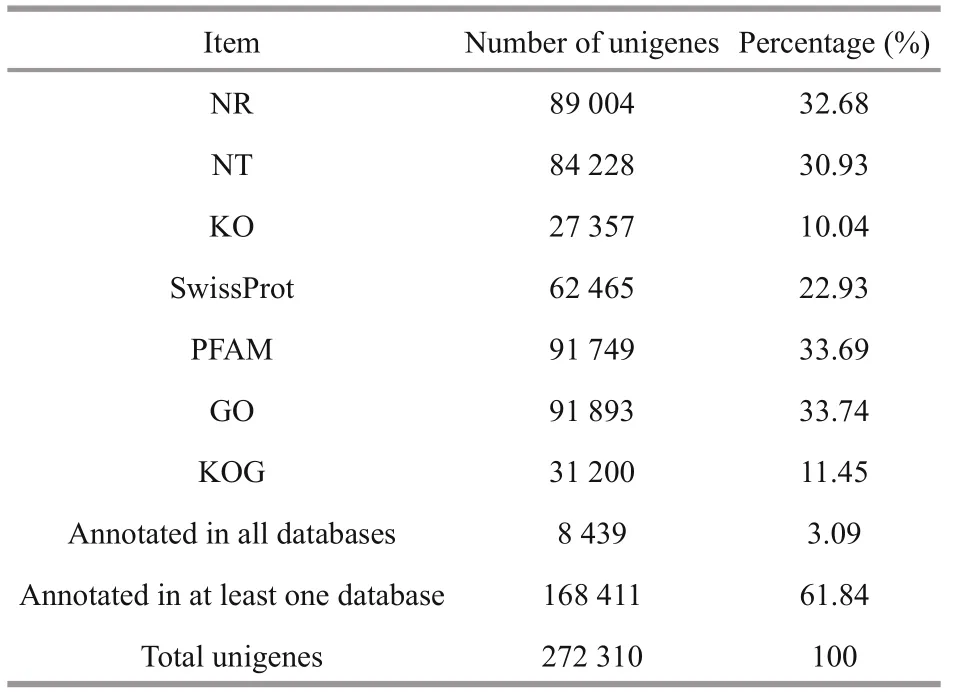
Table 4 Annotation of unigenes in seven different databases
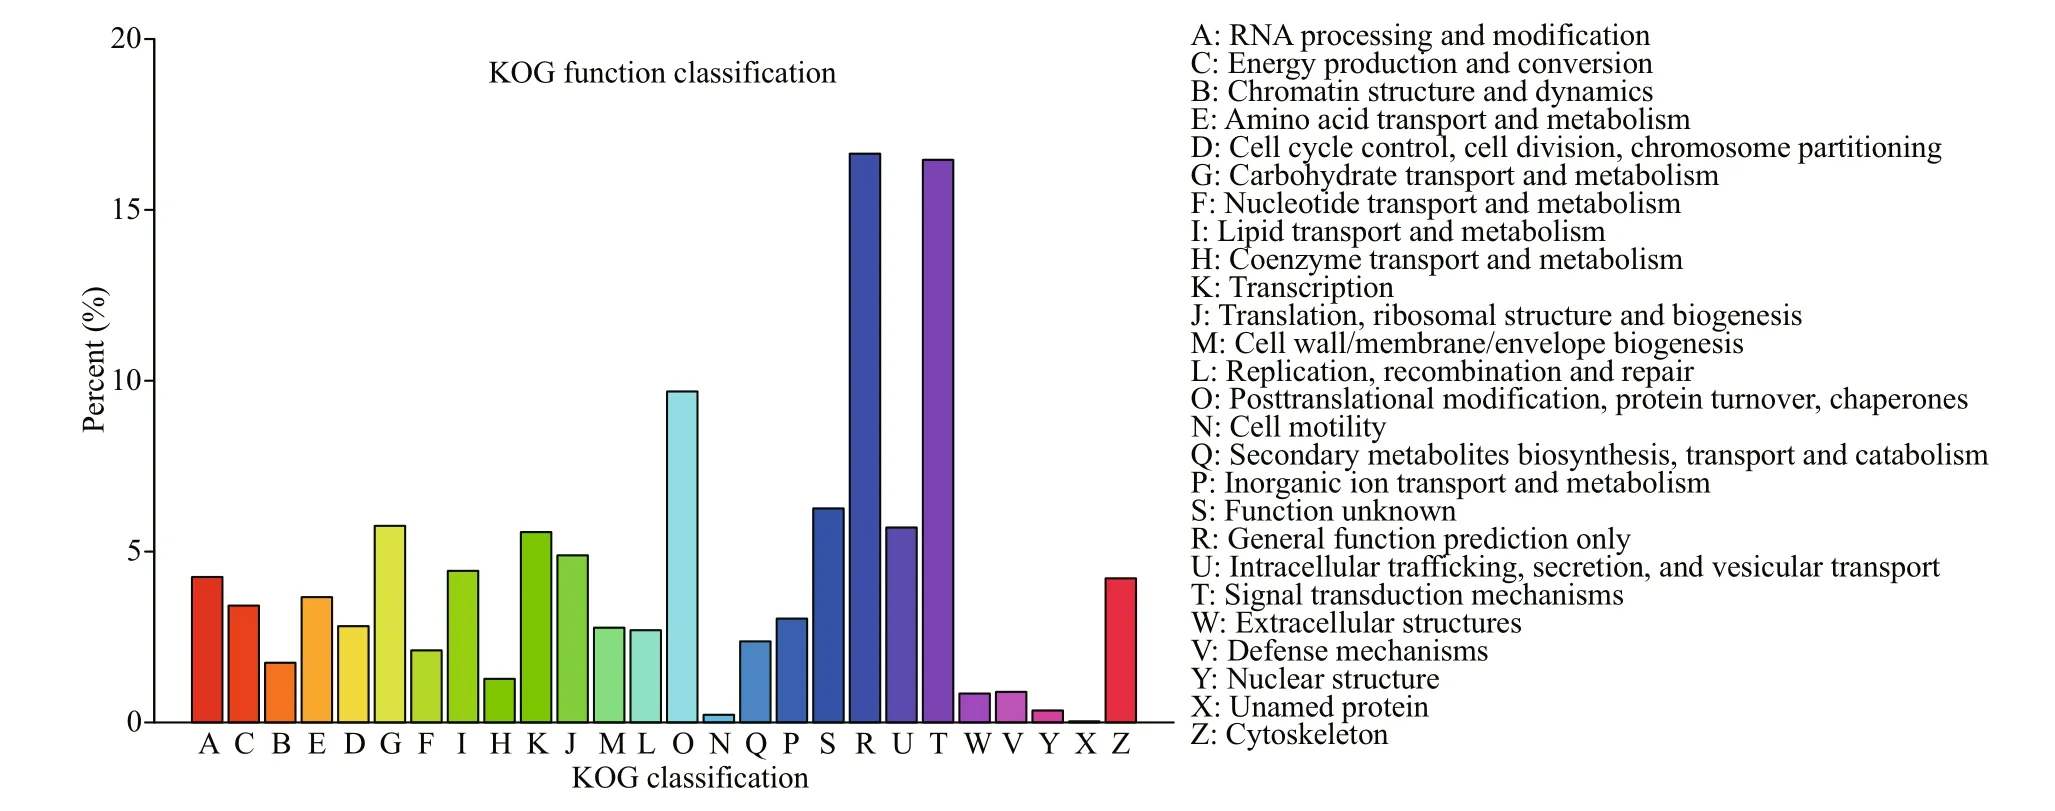
Fig.6 KOG analysis of unigenes
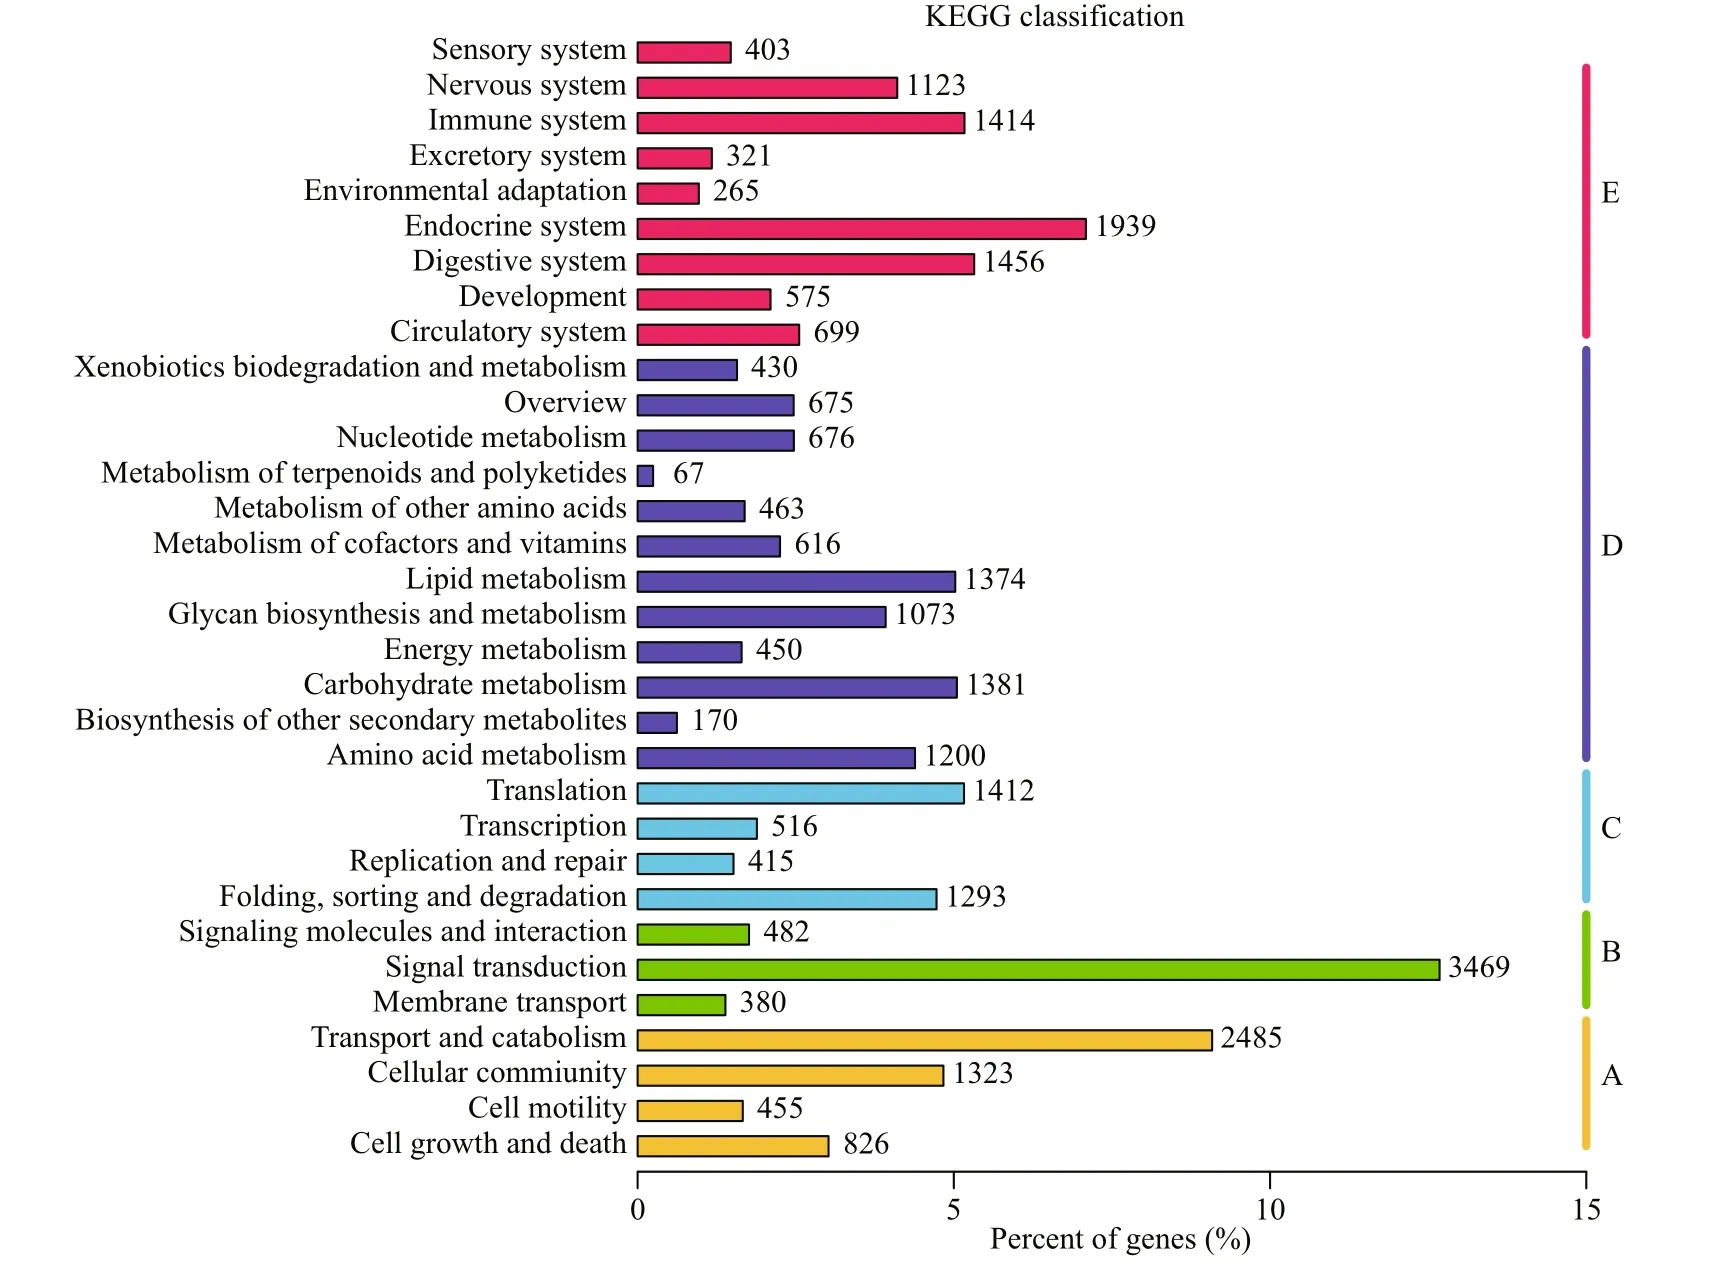
Fig.7 KEGG analysis of unigenes
A total of 31 200 unigenes were successfully matched in KOG database and divided into 26 KOG categories (Fig.6). The cluster of “General function prediction only” was highly represented, followed by “Signal transduction mechanisms” and “Posttranslational modification, protein turnover, chaperones”. A total of 27 357 unigenes were successfully annotated to 32 KEGG pathways in five branches (Fig.7), including cellular processes (A), environmental information processing (B), genetic information processing (C), metabolism (D) and organismal systems (E). “transport and catabolism”, “signal transduction” and “endocrine system” were the most represented pathways.
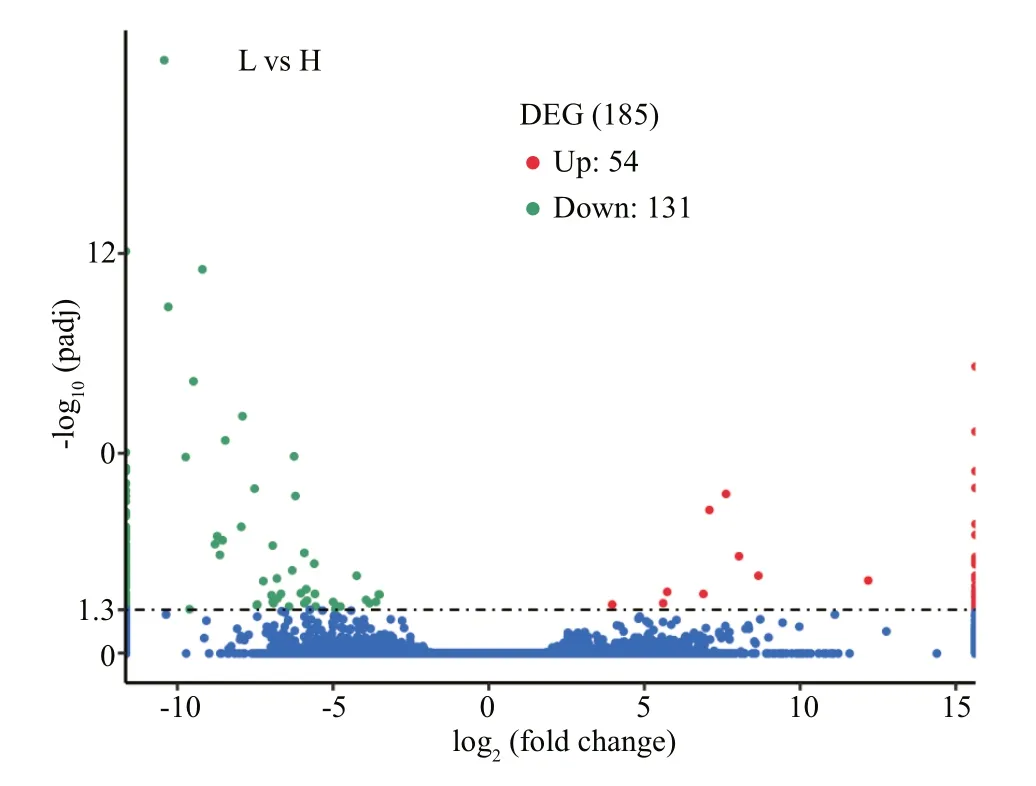
Fig.8 Volcano plot of DEGs
3.4 Functional annotation and analysis of differentially expressed genes (DEGs)
Compared with gray-egged abalone, 185 genes were confirmed as DEGs in green samples, including 54 significantly up-regulated and 131 down-regulated genes (Fig.8). The result of hierarchical cluster analysis was shown in Fig.9. L1, L2, and L3 were clustered into a group “L”, in which DEGs exhibited similar expression patterns. H1, H2, and H3 were clustered into another group “H”. Compared “L” with “H”, a significant difference in gene expression between green and gray egg-color can be suggested.
The top 30 of terms in GO enrichment of DEGs based on the criteria of P-value are listed in Fig.10, and they were classified into three functional categories (MF, BP, and CC). The numbers of GO terms in MF, BP, and CC categories were 17, 10, and 3, respectively. In MF category, the DEGs were significantly enriched in the terms of GTP binding, guanylribo nucleotide binding and guanyl nucleotide binding. In BP category, the terms significantly enriched were DNA packaging and DNA conformation change. In CC category, the DEGs were significantly enriched in extracellular region. In KEGG pathway enrichment analysis, the top 20 of pathways ( P-value) are listed in Fig.11, including beta-alanine metabolism, nitrogen metabolism, glycerolipid metabolism, tryptophan metabolism, and so on. Of these pathways, lysosome was most abundant (6 DEGs).
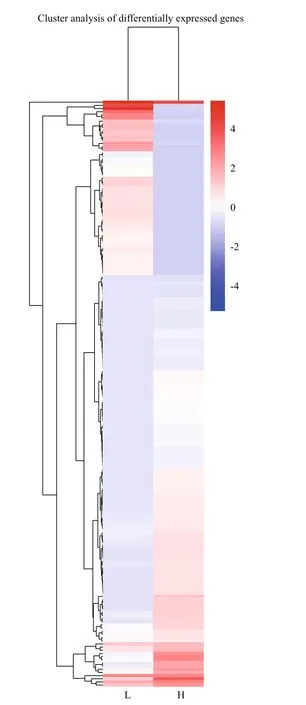
Fig.9 Hierarchical clustering analysis of DEGs between L1-3 and H1-3 samples
3.5 Confirmation using quantitative real-time PCR
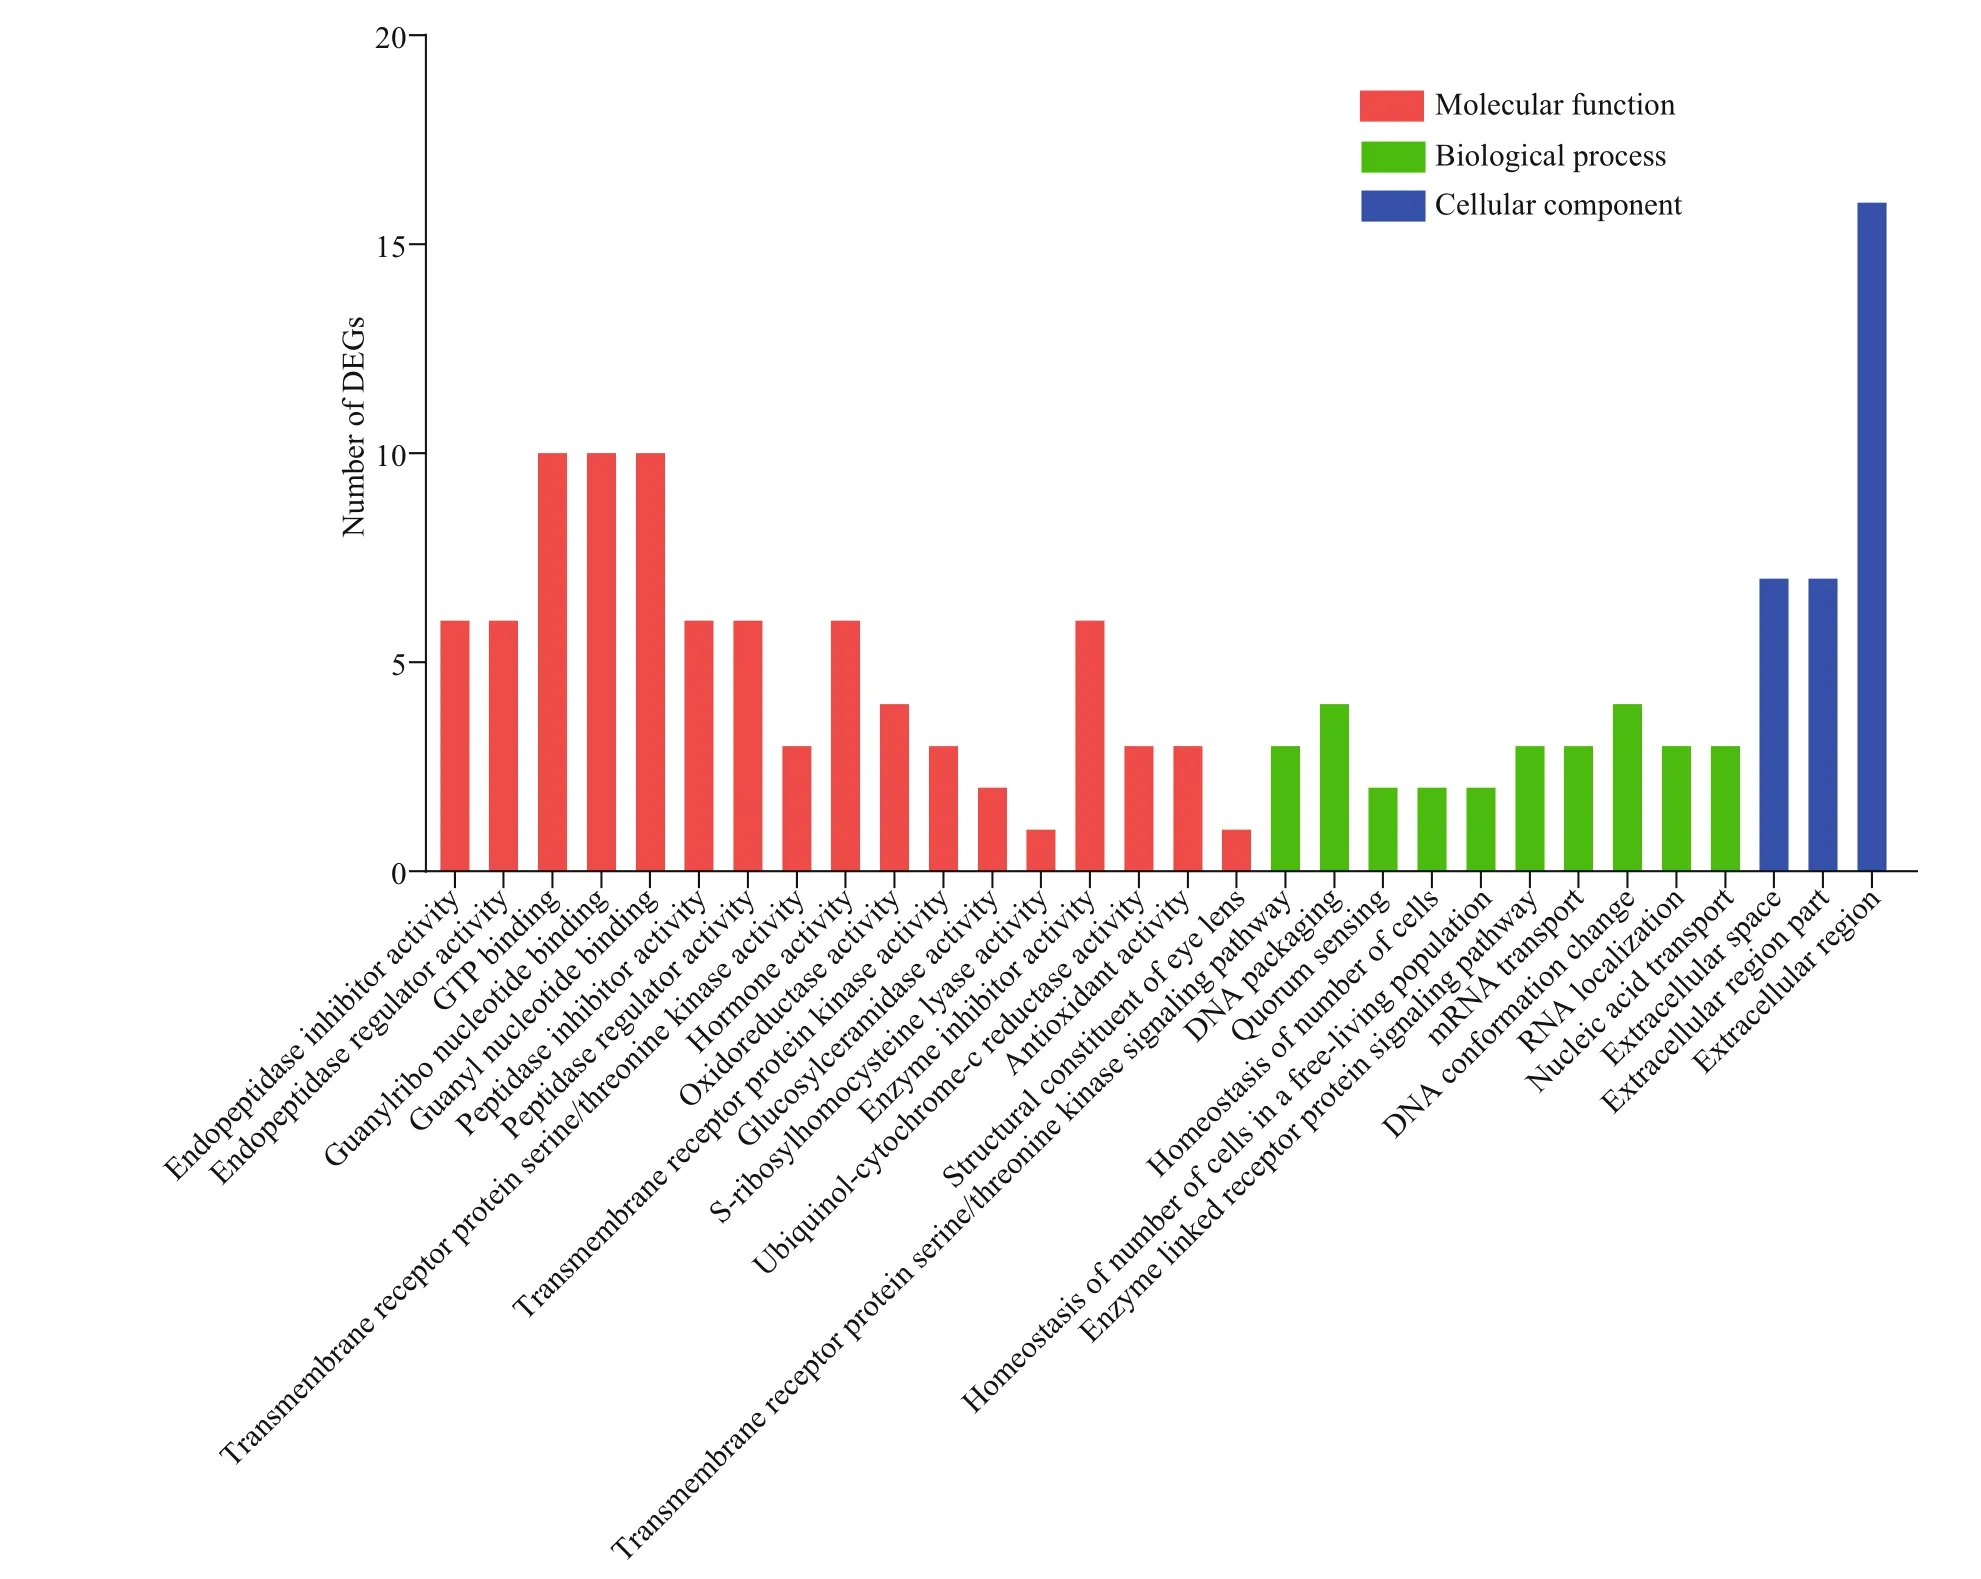
Fig.10 GO analysis of DEGs
Nine genes were randomly selected for qRT-PCR analysis to confirm the reliability of DEGs data. As shown in Fig.12, the expression levels of the nine genes analyzed by qRT-PCR are mainly in agreement with the data of RNA-seq, which indicates our RNAseq data were reliable. The reasonable functional predictions of DEGs can be made based on enrichment analysis.
4 DISCUSSION
With the goal of exploring the genes related to the egg-color in H. discus hannai, the transcriptome analysis of the green- and gray-egged female individuals was firstly conducted in this study. Through analyzing transcriptome data, 185 DEGs were found. Some DEGs were involved in the terms or pathways related to the formation of egg-color in GO and KEGG analyses. The terms/pathways “flavincontaining compound metabolic process”, “tyrosine metabolic process”, “melanin-concentrating hormone activity”, “melanosome”, “pigment granule”, “glutathione metabolism”, “cytochrome b6f complex”, “nitrogen metabolism”, “alanine, aspartate and glutamate metabolism”, “pigment metabolic process”, and “beta-Alanine metabolism”, should be paid special attention.
The pigments associated with the coloration of aquatic animals are mainly astaxanthin, lutein, β-carotene, canthaxanthin and melanin (Liu et al., 2002; Leng and Li, 2006). It has been reported that the saturation stage of animals is achieved by deepening the yellow pigment and natural lutein can be directly deposited on the scales, skin, adipose tissue, and eggs, thus showing different colors (Wang, 2012). In HPLC results, we confirmed the lutein was present in gray-egged individuals and not in greenegged individuals. In RNA-seq analysis, the term “flavin-containing compound metabolic process” was enriched and only represented by the gene “PPIP5K2”. “PPIP5K2” gene was expressed in gray-egged individuals only. Therefore, the “PPIP5K2” gene was speculated on regulating the metabolism of lutein.
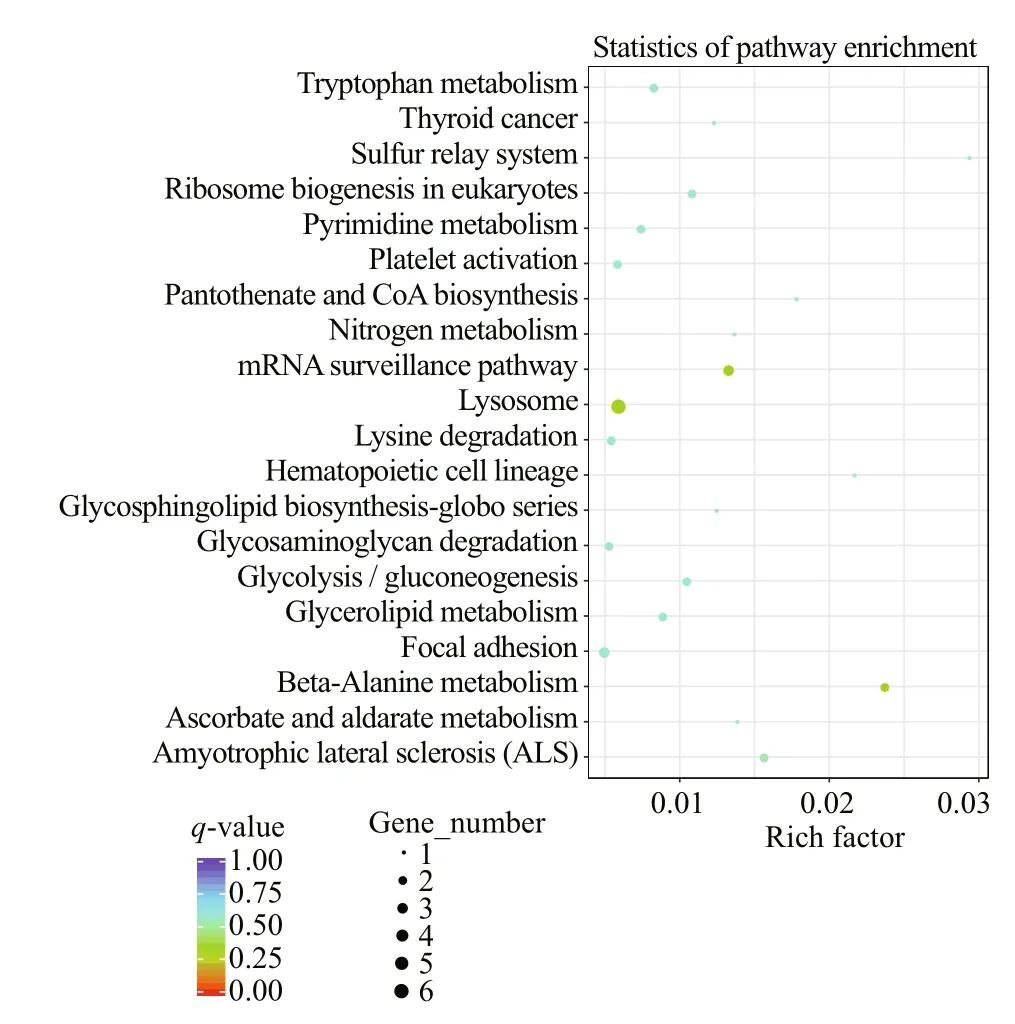
Fig.11 Scatter plot of KEGG pathways enriched by DEGs
The terms “tyrosine metabolic process”, “melaninconcentrating hormone activity”, “melanosome” and “pigment granule” were found related to the formation of egg color. It has been reported that the foot-color of Paphia undulata was influenced by tyrosine metabolic (Deng et al., 2018). Tyrosine is the main precursor of melanin synthesis and its metabolism process directly affects the content of melanin in cells. Melanin is considered the key pigment associated with the color formation of aquatic animals (e.g., purple and green sea cucumbers, Xing et al., (2018)). “Melaninconcentrating hormone activity”, “melanosome” and “pigment granule” may play critical roles in melanin synthesis. Melanosome is a tissue-specific, lysosomerelated, specialized organelle, which can synthesize and store the melanin (Raposo and Marks, 2007). Xing et al. (2017) reported that the green and purple sea cucumbers contained mature melanosomes that can secrete melanin granules into the body wall.
The pathway “Glutathione metabolism” should be significantly focused. Glutathione (c-L-glutamyl-Lcysteinyl glycine, GSH) can affect the process of pigmentation and reduce the formation of melanin by reducing the reactive oxygen species (ROS) formation and the positive modulation of GSH/GSSG ratio in cells (Pompella et al., 2003; Chu et al., 2009).
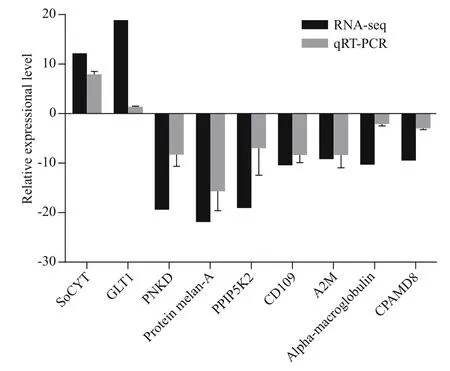
Fig.12 Validation of the selected DEGs by qRT-PCR compared with RNA-seq data
In our GO terms, “cytochrome b6f complex” was only enriched by the gene “SoCYT”. “cytochrome b6f complex” is an electron transporter on the thylakoid membrane, which is composed of cytochrome b6-f complex iron-sulfur subunit protein (Staehelin and Arntzen, 1983). Its primary function is to participate in the electron transfer between photosystem I (PS I) and photosystem II (PS II), and affect the synthesis of NADPH (Zhang et al., 2001; Cassan et al., 2005). “SoCYT” gene was up-regulated in this study and its high expression was conducive to the formation of more NADPH (Liang and Li, 2016). As the coenzyme of GSH reductase, NADPH plays an important role in maintaining the content of GSH (Holmgren et al., 2005; Couto et al., 2013), which may reduce the formation of melanin. The gene “GLT1” was enriched to the “Nitrogen metabolism” and “Alanine, aspartate and glutamate metabolism” in KEGG pathway analysis. It regulates the process of glutamate metabolism with the cooperation of NADPH (Tempest et al., 1970). As the component of GSH, the synthesis of glutamate directly affects the content of GSH and then affects the formation of melanin.
In addition, “beta-alanine metabolism” was enriched in KEGG analysis. Koch et al. (2000) found that N-B-alanyldopamine synthase (BAS) transfers beta-alanine to dopamine to form N-β-alanyldopamine (NBAD), which can reduce the deposition of melanin on the body surface.
5 CONCLUSION
In this study, the pigment composition and a transcriptome analysis between green- and grayegged individuals of H. discus hannai was performed. The expression products of 185 unigenes (DEGs) exhibited significant differential expression. The DEGs involved in “flavin-containing compound metabolic process”, “melanosome”, “glutathione metabolism” and “cytochrome b6f complex” were identified and found to be related to the formation of egg-color, which merits further investigation. Our results provide foundational information for the functional analysis of egg-color related genes and are beneficial to the selective breeding of H. discus hannai.
6 DATA AVAILABILITY STATEMENT
All data that support the findings of this study are available from the corresponding author on reasonable request.
 Journal of Oceanology and Limnology2021年1期
- Journal of Oceanology and Limnology的其它文章
- Influence of sequential tropical cyclones on phytoplankton blooms in the northwestern South China Sea*
- Simulated perturbation in the sea-to-air flux of dimethylsulfide and the impact on polar climate
- Performance of ecological restoration in an impaired coral reef in the Wuzhizhou Island, Sanya, China*
- Investigating factors driving phytoplankton growth and grazing loss rates in waters around Peninsular Malaysia
- Effects of oxytetracycline dihydrate and sulfamethoxazole on Microcystis aeruginosa and Chlamydomonas microsphaera*
- Reproductive cycle of Ophiopholis mirabilis (Echinodermata: Ophiuroidea) in Zhangzi Island area, northern Yellow Sea*
