Complementary DNA sequencing (cDNA): an effective approach for assessing the diversity and distribution of marine benthic ciliates along hydrographic gradients*
Pingping HUANG , Feng ZHAO , Kuidong XU , ,
1 Laboratory of Marine Organism Taxonomy and Phylogeny, Institute of Oceanology, Chinese Academy of Sciences, Qingdao 266071, China
2 Laboratory for Marine Biology and Biotechnology, Pilot National Laboratory for Marine Science and Technology (Qingdao), Qingdao 266237, China
3 University of Chinese Academy of Sciences, Beijing 100049, China
4 Center for Ocean Mega-Science, Chinese Academy of Sciences, Qingdao 266071, China
Abstract The Yellow Sea Cold Water Mass (YSCWM) is a distinct hydrographic phenomenon of the Yellow Sea, and the distribution pattern of meio- and macrobenthos differs inside and outside of the YSCWM. However, such a pattern has never been observed in the microbenthic ciliate communities. Therefore, we hypothesized that benthic ciliates followed a similar distribution pattern as meio- and macrobenthos, but this pattern has not been uncovered by morphological methods. We evaluated the diversity and distribution of benthic ciliates at five stations along hydrographic gradients across the YSCWM and adjacent shallow water by using morphology and DNA and complementary DNA (cDNA) high-throughput sequencing of the V4 region of 18S rRNA gene. Results showed that the diversity of benthic ciliates detected by DNA (303 OTUs), and the cDNA (611 OTUs) sequencing was much higher than that detected by the morphological method (79 species). Morphological method detected roughly different ciliate communities inside and outside of the YSCWM, but without statistical significance. No clear pattern was obtained by DNA sequencing. In contrast, cDNA sequencing revealed a distinct distribution pattern of benthic ciliate communities like meio- and macrobenthos, which coincided well with the results of the environmental parameter analysis. More than half of the total sequences detected by DNA sequencing belonged to planktonic ciliates, most (if not all) of which were recovered from historic DNA originating through the sedimentation of pelagic forms because none of them were observed morphologically. The irrelevant historic DNA greatly influenced the recovery of rare species and thus limited the understanding of the benthic ciliate diversity and distribution. Our research indicates that the methods used have significant effects on the investigation of benthic ciliate communities and highlights that cDNA sequencing has great advantages in estimating the diversity and distribution of benthic ciliates, as well as the potential for benthic environmental assessments.
Keyword: benthic ciliates; cDNA high-throughput sequencing; community comparison; DNA highthroughput sequencing; morphology
1 INTRODUCTION
Ciliates are highly diverse and often quantitatively important microbial eukaryotes and play a pivotal role in the multistep microbial food web (Sherr and Sheer, 2002; Fenchel, 2008; Mieczan et al., 2018). The species diversity and abundance of ciliates are much higher in marine sediments than in the pelagic ecosystem (Meng et al., 2012). However, the lack of appropriate methods to extract, fix and stain ciliates from marine sediments makes analyses diき cult (Wickham et al., 2000; Xu et al., 2010), and the loss of cells after fixation and storage often results in the underestimation of their diversity and abundance (Ngando and Groliere, 1991; Foissner, 2014). In addition, the estimation of ciliate species diversity is often hampered by taxonomic limitations, in particular for geographically rare species, which usually constitute the major proportion of diversity. These shortcomings may limit our understanding of the diversity and distribution of ciliates in marine sediments.
cDNA (complementary DNA, synthesized from an RNA template) sequencing has the potential to overcome artifacts present in DNA sequencing, particularly the influence of extracellular DNA and DNA from dead cells and cysts (Stoeck et al., 2007; Massana et al., 2015). Several studies on pelagic communities have indicated that cDNA sequencing can reduce the interference of extracellular DNA from metazoans and dead protists (e.g., Hu et al., 2016; Xu et al., 2017). Lejzerowicz et al. (2013) showed that for foraminifera in deep-sea sediments, planktonic OTUs appeared only in the DNA dataset, with none in the cDNA dataset. Thus, cDNA sequencing could theoretically identify an active benthic community, which might coincide with the community observed by morphological examination (Giner et al., 2016). More recently, Stoeck et al. (2018) utilized the cDNA sequencing method and indicated that marine benthic ciliates could act as powerful indicators mirroring the macrobenthos benchmark patterns in environmental impact assessments.
The Yellow Sea is a semi-enclosed shelf sea in East Asia. The Yellow Sea Cold Water Mass (YSCWM) is a distinct chemicohydrographic phenomenon of the Yellow Sea in water bodies deeper than 40 m from early summer to fall and is characterized by low water temperatures (<10 °C) and high salinity (>32) and nutrient concentrations (Zhang et al., 2008; Xin et al., 2015). Previous studies have shown that there are distinctly different distribution patterns of both meio- and macro-benthic communities inside and outside of the YSCWM (Liu et al., 2007; Zhang et al., 2012). However, such a pattern has never been observed for microbenthic ciliate communities (Meng et al., 2012; Zhou and Xu, 2016). We hypothesize that microbenthic ciliates follow a similar distribution pattern as meio- and macrobenthos, but this pattern has not been uncovered by traditional morphological methods.
In this study, we evaluated the distribution pattern of benthic ciliate communities at five stations along a transect across the YSCWM and the adjacent Bohai Sea by using a morphological method and DNA and cDNA high-throughput sequencing of the V4 region of the 18S rRNA gene. We aimed to i) compare the diversity and community composition of benthic ciliates revealed by the three approaches and ii) evaluate the eき ciency of the three approaches in delineating the distribution pattern of benthic ciliate communities along environmental gradients.
2 MATERIAL AND METHOD
2.1 Sample collection and environmental parameters
To test the eき ciency of the three approaches for assessing the benthic ciliate diversity and distribution, we selected five stations along a transect from inside to outside of the YSCWM. Two stations (YC1 and YC2) were located inside the YSCWM, two stations (B1 and B2) were located outside of the YSCWM, and one station (Y3) was located in the transition zone (Fig.1). Stations B1 and B2 were located in the Bohai Sea (also known as Bohai Bay), which is often considered the western part of the Yellow Sea and has fauna and flora related to those in the Yellow Sea (Wang et al., 2013). Undisturbed sediment samples were successfully collected from the five stations in August 2015 with the R/V Dong Fang Hong 2.
The sediment samples were taken using a 0.1-m2modified Gray-O’Hara box corer. For the morphological study, two replicate samples were collected from each station using a set of 30-mL cutoff disposable syringes (i.d. 23 mm). In the Yellow Sea, approximately 70% of ciliates occur in the top 0-2 cm of sediments (Meng et al., 2012). Thus, the 0-2 cm layer of sediments was sliced, immediately fixed with an equal volume of 4% ice-cold glutaraldehyde, and then stored at 4 °C until further analysis in the lab. Meanwhile, two additional replicate samples of approximately 50 g sediment each were taken from the surface sediments (0-2 cm) with a sterilized spoon and stored at -80 °C for DNA and RNA extraction. For the measurements of environmental parameters, approximately 200 g surface sediments (0-2 cm) were collected from each station and immediately stored at -20 °C until analysis.
Bottom water temperature, water depth and salinity were measured using Seabird CTD probes. The contents of organic carbon and nitrogen in the sediments were determined using the Vario TOC/Macro Cube elemental analyzer (Elementar, Germany). Water content was measured after drying the sediments at 60 °C for 48 h. Sediment median grain size was analyzed by using a laser particle size instrument (Cilas 1190) (CILAS, France). The concentrations of chlorophyll a and pheophytin a in the sediments were measured using a Trilogy Fluorometer (Turner Designs, USA).
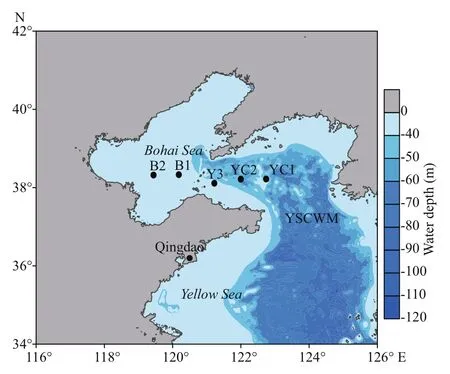
Fig.1 Sampling stations inside (YC1 and YC2) and outside (B1, B2 and Y3) of the Yellow Sea Cold Water Mass (YSCWM)
2.2 Morphological identification and enumeration
Ciliates were extracted from each sediment sample and stained with protargol following the Ludox-QPS method (Ludox density gradient centrifugation combined with quantitative protargol stain), which produced excellent extraction eき ciency rates for smaller ciliates in the sand and ciliates in the mudsand and muddy sediments (Xu et al., 2010). Briefly, each fixed sediment sample was elutriated before centrifugation; after sedimentation and concentration, a subsample of 9 mL (3 g sediment) was used to extract ciliates from the sediments by Ludox HS 40 density gradient centrifugation. The extracted organisms were concentrated on a cellulose nitrate filter and stained with protargol. Then, ciliates on two prepared slides from each station were observed separately with a Leica DM 4500B (Leica Microsystems, Germany) microscope at magnifications of (200-1 000)× and were identified according to the related literature (e.g., Lynn and Small, 2002; Lynn, 2008; Song et al., 2009).
2.3 DNA/RNA extraction and cDNA synthesis
Three 0.3-g subsamples from each replicate sediment sample were taken to extract the total DNA with the Power Soil DNA isolation kit (MoBio Laboratories, USA). A total of 2 g of sediment from each replicate sample was taken to extract the total RNA with the PowerSoil Total RNA isolation kit (MoBio Laboratories, USA). Three subsamples (3× 3 μL) of each RNA extraction were reversetranscribed into cDNA with a 1ststrand cDNA synthesis kit (TaKaRa, Japan).
2.4 PCR amplification and high-throughput sequencing
The hypervariable V4 region of the ciliate 18S rRNA gene was amplified by nested PCR (Stock et al., 2013). The primers CilF, CilRI, CilRII and CilRIII were used to amplify ciliate-specific fragments of the 18S rRNA gene, and 35 PCR cycles were programmed during the first round of PCR amplification (Lara et al., 2007). Subsequently, 1.5-μL PCR products from the first reaction were subjected to a second PCR with eukaryote-specific primers to amplify the V4 region (Stoeck et al., 2010). The PCR protocol started with 10 identical amplification cycles at an annealing temperature of 57 °C, followed by 25 cycles at an annealing temperature of 49 °C (Stoeck et al., 2010).
Three PCR products from each replicate sample were mixed. Two mixed PCR products from DNA samples and two mixed PCR products from cDNA samples of each station were sequenced on an Illumina MiSeq platform, and 300-bp paired-end reads were generated. The ciliate sequence reads were deposited at the National Center for Biotechnology Information (NCBI) Sequence Read Archive under accession number SRP159207.
2.5 Sequence data processing
The paired-end reads in each sample were merged using FLASH V1.2.7 (Magoč and Salzberg, 2011). Raw sequences were filtered according to the QIIME quality control process (Caporaso et al., 2010), and then the chimeras were detected and deleted by UCHIME to obtain the effective sequences (Edgar et al., 2011; Haas et al., 2011). Effective sequences were clustered into operational taxonomic units (OTUs) by USEARCH at a threshold of 97% similarity (Edgar, 2013). The taxonomic information for the representative sequence of each OTU was annotated against the Silva database (v. 123) using a similarity threshold of at least 80% with QIIME (Caporaso et al., 2010). In addition, as some OTUs could not be assigned to specific classes against the Silva database (V. 123), we manually blasted them against the NCBI database.

Table 1 Environmental parameters at f ive stations
2.6 Statistical analysis
We calculated the numbers of morphospecies/OTUs and the relative abundance of each species/OTU based on the average of two replicate samples at each station. Furthermore, the regional relative abundance of individual OTUs was calculated as the average of its local relative abundance across all the stations, including zero values. Accordingly, OTUs were defined as regionally abundant OTUs when their average relative abundance at all stations were higher than 0.1% and regionally rare OTUs when their average relative abundance at all stations were lower than 0.1% (Botnen et al., 2018).
Cluster analysis of the measured environmental parameters and morphospecies/OTU tables was performed using PRIMER V6 (Plymouth Marine Laboratory, UK). Prior to cluster analysis, the environmental parameters were fourth-root transformed, and the morphospecies/OTU tables were presence/absence transformed. SIMPROF analysis was used to detect the significance of differences between different clusters ( P set at 0.05). Moreover, the main environmental parameters that caused the dissimilarity between sample groups were identified using the SIMPER analysis in PRIMER v6. The relationship between the ciliate community composition and environmental parameters was estimated by the Mantel test using the “vegan” package in R. To illustrate the shared and unique genera identified by the three methods, a Venn diagram was generated using Venny 2.1. Rarefaction analyses at each station were conducted with the “fossil” and “vegan” packages in R to investigate the degree of sample saturation (Seimon et al., 2015). Prior to alpha and beta diversity comparison, the OTU table was randomly subsampled to the lowest number of ciliate sequences present in a sample (12 673 sequences).
3 RESULT
3.1 Environmental gradients along five stations
Among the five stations, the two stations (YC1 and YC2) in the YSCWM had a much greater water depth (52.0-52.6 m vs. 21.8-29.1 m) and distinctly lower bottom water temperatures (6.6-9.8 °C vs. 17.1-20.6 °C) than the three stations outside of the YSCWM (Table 1). The water salinity varied from 31 to 32, and the chlorophyll- a (chl-a) content varied from 0.4 to 0.7 μg/g at each station, and there were no distinct differences among the different compartments of the Yellow Sea and Bohai Sea.
The sediment water content, total nitrogen (TN), total organic matter (TOM) and pheophytin a (Ph a) concentrations were also higher at the two YSCWM stations than at the stations outside of the YSCWM (Table 1). Among the three stations outside of the YSCWM, station B2 differed from stations B1 and Y3, as the sediment water content, TN, TOM and Ph a of B2 were much higher than those of B1 and Y3, but the median grain size of B2 was much lower than that of B1 and Y3 (12.6 vs. 33.7-36.4 μm, respectively). The two YSCWM stations had low median grain sizes (10.4-13.7 μm) similar to the grain size of station B2 (Table 1). Generally, the environmental parameters of the two YSCWM stations were more similar than those of the three stations outside of the YSCWM, where B2 was distinguished from stations B1 and Y3, and the environmental parameters inside the YSCWM differed from those outside the YSCWM.
3.2 Species and OTU richness
A total of 79 morphospecies (abbreviated as species hereafter) of benthic ciliates were obtained by the morphological method. No planktonic ciliates (e.g., Choreotrichia and Oligotrichia) were observed in the protargol-impregnated preparations. The total number of species was on average 29, ranging from 19 to 47 at the five stations (Fig.2a). The ciliate abundance was on average 70 cells/cm3, ranging from 46 to 114 cells/cm3at the five stations (Fig.2b).
Rarefaction analyses indicated near-saturated sampling for all the DNA and cDNA samples (Supplementary Fig.S1). For DNA sequencing, a totalof 219 834 high-quality ciliate V4 reads were retrieved. The sequence number ranged between 32 458 (YC1) and 54 376 (YC2) (Fig.2b). Based on a clustering threshold of 97%, a total of 394 ciliate OTUs were obtained. The number of OTUs varied from 114 at station YC1 to 238 at station B1, with an average of 163 OTUs (Fig.2a).
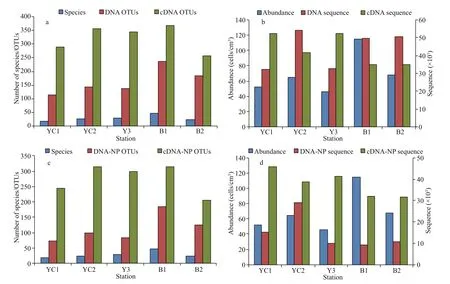
Fig.2 Sample statistics at f ive stations
For cDNA sequencing, a total of 215 975 highquality ciliate V4 reads were retrieved. A total of 705 ciliate OTUs were obtained. The number of OTUs varied from 256 at station B2 to 369 at station B1, with an average of 323 OTUs (Fig.2a).
DNA and cDNA sequencing detected planktonic ciliates belonging to both Choreotrichia and Oligotrichia, which accounted for approximately 66% and 12% of the total sequences, respectively. Among the top 10 most abundant OTUs, eight belonged to Choreotrichia and Oligotrichia and accounted for approximately 52% of the total sequences in the DNA dataset; in contrast, only two Choreotrichia and Oligotrichia OTUs accounted for approximately 6% of the total sequences in the cDNA dataset (Supplementary Table S1). After the removal of planktonic OTUs, a total of 303 and 611 OTUs from a total of 73 926 and 189 435 sequences were retained in the DNA and cDNA datasets, respectively (Fig.2c & d).
The Mann-Whitney U test showed that the species richness of either all data (including the planktonic OTUs) or only benthic ciliates detected by each pair of the three methods was significantly different ( P <0.01). Clustering analysis based on the relative abundance of each ciliate class/subclass showed that the morphological and cDNA sequencing methods clustered first and then grouped with the DNA sequencing method, whereas clustering analysis based on the OTU/species proportions of each ciliate class/subclass showed that the two molecular methods clustered first and then grouped with the morphological method (Supplementary Fig.S2).
3.3 Comparison of community composition
The spirotrichean subclasses Choreotrichia and Oligotrichia ciliates are predominantly planktonic forms in seas, although very few oligotrich species may inhabit marine sediments. Most (if not all) of the Choreotrichia and Oligotrichia sequences detected by DNA and cDNA sequencing originated from the sedimentation of pelagic forms (Fig.3, Supplementary Table S2). The aim of this study is to compare the eき ciency of the three approaches in revealing the diversity and community composition of benthic ciliates. Thus, we removed these planktonic forms from the following comparison of the benthic ciliate communities.
The morphological method detected eight classes, namely, Spirotrichea, Prostomatea, Litostomatea, Oligohymenophorea, Nassophorea, Phyllopharyngea, Karyorelictea and Heterotrichea. In contrast, DNA and cDNA sequencing detected three additional classes, namely, Plagiopylea, Colpodea, and Armophorea (Fig.3, Supplementary Table S3). The benthic ciliate communities were all dominated by Prostomatea, Oligohymenophorea, Spirotrichea and Litostomatea (Fig.3), which accounted for 82%, 77%, and 70% of the total species/OTU diversity in the morphological, DNA and cDNA datasets, respectively.
At the genus level, the morphological method identified only 27 genera, while DNA and cDNA sequencing detected 54 and 95 genera, respectively, from the five stations (Supplementary Fig.S3, Supplementary Table S4). Among them, only 11 genera were commonly detected by the morphological method and DNA and cDNA sequencing methods, accounting for on average 11%, 1%, and 5% of the total abundance, respectively. Notably, only one genus identified morphologically was detected by cDNA sequencing but not detected by DNA sequencing (Supplementary Table S4). In contrast, DNA and cDNA sequencing detected 42 common genera that were not identified morphologically at the five stations, where sequences related to the ciliate parasite Cryptocaryon (Holophryidae) with a sequence similarity of 94%±3% were the most abundant, accounting for on average 77% and 28% of the total sequences, respectively.
A total of 15 genera were only obtained by the morphological method, accounting for an average of 72% of the total cells. Among these, six genera lacked SSU rDNA sequences in the available database, including the most abundant Holophryidae genus Holophrya, which accounted for approximately 36% of the total cells. One genus with a relative abundance lower than 0.1% (rare taxon) was only detected by DNA sequencing. A total of 41 genera were only detected by cDNA sequencing, 39 of which were rare taxa (Supplementary Table S4).
3.4 Ciliate communities in relation to environmental parameters
Cluster analysis based on the measured environmental parameters clearly separated the five stations into two major groups: the YSCWM group and the group outside of the YSCWM (Fig.4a). SIMPROF analysis based on the environmental parameters showed that the two groups were significantly different ( P <0.05), and within the group outside of the YSCWM, station B2 was significantly different from the cluster of stations Y3 and B1 ( P <0.05; Fig.4a). SIMPER analysis showed that water depth was the most important environmental factor causing the dissimilarity between the two major groups (Table 2).
Cluster analysis based on the morphological communities that combined two replicates at each of the five stations showed a similar pattern as the analysis based on environmental parameters, but the difference exhibited by SIMPROF analysis was not statistically significant (Fig.4b). The pattern became chaotic when cluster analysis based on individual replicates was performed: the two YSCWM stations YC1 and YC2 were separated, and the two replicates of station Y3 even merged into different clusters (Fig.4c).
Cluster analyses of the DNA dataset showed a rather different pattern from the results of both the morphological community and environmental analyses. When the planktonic forms were included in the analyses, the two YSCWM stations were separated into different clusters based on both the total and the regionally abundant OTU communities (Fig.5a & b), while the non-YSCWM station Y3 clustered with the two YSCWM stations based on the regionally rare OTU communities (Fig.5c). When planktonic forms were excluded from the analyses, the non-YSCWM station Y3 clustered with the two YSCWM stations based on both the total and regionally abundant communities (Fig.5d & e), while the pattern based on the regionally rare OTU communities became chaotic because the two replicates of station B2 were separated into different clusters (Fig.5f).
In contrast, cluster analyses of the cDNA dataset showed a consistent pattern, which matched well with the results of the cluster analysis of environmental parameters, based on the total, regionally abundant, or rare OTU communities (Fig.6a-c). Moreover, the pattern remained unchanged when the planktonic forms were excluded from the analysis (Fig.6d-f). SIMPROF analysis showed significant differences among all clustered groups ( P< 0.05).
The Mantel test showed that both all OTUs( R= 0.82, P= 0.017) and only the benthic OTU communities ( R= 0.76, P= 0.042) detected by cDNA sequencing had significant correlations with the environmental parameters. A similar significance was obtained between the morphological communities and the environmental parameters ( R= 0.62, P= 0.033). There was no correlation between any of the OTU communities detected by DNA sequencing and the environmental parameters (all communities and the benthic communities: both R=0.59, P=0.092).
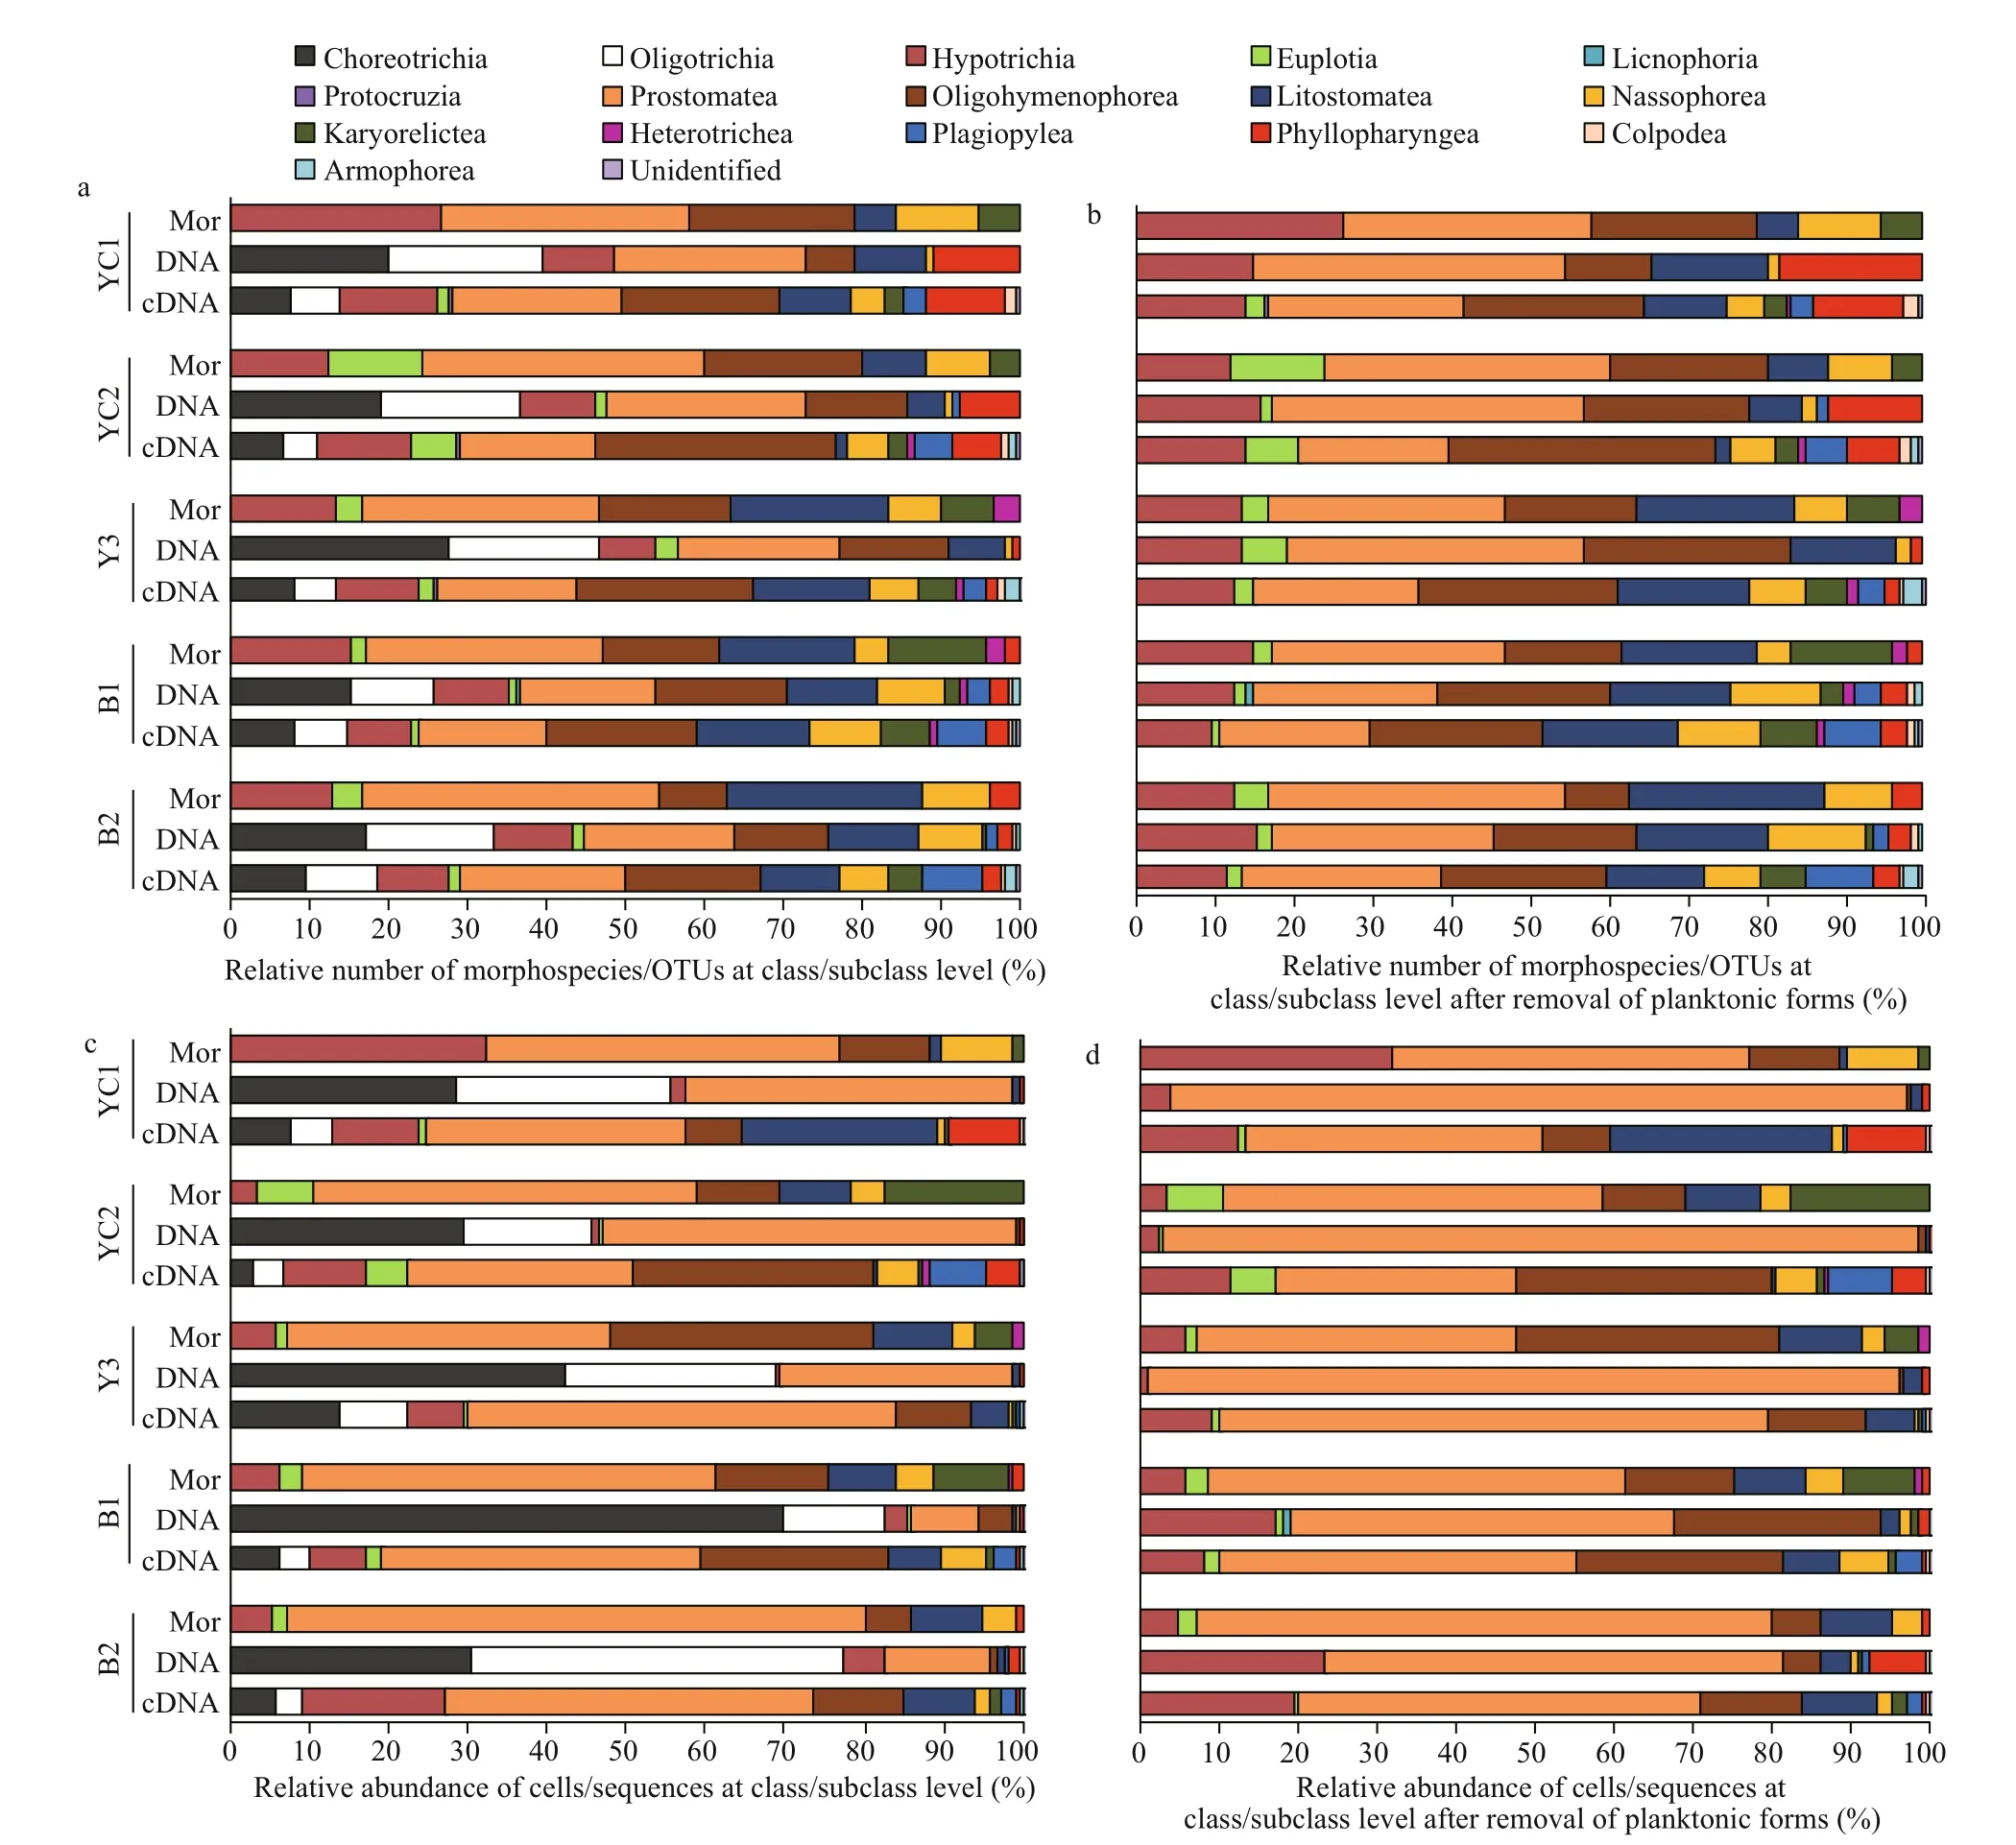
Fig.3 Relative number of morphospecies/OTUs and relative abundance of cells/sequences at classes/subclasses level detected by morphological (Mor), DNA and cDNA sequencing methods

Table 2 SIMPER analysis based on the environmental parameters inside and outside of the Yellow Sea Cold Water Mass

Fig.4 Cluster analyses based on the environmental parameters (a) and the communities detected by morphological observation (b, combining two replicates; c, with individual replicates)
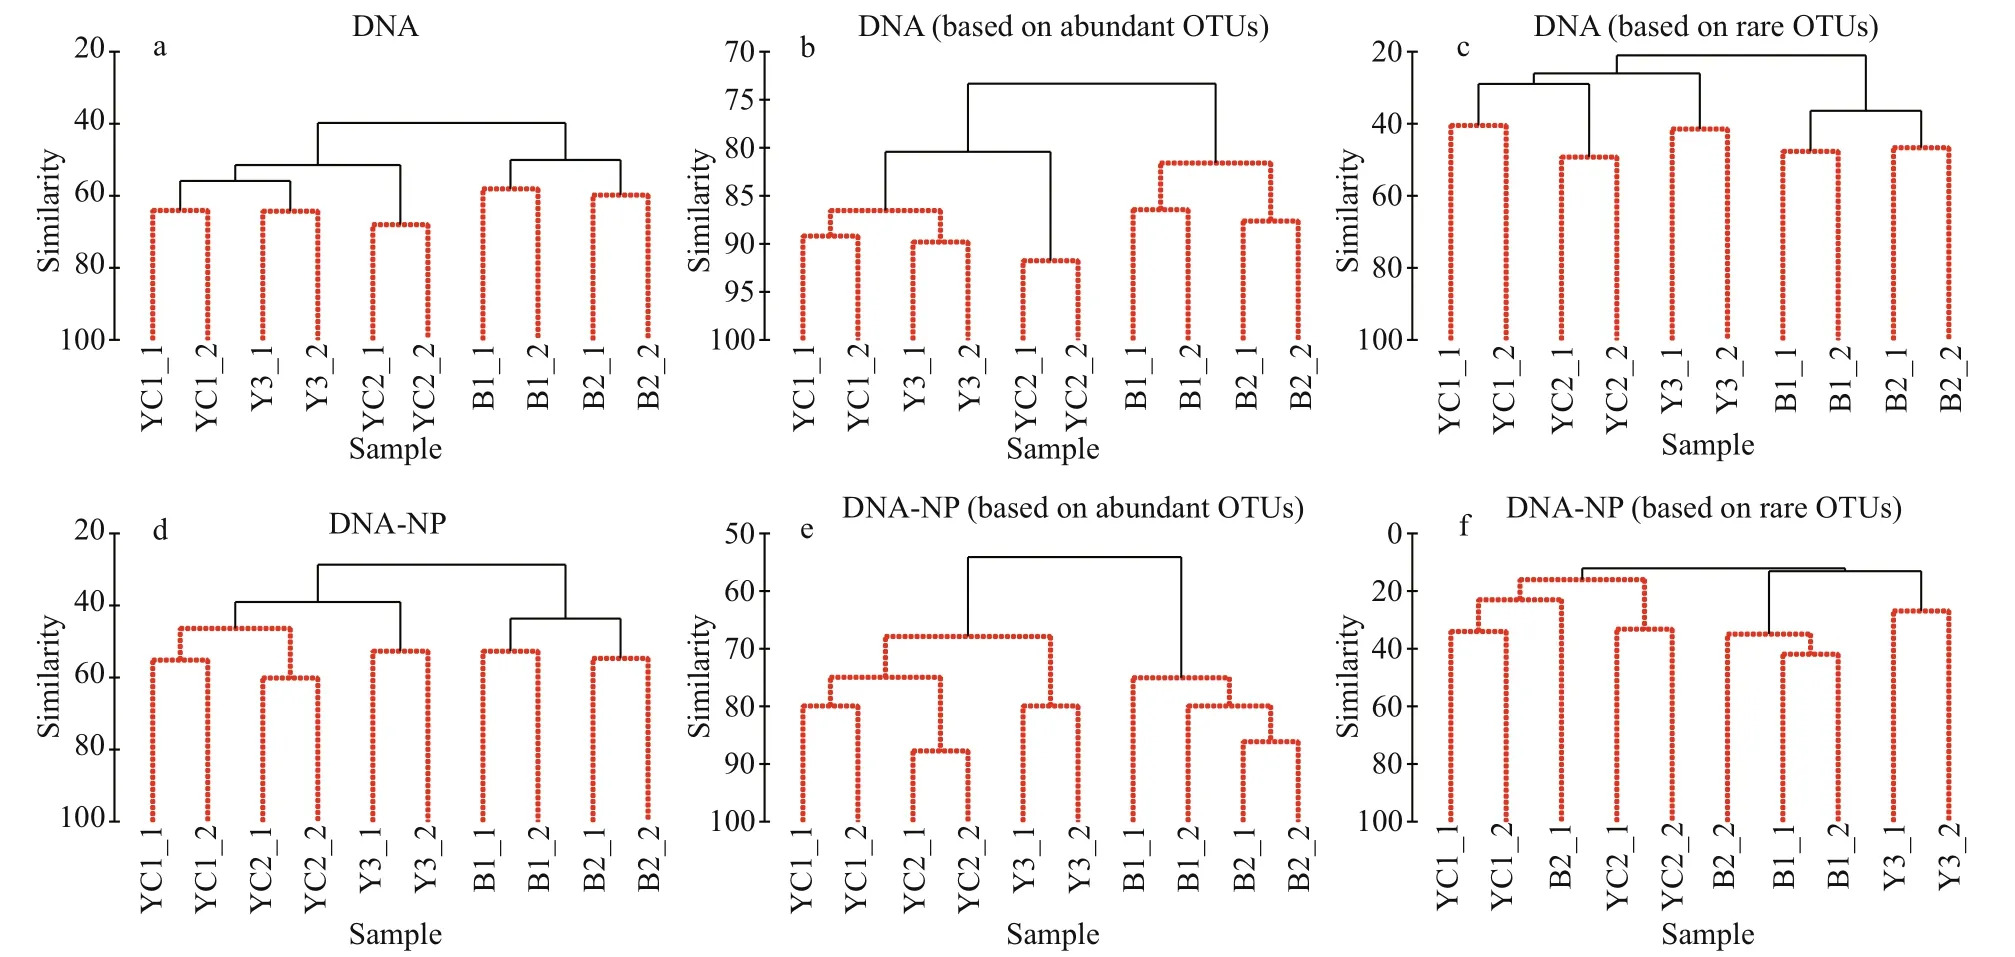
Fig.5 Cluster analyses based on total (a and d), regionally abundant (b and e) and rare (c and f) communities detected by DNA sequencing before and after removal of planktonic forms
4 DISCUSSION
4.1 Methodological limitation in assessing benthic ciliate diversity
The estimation of protist diversity by morphological methods may be hampered by several shortcomings. First, cells of some fragile protist taxa are easily broken during the process of sample collection, fixation and preparation for microscopy observation (Sonntag et al., 2000). Second, the estimation of protist diversity is often hampered by taxonomic impediments. It is assumed that at least two-thirds of marine protists, including ciliates, are undescribed, particularly geographically rare species, which constitute the major proportion of diversity (Appeltans et al., 2012). This is supported by the molecular detection of ciliates from marine sediments, in which rare OTUs accounted for more than 70% of the total OTUs (Zhao and Xu, 2016, 2017). Third, undersampling is a common problem in alpha diversity investigations. Previous morphological studies on ciliates in offshore sediments were mainly based on the Uhlig method (Azovsky and Mazei, 2018), which may result in an underestimation due to differences in the behavioral responses of ciliates to temperature and salinity gradients and fixatives and protargol staining methods (Meng et al., 2012; Zhou and Xu, 2016). Examination of species numbers in the cultures of samples over time could provide robust insight into the total ciliate species richness (Esteban and Finlay, 2007). However, the ciliates in offshore sediments are diき cult to culture, and the diき culty in estimating their diversity increases with increasing water depth; furthermore, ciliates in continental shelf to deep-sea sediments are largely unknown (Hausmann et al., 2002).
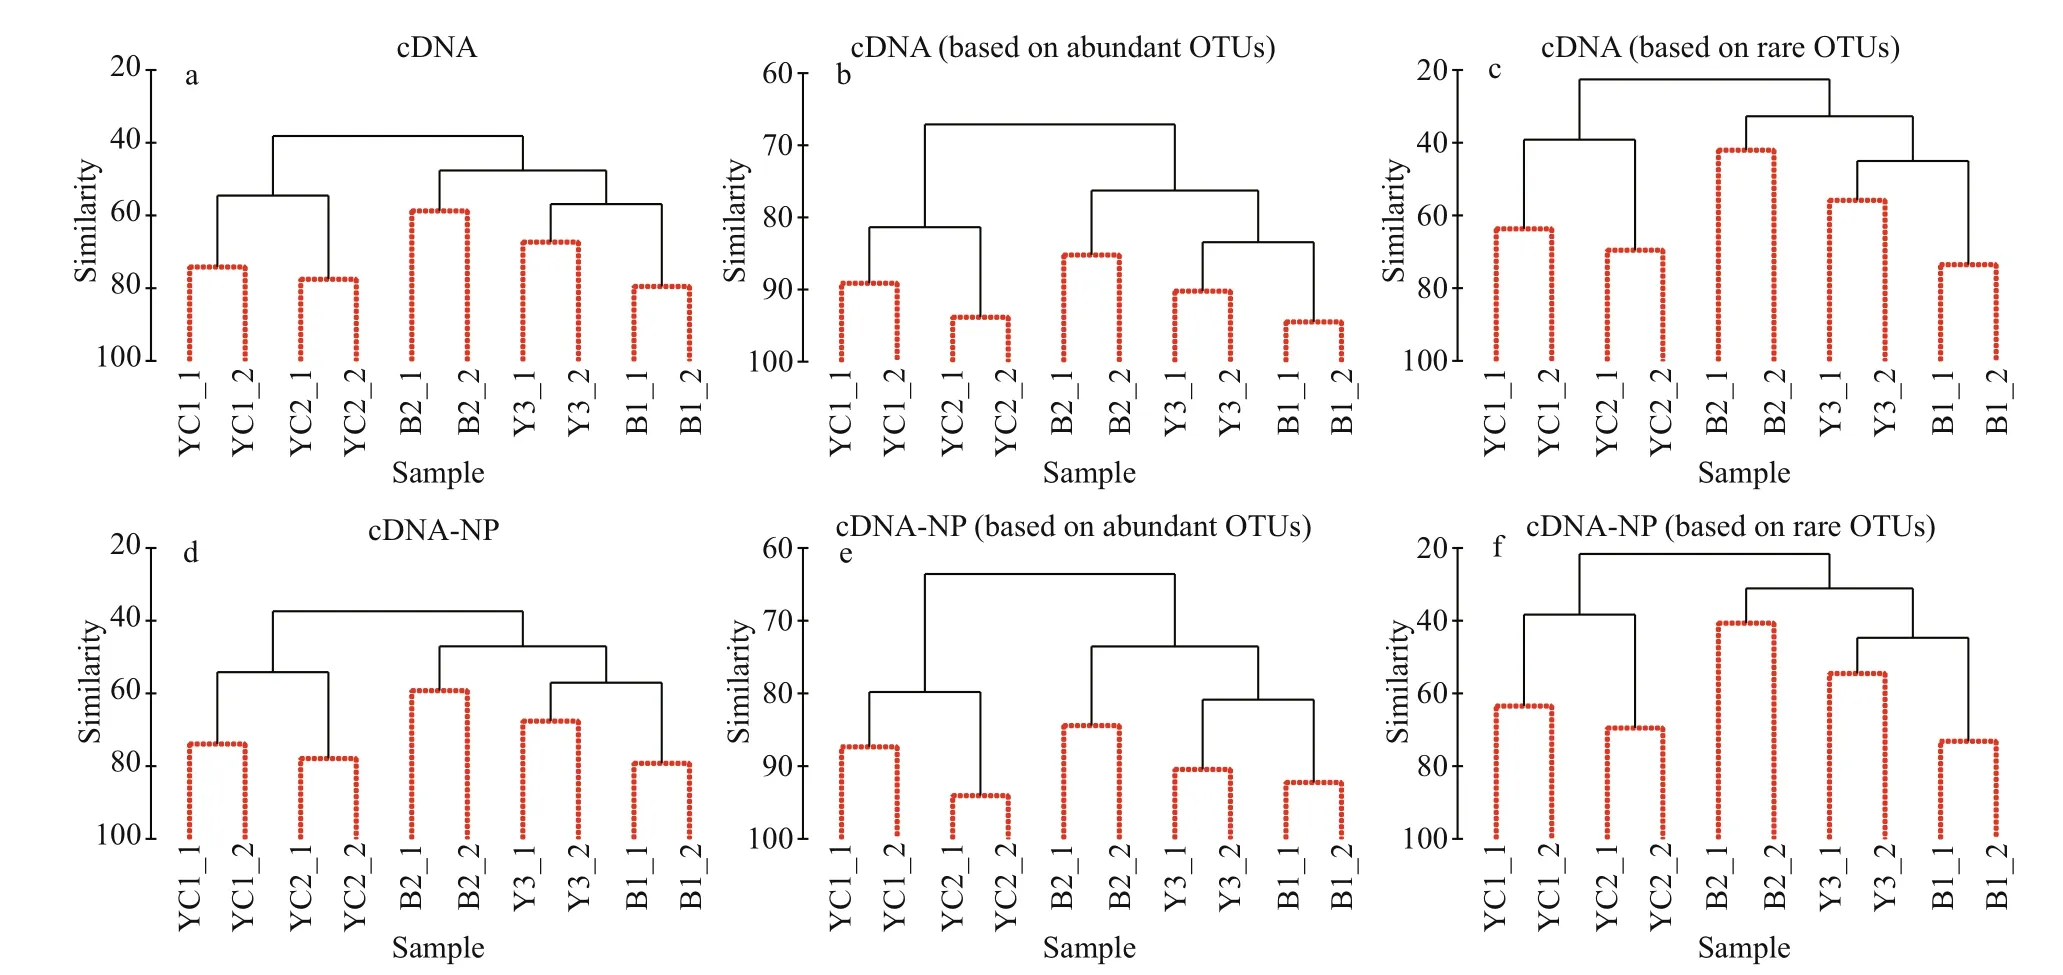
Fig.6 Cluster analyses based on total (a and d), regionally abundant (b and e) and rare (c and f) communities detected by cDNA sequencing before and after removal of planktonic forms
Molecular methods overcome most of the above disadvantages, particularly in the detection of rare protist species (Santoferrara et al., 2014). In the present and previous studies, a much higher diversity of protists, particularly ciliates, was uncovered by DNA high-throughput sequencing than by the taxonomy-based method (Bachy et al., 2013; Santoferrara et al., 2014; Stoeck et al., 2014; Malviya et al., 2016; Groendahl et al., 2017; Li et al., 2019). However, DNA sequencing detects not only active organisms but also historic DNA, particularly in shallow-sea sediments (Torti et al., 2015). In our study, DNA sequencing detected approximately 66% of the total sequences belonging to Choreotrichia and Oligotrichia, most of which obviously originated from the sedimentation of planktonic forms on the continental shelf. The accumulation of historic DNA may influence the recovery of rare species due to their poor amplification eき ciency (Gonzalez et al., 2012; Abad et al., 2016). Stokell et al. (2016) indicated that an increase in the absolute abundance of dominant organisms results in a decrease in the number of taxa detected by DNA sequencing, especially rare taxa. Our study showed that some rare taxa, e.g., Pleuronema, Holosticha, Loxophyllum, and Litonotus, which were detected by both morphological and cDNA sequencing approaches, could not be uncovered by DNA sequencing at certain stations (Supplementary Table S4). Similar findings were obtained from a survey of deep-sea foraminifera (Lejzerowicz et al., 2013). Moreover, the high SSU rRNA gene copy number for some planktonic ciliates might also reduce the amplification eき ciency of rare taxa by DNA sequencing. For example, the SSU rRNA gene copy number in a planktonic Strombidinopsis sp. (30 247) is approximately nine times higher than that in a periphytic Zoothamnium sp. (3385) (Gong et al., 2013). As a result, no Zoothamnium sequence was obtained by DNA sequencing, while three Zoothamnium sequences were obtained by cDNA sequencing in this study (Supplementary Table S1).
Nevertheless, insuき cient sequence data constitute an obstacle to assessing the accurate diversity and distribution of protists. Our study showed that approximately 40% of the genera that were exclusively observed by microscopy had no matched sequences in the reference sequence databases (e.g., NCBI). The limits of the reference database hampered the assignment of individual OTUs to species or even genera. For instance, the most abundant Holophrya species identified by morphology could not be uncovered by molecular approaches, largely due to the absence of Holophrya sequences in the databases. Under such circumstances, these sequences could be randomly blasted against the most related parasitic genus, Cryptocaryon, which constituted the most abundant genus in both the DNA and cDNA benthic datasets. In addition, the hypervariable V4 region of the SSU rRNA gene used for markers is conservative, which may decrease the precision of assignments to species or even genera (Zhao et al., 2016). Stoeck et al. (2014) even showed that the V4 fragments of some planktonic ciliates, such as Pseudomonilicaryon and Pelagodileptus, were identical. In the future, more efforts should be made to link the sequences to a real inventory of microbial eukaryotes. Moreover, comparisons between the relative ciliate abundances determined by molecular and morphological methods may be highly affected by the large variation in the rDNA copy number among species (Prokopowich et al., 2003; Gong et al., 2013).
4.2 Advantages of cDNA sequencing for assessing ciliate diversity
The cDNA sequencing method has been shown more effective than the DNA sequencing method in detecting the protist diversity of active taxa (Lejzerowicz et al., 2013; Xu et al., 2017). In our study, the DNA and cDNA sequencing approaches gave a similar view of the taxonomic composition of the benthic ciliate community (Supplementary Fig.S2b & d; Fig.3a & b). Molecular methods have a great advantage in detecting rare taxa in comparison with morphological methods. These rare taxa contributed to more than half of the total OTUs, and as a result, the taxonomic compositions detected by the two molecular methods were more similar with each other than with the taxonomic composition detected by the morphological method. Theoretically, DNA sequencing should obtain a higher diversity of taxa than cDNA sequencing because the former approach detects not only active forms but also non-existent taxa recruited from historic DNA (Stoeck et al., 2007; Lejzerowicz et al., 2013; Xu et al., 2017). In this study, however, cDNA high-throughput sequencing uncovered a much higher diversity of benthic ciliates than DNA sequencing. A similar result was also obtained for foraminifera in deep-sea sediments (Lejzerowicz et al., 2013). We have two possible explanations for this apparent contradiction. First, the high amount of historic DNA in sediments might reduce the eき ciency of DNA sequencing in detecting active rare taxa. This is clearly shown by the present study, in which 55 of the 95 genera detected by cDNA sequencing were rare taxa with an average relative abundance lower than 0.1%, while most of these genera were missed by DNA sequencing. Second, differences in the sample size used for the cDNA and DNA examinations might partially explain the different diversities recovered. According to the requirements of the different isolation kits, a larger sample size was used for cDNA sequencing (2 g) than for DNA sequencing (0.9 g) in our study. Previous studies have shown that the number of species/OTUs will increase with increasing sample size (Dolan and Stoeck, 2011; Penton et al., 2016; Nascimento et al., 2018).
The community structure of the cDNA sequencing approach was more similar than that of the DNA sequencing approach to the community structure of the morphological method, particularly for the dominant groups/classes (Fig.3c). Cluster analysis based on the relative abundance of each ciliate class/subclass indicated the datasets of the morphological and cDNA sequencing methods grouped together (Supplementary Fig.S2a & c). Both cDNA sequencing and morphological methods detected Prostomatea as the most dominant ciliate group in this study, which is consistent with previous studies based on morphological methods (Meng et al., 2012; Zhou and Xu, 2016). In contrast, the most dominant group detected by DNA sequencing was composed of the planktonic Choreotrichia and Oligotrichia, which might be attributed to extracellular DNA and their high copy number for the SSU rRNA gene. The cDNA sequencing approach could overcome most of the problems associated with extracellular DNA, as well as variations in the SSU rRNA gene copy number (Orsi et al., 2013; Xu et al., 2017; Jing et al., 2018). This was confirmed by the finding that the proportions of planktonic ciliate sequences (12% vs. 66%) and OTUs (13% vs. 23%) detected by cDNA sequencing were much lower than those detected by DNA sequencing. Compared to DNA, RNA is much less stable and degrades quickly (Karl and Bailiff, 1989; Wang et al., 2019); consequently, the RNA-based method may detect the community of active taxa. However, Novitsky (1986) showed that approximately 30%-40% of RNA was preserved after 14 days. On the other hand, cDNA sequencing may also detect ciliates capable of cyst formation in sediments, where rRNA could survive in cysts and be preserved for a long period in certain environmental conditions (Orsi et al., 2013; Tang et al., 2019). These results likely explain why there was a high proportion of Choreotrichia and Oligotrichia in sediments detected by cDNA sequencing.
4.3 cDNA sequencing revealed a distinct distribution pattern along hydrographic gradients
Based on cluster analysis of the environmental parameters, we clearly separated the five stations into two significantly different groups: the YSCWM group and the non-YSCWM group. Previous studies have shown that the YSCWM, which is characterized by low water temperature and high salinity in water bodies deeper than 40 m, results in a distinctly different distribution of both meiobenthic and macrobenthic communities inside and outside of the YSCWM (Liu et al., 2007; Zhang et al., 2012). However, a limited number of past studies did not reveal such a pattern for microbenthic ciliate communities (Meng et al., 2012; Zhou and Xu, 2016). In this study, cluster analysis based on the ciliate communities examined by microscopy showed a similar pattern as the pattern of environmental parameters, but there was no statistically significant difference between stations inside and outside of the YSCWM. No clear pattern was revealed by the DNA sequencing approach.
In contrast, cluster analysis based on the cDNA dataset revealed a distinct pattern consistent with that of the environmental parameters. The Mantel test showed that the correlation between the ciliate communities revealed by cDNA sequencing and environmental parameters was statistically significant. The pattern remains unchanged when analyzed with the total, abundant, or rare OTU communities. Moreover, the inclusion and exclusion of planktonic forms in the analysis did not change the results, and SIMPROF analysis showed significant differences among all cluster groups.
The advantages of cDNA sequencing in revealing the distribution pattern of benthic ciliates could be attributed to its eき ciency in the detection of rare taxa (Zhao and Xu, 2016, 2017). Rare taxa are considered the key groups to explain the variations in communities under various environmental conditions but are easily overlooked or misidentified by microscopy-based methods (Foissner, 2008). The diき culty in identifying rare species may bias diversity measures and distribution patterns. Compared to DNA sequencing, the cDNA sequencing approach could limit the influence of historic DNA on the recovery of rare species, as discussed above. The data indicate that the distribution of benthic ciliate communities in the Yellow Sea follows the distinct pattern of meiobenthos and macrobenthos. Both DNA sequencing and taxonomy-based approaches failed to uncover such a pattern.
5 CONCLUSION
Our research indicates that the choice of assessment approach has a significant impact on the estimation of the benthic ciliate community and highlights that cDNA high-throughput sequencing has great advantages in assessing the diversity and distribution of ciliates in marine sediments. Extracellular DNA and DNA from dead cells have a notable effect on the estimation of marine benthic diversity, particularly for rare taxa when using DNA sequencing. The ciliate community structure revealed by cDNA sequencing was more similar than that revealed by DNA sequencing to the morphologically identified ciliate community structure. The coincidence of the environmental parameters and ciliate community composition revealed by cDNA sequencing demonstrates the capability of the cDNA sequencing approach for environmental assessment.
6 DATA AVAILABILITY STATEMENT
The datasets generated and/or analyzed during the current study are available from the corresponding author on reasonable request.
7 ACKNOWLEDGMENT
We thank Drs. MENG Zhaocui, CHEN Xumiao, and LI Ju for their assistance in the identification of morphospecies, and Dr. ZHAN Zifeng and Miss. WEI Miao for their aids in the sample collection.
 Journal of Oceanology and Limnology2021年1期
- Journal of Oceanology and Limnology的其它文章
- Influence of sequential tropical cyclones on phytoplankton blooms in the northwestern South China Sea*
- Simulated perturbation in the sea-to-air flux of dimethylsulfide and the impact on polar climate
- Performance of ecological restoration in an impaired coral reef in the Wuzhizhou Island, Sanya, China*
- Investigating factors driving phytoplankton growth and grazing loss rates in waters around Peninsular Malaysia
- Effects of oxytetracycline dihydrate and sulfamethoxazole on Microcystis aeruginosa and Chlamydomonas microsphaera*
- Reproductive cycle of Ophiopholis mirabilis (Echinodermata: Ophiuroidea) in Zhangzi Island area, northern Yellow Sea*
