The relationships among structure variables of larch forests in China
Wenjing Fang ,Qing Zhao,Qiong Cai,Anwar Eziz,Guoping Chen,Yuhao Feng,Heng Zhang,Jiangling Zhu,Chengjun Ji,Zhiyao Tangand Jingyun Fang
Abstract
Keywords:Larch forests,Stand factor,Allometric relationship,Power function,Density effect and self-thinning
Background
Forest structure variables are closely related to forest productivity and dynamics(Enquist et al.2009;Fang et al.2012a,2012b;Ali 2019).Local and regional studies have illustrated that different structure variables, such as stem density,tree height,diameter at breast height(DBH),taper(the ratio of average DBH to average height),and slenderness(a quotient related to taper),were strongly correlated with each other, mostly showing allometric relationships,such as those between tree height and DBH, stem density and average DBH, and stem density and taper (Wang et al. 1998; Falster and Westoby 2005; Li et al. 2006;Pretzsch 2006;Comeau et al.2010;Rivoire and Moguedec 2012;Masaka et al.2013;Duncanson et al.2015).
In particular, stand stem density significantly affects the structure variables of forests, according to the selfthinning theory (Reineke 1933; Kira et al. 1953; Satoo 1962; Yoda et al. 1963; Tadaki 1964; Drew and Flewelling 1977, 1979; Westoby 1984; Xue and Hagihara 1999, 2001;Enquist and Niklas 2001; Xue et al. 2015; Zhou and Lin 2018). During the self-thinning processes, the plant individual size increases and stem density decreases,following a negative linear model when both stem density and plant size were logarithm transformed, i.e., lnN ~-1.605lnDa,where N and Daare stem density and average DBH, respectively (Reineke 1933). Several hypotheses have been proposed to explain the negative relationship. Among them, the −3/2 self-thinning rule (or, the Yoda’s law) is the most acknowledged theory, which proposed a −3/2 power function relationship between the mean biomass and stem density based on the geometric similarity theory(i.e., Ba∝N−3/2, where Bais average biomass) (Yoda et al.1963). The self-thinning rule has been tested by several studies, e.g., West et al. (1997, 1999) and Enquist et al.(1998), who used metabolic scaling theory to explain selfthinning from the viewpoint of bioenergetics.As proposed by the metabolic scaling theory, the exponent between stem density and plant size was −2,and that between biomass and stem density was −4/3, respectively (i.e., N ∝Da−2,and Ba∝N−4/3)(West et al.1997,1999;Enquist et al.1998). In addition to the biomass and plant size, the stem density also influenced the taper of the tree stems (Dean and Baldwin 1996; Dean et al. 2002; Sharma and Zhang 2004; Sharma and Parton 2009). However, little is known about the influence of stem density on the taper (Sharma and Zhang 2004;Sharma and Parton 2009).
Similar to the relationship between stem density and plant size, many models have also been proposed to fit the relationship between tree height and DBH for different species,even for different populations within a species (Navroodi et al.2016).Among these models,the power function and its extended forms were most commonly employed (Ogawa 1969; Fang et al. 1993; Falster and Westoby 2005; Wang et al. 2006). Some suggested a constant exponent for this model across different species which is expected to be 2/3 for adult trees (King et al. 2009), and some argued that the exponents may vary among different taxonomic groups(such as between angiosperms and gymnosperms) and life forms(such as between evergreen and deciduous plants) (Hulshof et al.2015).
Larches (Larix Mill.) are light-demanding coniferous species tolerant to low-temperature, which were widely distributed in cool-temperate zones and in mountainous areas of temperate northern hemisphere,and they serve as timberline species in many mountains in northern, southwestern, and northeastern China (Cheng and Fu 1978; Li 1995; Liu et al.2002a,2002b;Li et al.2009).In China,larch species generally form pure forests with large areas,and parts are mixed with other needle-leaved trees(Cheng and Fu 1978).Larch forests are sensitive to changes in climatic factors, such as temperature and water availability(Wu 1980;Cui et al.1999;Carrer and Urbinati 2006;Dulamsuren et al.2008).Although some studies on the community structure and allometric relationships have been performed in some larch forests at local scales (Wang et al. 2006; Fang et al. 2012b; Liu et al.2017; Usoltsev et al. 2019), knowledge of their community structures and allometric relationships at the national scale is still lack in China.
Here, we explored the relationships among different structure variables of larch forests, i.e., between tree height and DBH, between average DBH and stem density, and between taper and stem density, based on field measurements of natural larch forests across China. Specifically, we attempt to answer the following questions:(1) what are the relationships among different structure variables of larch forests, and (2) are these relationships consistent across the range of observed larch forest types in China?
Methods
Study species and area
According to the Flora of China (http://foc.iplant.cn/),there are 11 species and 3 varieties of Larix in China, including 2 cultivated species (L. decidua and L. kaempferi). According to the morphological and genetic features, these species can be grouped into two sections,i.e. Sect. Larix and Sect. Multiseriales (Cheng and Fu 1978; Wei and Wang 2003). Except for L. decidua, the larches constitute the dominant species of larch forests in different areas of China.
In this study, we investigated natural larch dominated forests distributed in mountainous areas with latitudes of 27.10°-52.86° N, longitudes of 85.14°-128.41° E, and elevations of 387-4317 m (Fig. 1; Table S1), each with an area of 600 m2. The plots were selected to present natural forests without any apparent human disturbance such as thinning or harvesting, or natural disturbance such as fire or storm. For each plot, the species name,height and DBH of each tree were recorded (for details of the investigation methods, see Fang et al. 2009). In total, we investigated 155 plots with 9722 larch individuals and 1191 other trees, each contained more larch than other tree stems, with a larch stem density of more than 500 individuals per ha. These plots included 11 larch forest types, from two sections, i.e., Sect. Larix forests including L. gmelinii, L. gmelinii var. principis-rupprechtii, L. olgensis and L. sibirica forests, and Sect.Multiseriales forests including L. griffithii, L. himalaica,L. mastersiana, L. potaninii, L. potaninii var. australis, L.potaninii var. chinensis and L. speciosa forests. Thereinto,the plot numbers of L.olgensis,L.griffithii,L.himalaica, L. mastersiana, L. potaninii, and L. speciose forest were less than 10 (Table S1).
On average, the tree species richness, larch stem density, tree stem density and total basal area proportion of larch were 2.3, 1151.0 stems per ha, 1292.3 stems per ha and 93.0%, respectively (Table S1). Given that larch trees were dominant in these plots, structure variables such as stem density were not limited by plot area, and the tree richness of plots were relatively low (Table S1), we used the dominant species density (i.e., larch density) to study the density effect of larch forests in China and did not consider the effects of other tree species.
Data analysis
According pervious research (Wang et al. 1998; West et al.1999;Wang et al.2006),we defined taper(T,cm∙m−1)as the ratio of average DBH(Da,cm)to average height(Ha,m)in a plot (Eq. 1), and slenderness (S, m∙m−1) as one hundred times the ratio of Hato Dain a plot(Eq.2).
The following functions were applied to fit the relationship between height (H) and DBH (D) of trees (Eq. 3),average DBH (Da) and stem density (number of stems in a unit area, N) of plots (Eq. 4), and taper (T) and stem density of plots (Eq. 5).
where b, d and f are power exponent parameters and a,k and e are the proportionality constant parameters.
Many approaches have been proposed to fit the relationships between forest structure variables with logarithmically transformed data, such as ordinary least square regression (OLS), dimensionality reduction analysis, and quantile regression (QR) (Cade et al. 1999;Wilson et al. 1999; Li et al. 2006; Sun et al. 2010a). Here,all data were logarithmically transformed, parameters were estimated by OLS, and the relationship between tree height and DBH (Eq. 3) was also fitted with standard major axis regression (SMA). QR, with quantiles of 50%, 75% and 95%, was employed to study the effect of stem density on average DBH and taper. The Eqs. 1-5 were calculated by individual larches per plot, respectively. For the 11 larch forest types, we calculated average structure variables, such as stem density, average DBH,average height, taper and slenderness, based on individual larch stem average of plot (Table S2). We compared the structure variables of different larch forest types by analysis of variance (ANOVA) and multiple comparisons with Bonferroni test, and marked the difference with letters.
Based on general linear model (GLM) and stepwise regression, we analyzed the effects of forest type, site and climatic factors on different structure variables of the larch forests. The site factors include longitude, latitude and altitude. The climatic factors are moisture index(MI, mm), mean annual temperature (MAT, °C), mean temperature of the warmest month (MTWM, °C) and coldest month (MTCM, °C) (for details on the climatic factors, see Table S3). According to Thornthwaite(1948), the MI is an index reflected the relationships among potential evapotranspiration, moisture surplus and moisture deficiency.
All statistical analyses were performed in R (version 3.5.0) (R Core Team, 2018) with the “smatr” and “quantreg” packages (Warton et al. 2012;Koenker 2018).
Results
Statistics of the structure variables
The overall mean stem density,DBH,height,taper,and slenderness of larch forests in China were 1151.0 stems per ha(standard deviation SD=590.5), 16.5 cm (SD=5.0), 12.0 m(SD=4.3), 1.5 cm∙m−1(SD=0.6) and 75.6 (SD=27.4), respectively(Fig.2;Table S2).With an average of 1287.6 stems per ha in stem density, 16.7 cm in DBH, 13.6 m in height,1.3 cm∙m−1in taper and 86.1 in slenderness, the Sect. Larix forests were denser,higher and slenderer than the Sect.Multiseriales forests (Fig. 2; Table S2). The structure variables varied significantly among larch forest types (Fig. 2). The stem density of the L. gmelinii forest was larger than that of the other Sect. Multiseriales forests, except the L. himalaica forest (Fig. 2a). The DBH of the L. potaninii var. chinensis forest was bigger than that of the L. gmelinii, L. griffithii, L.himalaica and L.potaninii forests(Fig.2b).Most Sect.Larix forests was taller, while the taper was smaller, than that of the Sect. Multiseriales forests (Figs. 2c and d). The slenderness of the Sect.Multiseriales forests was bigger than 100,especially for L.gmelinii forest(Fig.2e).

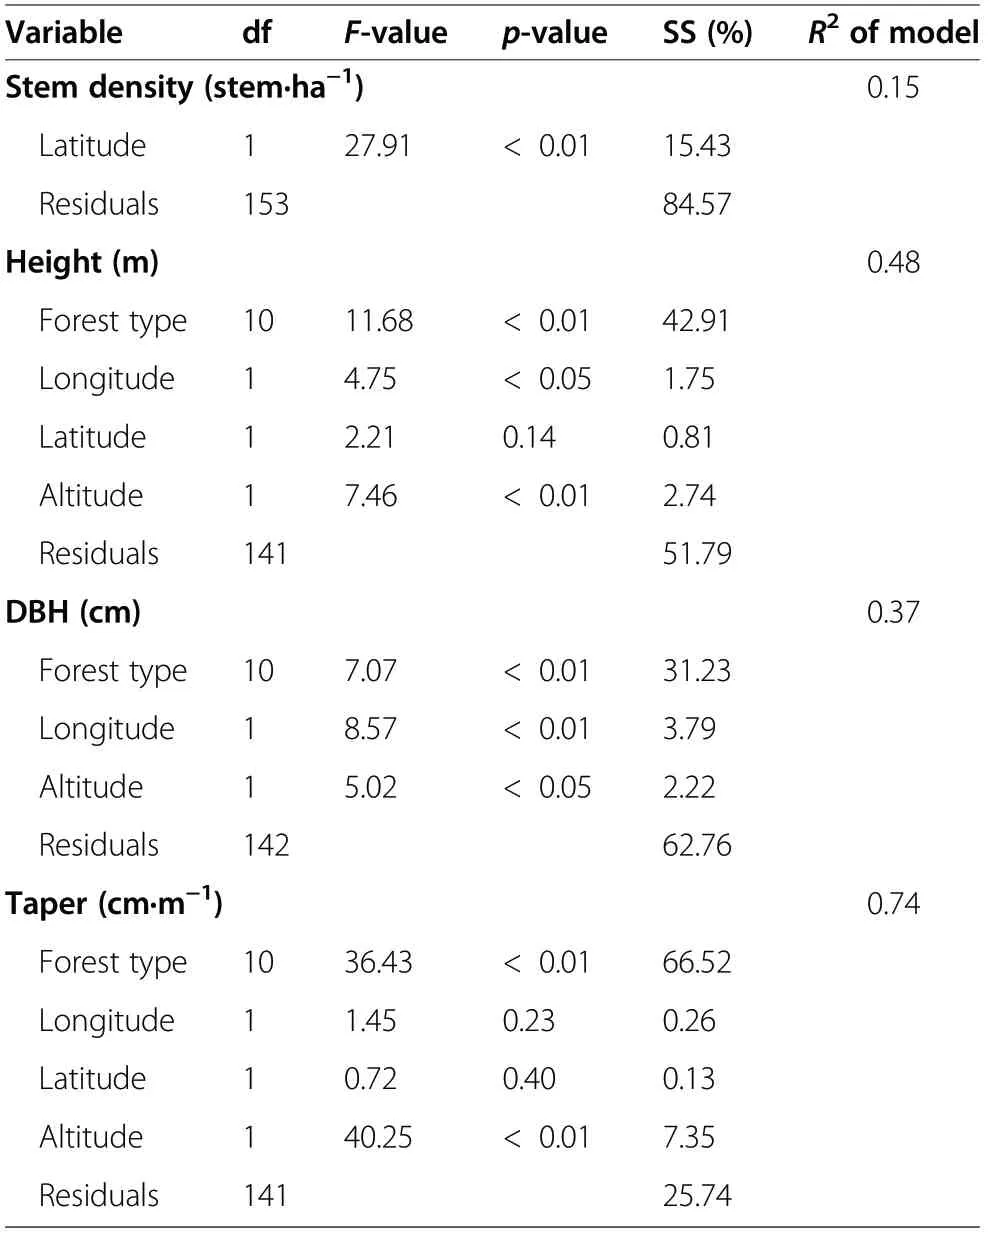
Table 1 The best regression model selected by forward stepwise regression for the structure variables of larch forests in China
Factors impact the structure variables
The GLM and stepwise regressions illustrated that forest type and site were the dominant factors influencing the structure variables (Table 1). Forest type was the most important factor for mean tree height (explaining 42.91% of the variation), DBH (31.23%), and taper(66.52%) (Table 1). The site variables only accounted for a minor part of the variations: e.g., altitude explained 2.74% for tree height, 2.22% for DBH, and 7.35% for taper, while latitude explained as high as 15.43% for stem density (Table 1).
Relationship among different structure variables
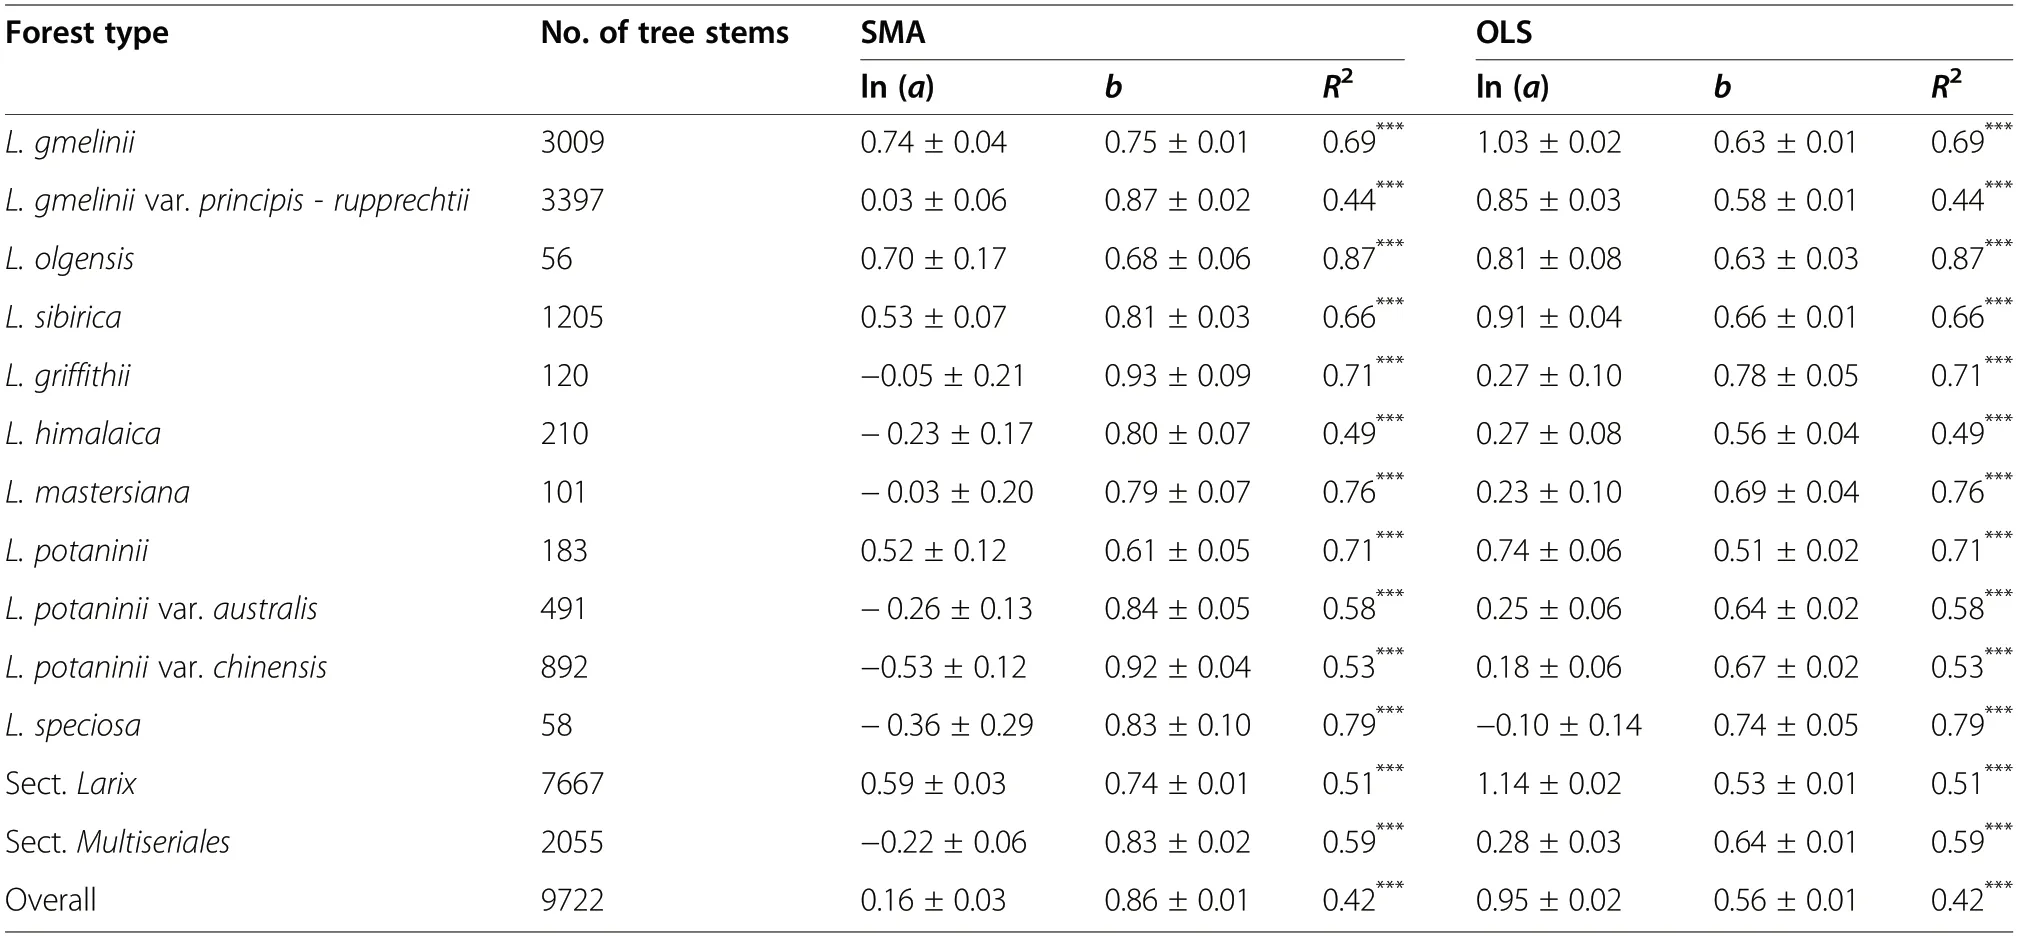
Tree height and DBH showed a power function relationship(Fig. 3;Table 2).The SMA b-exponent between tree height and DBH was 0.86 (standard error=0.01) for overall plots, and it varied markedly among different larch forest types, with a range between 0.61 (L. potaninii forest) and 0.93 (L. griffithii forest); and the OLS bexponent was 0.56 (standard error=0.01) for overall plots, with a range of 0.51 (L.potaninii forest) to 0.78 (L.griffithii forest) (Table 2). The allometric relationships between height and DBH varied remarkably among larch forest types (Table S4). For example, both intercepts and slopes by SMA were significantly different among larch forest types (Fig. S1). In general, the b-exponents of the Sect. Multiseriales forests (SMA 0.83 and OLS 0.64)were greater than those of the Sect. Larix forests (SMA 0.74 and OLS 0.53) (Table 2).
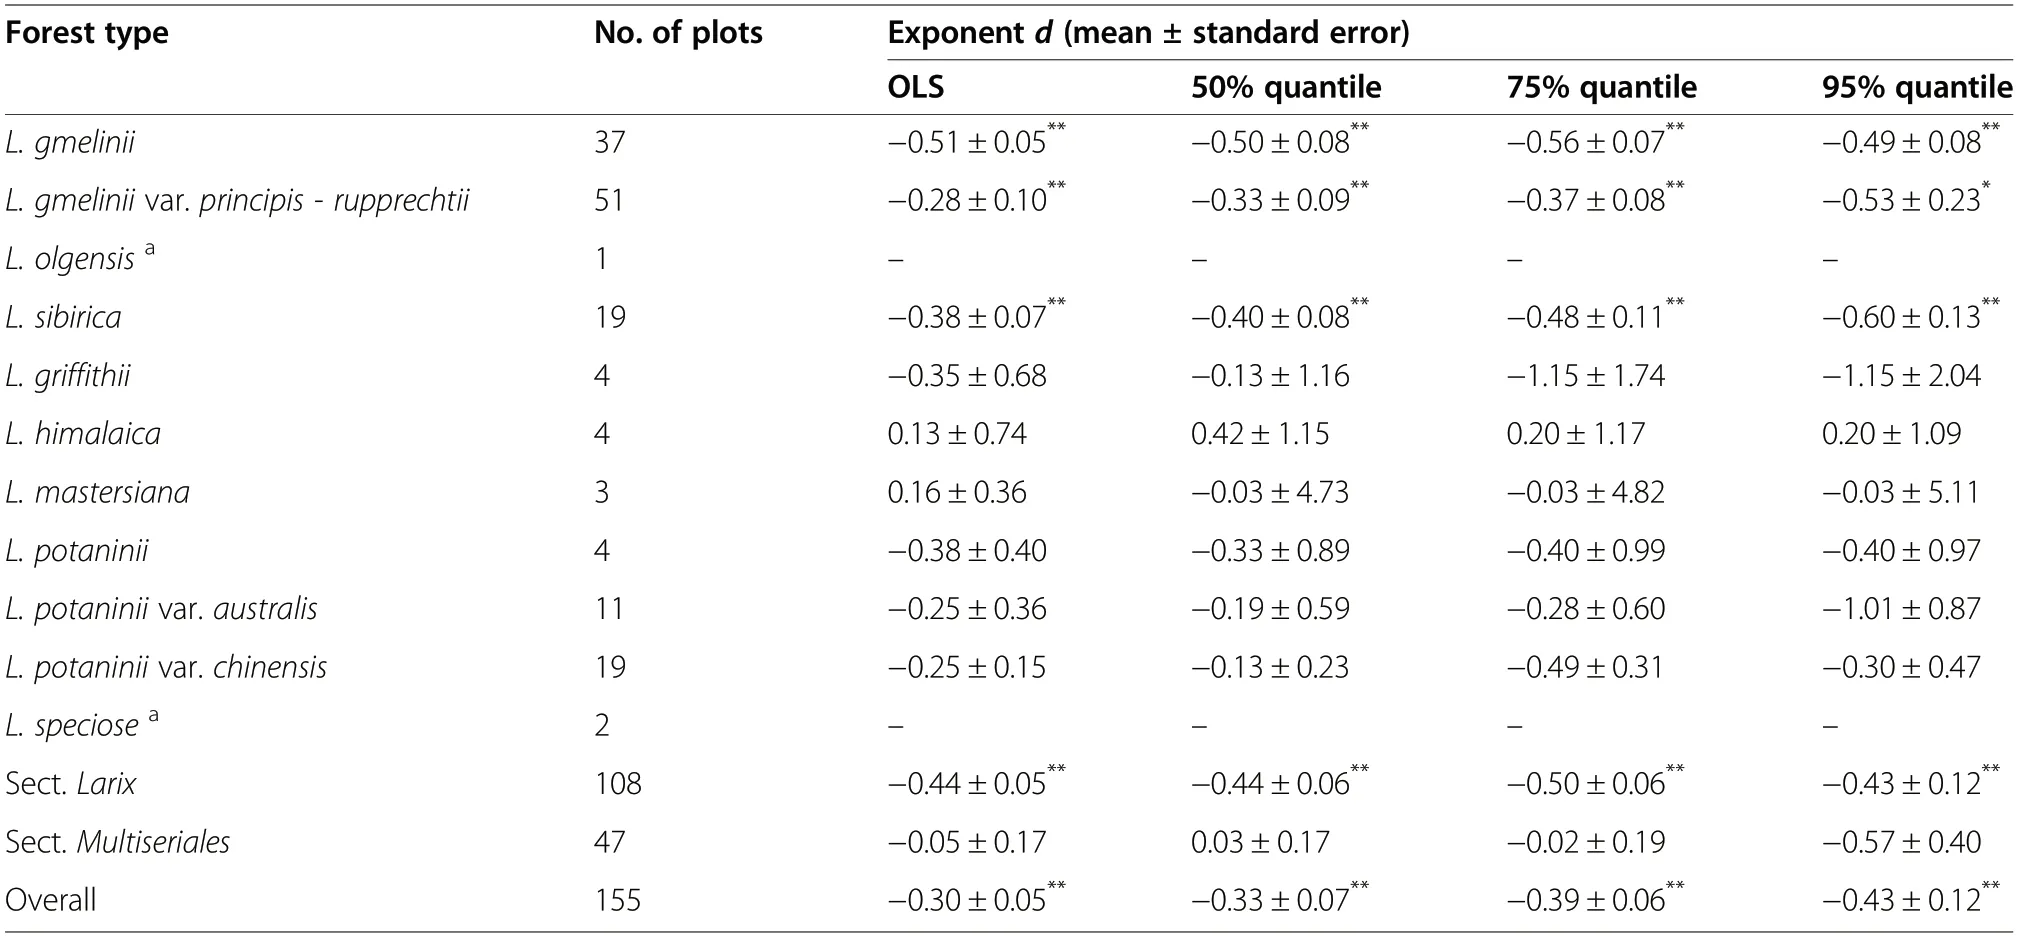
The d-exponents for the relationship between average DBH and stem density were −0.30,−0.33,−0.39 and −0.43 for the OLS, the 50%, 75% and 95% quantiles, respectively(Fig.4;Table 3).Among the 11 larch forest types,only the L.gmelinii (−0.51, −0.50, −0.56 and −0.49 for the OLS, the 50%, 75%, and 95% quantiles, respectively), the L. gmelinii var.principis-rupprechtii(−0.28,−0.33,−0.37 and −0.53 for the OLS,the 50%,75%,and 95%quantiles,respectively)and the L. sibirica (−0.38, −0.40, −0.48 and −0.60 for the OLS,the 50%,75%,and 95%quantiles,respectively)forests exhibited a significant relationship between average DBH and stem density(Fig.4;Table 3).The allometric relationships between average DBH and stem density were not different among larch forest types (Table S4). The Sect. Larix forests (−0.44,−0.44,−0.50 and −0.43 for the OLS,the 50%,75%,and 95%quantiles,respectively)exhibited a significant relationship between average DBH and stem density,while the Sect.Multiseriales forests did not show any significant correlations(Fig.4;Table 3).
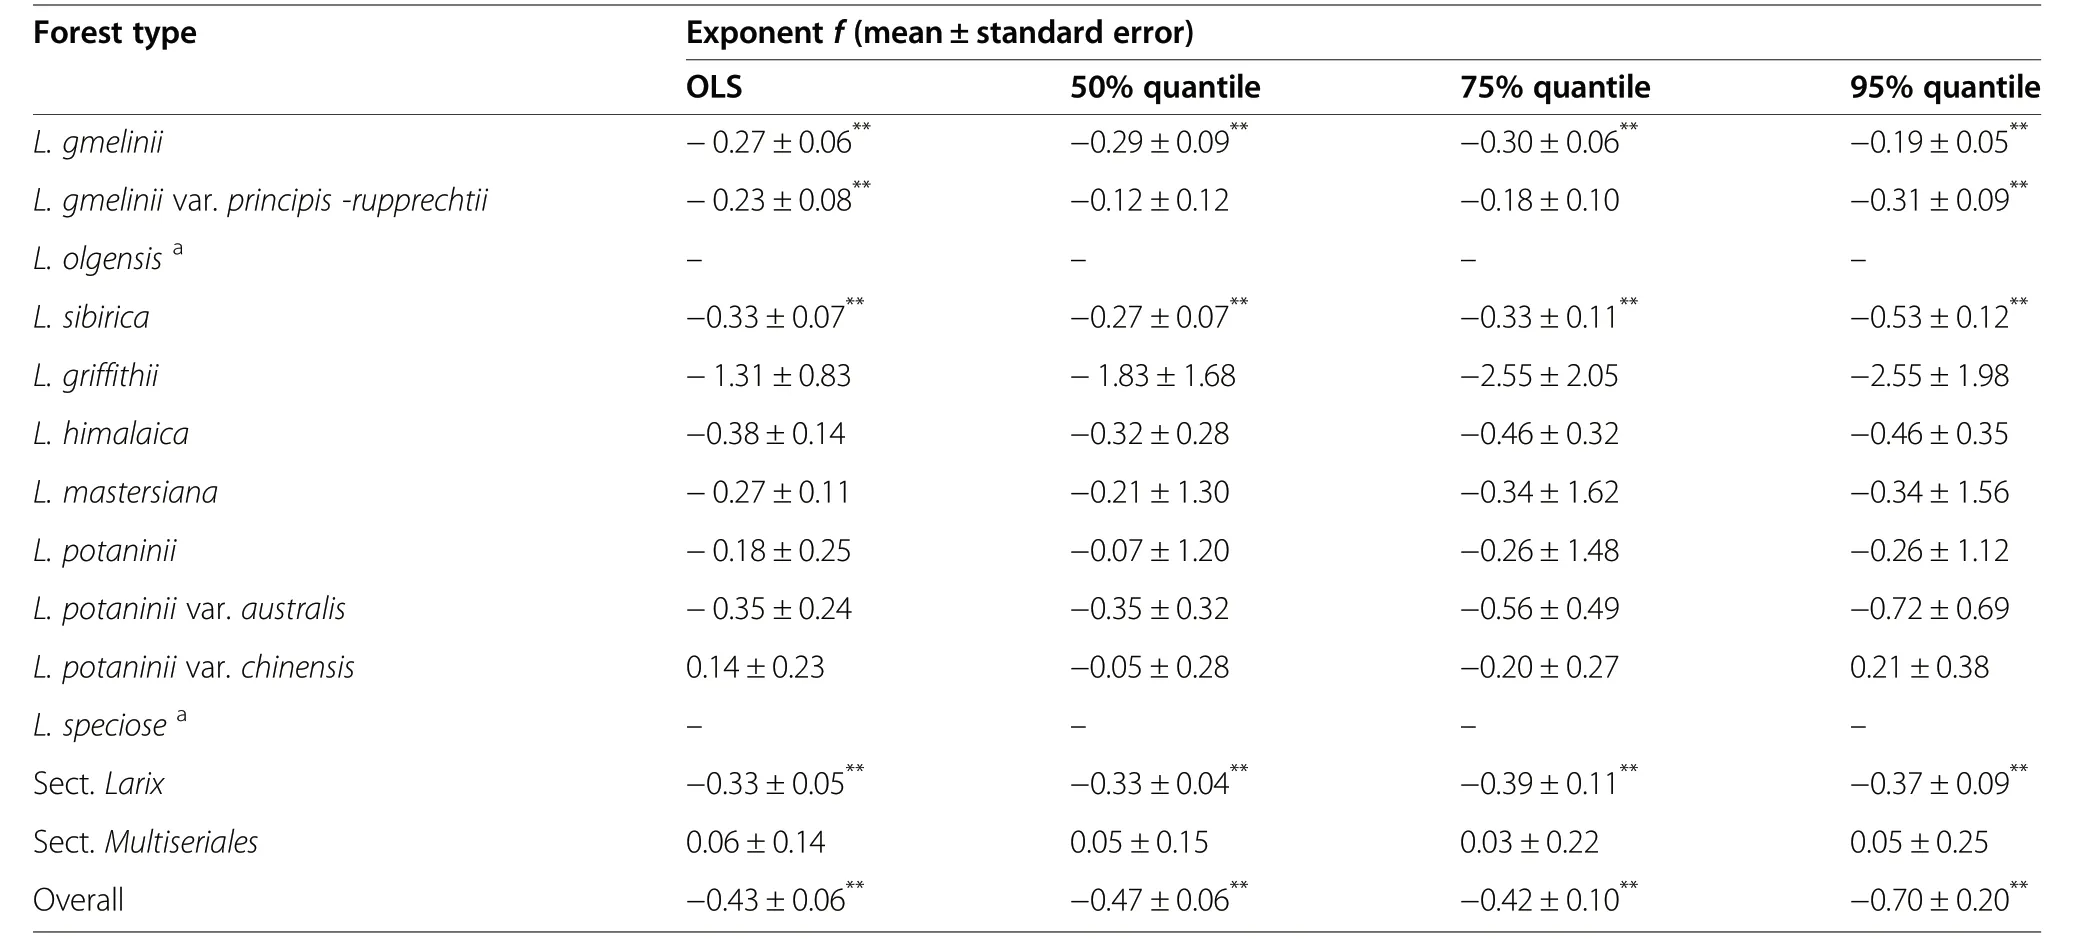
Taper and stem density showed a significant correlation for overall larch forests with f-exponents of −0.43,−0.47, −0.42 and −0.70 for the OLS, the 50%, 75%, and 95% quantiles, respectively (Fig. 5; Table 4). The L. gmelinii (−0.27, −0.29, −0.30 and −0.19 for the OLS, the 50%, 75%, and 95% quantiles, respectively), the L. gmelinii var. principis-rupprechtii (−0.23 and −0.31 for the OLS and the 95% quantile, respectively) and the L. sibirica (−0.33, −0.27, −0.33 and −0.53 for the OLS, the 50%, 75%, and 95% quantiles, respectively) forests showed a significant relationship between taper and stem density (Fig. 5; Table 4). The allometric relationships between taper and stem density were not different among larch forest types (Table S4). The Sect. Larix forests (−0.33, −0.33, −0.39 and −0.37 for the OLS, the 50%, 75%, and 95% quantiles, respectively) exhibited a significant relationship between average DBH and stem density (Fig.5; Table 4).
Discussion
Variation of structure variables among larch forest types
Slenderness reflects forest stability, and greater slenderness indicates higher susceptibility of forest to disturbance (Wang et al. 1998; Masaka et al. 2013). In this study, we found greater slenderness for the Sect. Larix forests than for the Sect. Multiseriales forests (Fig. 2e).In this sense, the Sect. Larix forests were more sensitive to disturbance than the Sect. Multiseriales forests. The slenderness of the Sect. Larix forests was consistent with that reported in previous studies in Europe (Orzel 2007).The structure variables varied remarkably among larch forest types (Fig. 2), partly because of the differences in the phenotypes of the dominant trees and site distributions of different larch forests (Figs. 1 and S2; Table 1).Forest type was the most important impact factor for all structure variables except the stem density (Table 1).Among the site factors, altitude was the main factor and latitude was the most important factor for the stem density (Table 1). All structure variables except the DBH exhibited significant geographic patterns (Fig. S2). Besides, stand age may influence the structure variables of different forest types (Chazdon et al. 2005), such as diameter of tree in the old-growth hemlock-hardwood forests (Tyrrell and Crow 1994), and DBH growth,height of branch and crown width in the Pinus sylvestris var. mongolica plantation (Zhou 2017). The absence of stand age in this study may limit the generalization of our conclusion.

Table 2 Parameters of the standard major axis regression (SMA)and the ordinary least square regression(OLS) between tree height and DBH for larch forests in China
The differences of exponents between tree height and DBH among larch forest types

Table 3 Parameters of the quantile regression(QR)and the ordinary least square regression(OLS) between average DBH and stem density for larch forests in China

Table 4 The parameters of the quantile regression(QR)and the ordinary least square regression(OLS) between taper and stem density for larch forests in China
Inconsistent with King et al. (2009), we found that the b-exponent between tree height and DBH of overall larch forests in China was larger than 2/3 for the SMA and equal to 2/3 for the OLS (Tables 2 and S5).However, the forest type dependence of the exponent was consistent with Wang et al. (2006) and Lopez-Serrano et al. (López-Serrano et al. 2005), who found that this relationship was significantly modulated by climate at a large scale. Similarly, Liu et al. (2017) found that the b-exponents between tree height and DBH of larch forests were not only correlated with larch forest type, but also significantly affected by MAT. Climatic conditions are very important for tree growth (Littell et al. 2008; Fang et al. 2012a, 2012b). Trees tend to grow vertically under warm and humid climatic conditions,while they tend to grow radially under cold climatic conditions (Wang et al. 2006; Liu et al. 2017; Littell et al.2008). Hence, the relationship between height and DBH differs among climatic conditions. For different larch forests, climate factors also significantly influence tree growth (Carrer and Urbinati 2006; Dulamsuren et al.2008, 2010, 2011). For example, Dulamsuren et al.(2010, 2011) found that the tree-ring width of L. sibirica was positively related to warm and humid climatic conditions and that aridity reduced the growth of this species. Zhang et al. (2013) found that average DBH and stem density of the L. gmelinii in northeastern China were largely determined by precipitation of the driest quarter. Bhatta et al. (2018) found that radial growth of the L. griffithii was significantly positively correlated with the precipitation of the wettest quarter and negatively correlated with the mean temperature of the warmest month in Nepal near the Tibetan Plateau. Meanwhile, the growth response of larch to climatic conditions depends on altitude (Sun et al.2010b). In this study, the differences in site and climatic conditions among larch forest types (Figs. 1 and S2) resulted in markedly different tree height-DBH relationships. The b-exponent of overall larch forests was consistent with the result of Liu et al.(2017) (0.56 vs. 0.51) at the national scale. However,in contrast to our study (Table 2), Liu et al. (2017)found that the b-exponents between tree height and DBH of Sect. Larix forests in northeastern China(0.65±0.11 for the L. gmelinii forest and 0.68±0.10 for the L. olgensis forest) were significant bigger than those of the Sect. Multiseriales forests in southwestern China (L. mastersiana forest: 0.51±0.17 and L. potaninii forest: 0.54±0.15),partly because of their limited number of forest types. In their studies, Liu et al. (2017) included only four forest types,while we included seven forest types dominated by the species from the Sect.Multiseriales.
Site condition and self-thinning of larch forests in China
Gradel et al. (2017) found that thinning significantly increased the growth of larch. In other words, low stem density is conducive to the growth of larch. This finding is consistent with our result regarding the stem density effect. There were significant negative power function relationships between average DBH and stem density,and between taper and stem density for overall larch forests and the Sect. Larix larch forests in China (Tables 3 and 4). However, the results varied among forest types.The L. gmelinii, the L. gmelinii var. principis-rupprechtii and the L.sibirica forests, all belonging to the Sect. Larix forests, showed a significant negative power function relationship, while the other types did not exhibit significant relationship (Figs. 2 and 3). Compared with the Sect. Larix forests, the Sect. Multiseriales forests suffered more environmental stress and their densities were comparatively low (average stem density: 605.8-945.7 stems per ha) and even did not result in natural thinning. For example, the Sect. Multiseriales forests are distributed in the alpine regions of southwestern China, with a mean elevation of over 3000 m, and some are even distributed in the frigid areas at an elevation over 4000 m (Fig. S2)(Cheng and Fu 1978; Wu 1980). Therefore, environmental conditions of the Sect.Multiseriales forests are generally more stressful (Cheng and Fu 1978; Wu 1980). For woody plant communities, site conditions would commonly affect the natural thinning process (Fang 1992).Compared with that of conifer forests distributed at lower altitudes, crown density of the Sect. Multiseriales forests was lower (average stem density: 837.0 stems per ha). Some of these forests were even sparse forests, and self-thinning may not have occurred. Therefore, the effect of density was less obvious for the Sect. Multiseriales forests. This finding is consistent with the results of Comeau et al. (2010), who found that the relationship between stem density and average DBH was influenced by environmental and other factors, and indicated the need to elucidate the relationship between stem density and average DBH for different forest types and for different regions where the forest types grow.
The exponents of average DBH vs. stem density relationship and taper vs. stem density relationship differed greatly among forest types and varied between different approaches (QR vs. OLS). Although there were few literatures of allometric relationships between density and other structure variables about larch forests, dependence of the exponent on forest type was also observed for other coniferous forests.For example, Cui et al. (2016) found that the exponent between stem density and average DBH for the Cunninghamia lanceolata plantations was not constant but obeyed a normal distribution with an average of 1.88. Rivoire and Moguedec (2012) found that the exponents varied from −1.59 by a stochastic frontier function to −1.85 by a generalized optimization method. Pretzsch (2006) found that the exponents between stem density and average DBH, and between biomass and stem density were not constant, but were related to forest types. These results, together with ours, indicated that the power exponents of structure variables vs. stem density relationship tended to vary with forest types and depended on the analytical methods (Sun et al. 2010a; Cui et al. 2016).The site conditions differed among larch forest types,which were distributed in different regions (Fig. 1).Site conditions are commonly found to affect the natural thinning process in woody plant communities(Fang 1992). Therefore, the exponents between average DBH and stem density, and between taper and stem density for larch forests were not constant and varied with larch forest types.
Conclusions
In this study, we explored the relationships among structure variables of larch forests in China based on an extensive investigation of natural larch forest across China.We found that the Sect. Larix forests were denser, taller and slenderer than the Sect. Multiseriales forests. The relationship between tree height and DBH showed a power function relationship for all larch forest types, but they had different exponents. Overall, stem density was negatively correlated with average DBH and taper.Among the 11 larch forest types, stem density was negatively correlated with DBH and taper of the L. gmelinii,the L. gmelinii var. principis-rupprechtii and the L. sibirica forests, but not for other types. We concluded that all structure variables except stem density were forest type dependent. The exponents between tree height and DBH, average DBH and stem density, and taper and stem density for larch forests varied among larch forest types. The Sect. Larix forests exhibited significant density effects.
Supplementary Information
The online version contains supplementary material available at https://doi.org/10.1186/s40663-020-00273-w.
Additional file 1.
Abbreviations
DBH: Diameter at breast height; GLM: General linear model; MAT: Mean annual temperature; MI:Moisture index; MTCM:Mean temperature of the coldest month; MTWM: Mean temperature of the warmest month;OLS: Ordinary least square regression; QR: Quantile regression; SMA: Standard major axis regression
Acknowledgements
We are grateful to Li Lanqing,Ma Guangming, Xu Qibiao and many others and the local forestry bureau for their assistance during the field investigation and to Guo Yanpei and Ma Suhui for their help in data analyses.
Authors’ contributions
JF designed the research; WF, QZ, QC,GC, YF,HZ, CJ, ZT, and JF performed the field work; WF conducted the analysis; WF, ZT, JF and all the others contributed the writing of the manuscript. The author(s) read and approved the final manuscript.
Funding
This study was supported by the National Science and Technology Basic Project of China (No. 2015FY210200) and National Natural Science Foundation (No. 31988102).
Availability of data and materials
The datasets used and/or analyzed during the current study are available from the corresponding author on reasonable request.
Ethics approval and consent to participate
Not applicable.
Consent for publication
Not applicable.
Competing interests
The authors declare that they have no competing interests.
Received: 9 June 2020 Accepted: 21 October 2020
- Forest Ecosystems的其它文章
- Evaluating the impact of sampling schemes on leaf area index measurements from digital hemispherical photography in Larix principis-rupprechtii forest plots
- Discovering forest height changes based on spaceborne lidar data of ICESat-1 in 2005 and ICESat-2 in 2019:a case study in the Beijing-Tianjin-Hebei region of China
- Comparison of the local pivotal method and systematic sampling for national forest inventories
- Effects of firewood harvesting intensity on biodiversity and ecosystem services in shrublands of northern Patagonia
- The Siberian moth(Dendrolimus sibiricus),a pest risk assessment for Norway
- Hydrological functioning of forested catchments,Central Himalayan Region,India

