Development and application of a GIS-based artifi cial neural network system for water quality prediction: a case study at the Lake Champlain area*
LU Fang , ZHANG Haoqing , LIU Wenquan
1 Shandong Provincial Key Laboratory of Marine Environment and Geological Engineering, Ocean University of China, Qingdao 266100, China
2 Laboratory for Marine Geology, Qingdao National Laboratory for Marine Science and Technology, Qingdao 266000, China
3 Key Laboratory of Marine Environment and Ecology, Ministry of Education, Qingdao 266100, China
4 Key Laboratory of Marine Sedimentology and Environmental Geology, First Institute of Oceanography, Ministry of Natural Resources (MNR), Qingdao 266061, China
Abstract Artifi cial Neural Network (ANN) models have been extensively applied in the prediction of water resource variables, and Geographical Information System (GIS) includes powerful functions to visualize spatial data. In order to provide an effi cient tool for environmental assessment and management that combines the advantages of these two modules, a GIS-based ANN water quality prediction system was developed in the present study. The ANN module and ArcGIS Engine module, along with a dynamic database, were imbedded in the system, which integrates water quality prediction via the ANN model and spatial presentation of the model results. The structure of the ANN model could be modifi ed through the graphical user interface to optimize the model performance. The developed system was applied to a real case study for the prediction of the total phosphorus concentration in the Lake Champlain area. The prediction results were verifi ed with the monitoring data, and the performance of the developed model was further evaluated through graphical techniques and quantitative statistical methods. Overall, the developed system provided satisfactory prediction results, and spatial distribution maps of the predicted results were obtained, which coincided with the monitored values. The developed GIS-based ANN water quality prediction system could serve as an effi cient tool for engineers and decision makers.
Keyword: water quality prediction; Geographical Information System (GIS); artifi cial neural network; integration; system development
1 INTRODUCTION
Lake Champlain is a natural freshwater lake located between the states of Vermont-New York of USA and Quebec of Canada. The lake area suff ered from pollution in recent years by phosphorus released from anthropogenic sources, and the concentration of total phosphorus (TP) was detected high in the northern part of the lake (Smeltzer et al., 2012). Proper modeling and water quality prediction are important to eff ectively reduce eutrophication in the lake.
In recent years, a number of data mining approaches, such as artifi cial neural network (ANN) techniques, have been extensively used for water quality modeling (Ranković et al., 2010; Wang et al., 2013; Cho et al., 2014; Wu et al., 2014; Azimi et al., 2019; García-Alba et al., 2019; Zhang et al., 2019). Artifi cial neural networks are developed to model the interconnected system of neurons in the brain (Deperlioglu and Kose, 2011). A feed-forward error back-propagation neural network was applied to estimate the dissolved oxygen concentrations downstream of Mathura city, India, and the prediction results showed prominent accuracy (Sarkar and Pandey, 2015). The chlorophylla(chla) concentrations in Lake Champlain area were successfully predicted using ANN models (Lu et al., 2016). Based on the water quality parameters at the water surface, ANN models coupled with stationary wavelet transform were used to successfully estimate the water quality profi les through the water column in deep lakes (Saber et al., 2019). ANN model exhibited high prediction effi ciency when applied for the prediction of groundwater quality in Baghdad city (Khudair et al., 2018). Comparing the performances of ANN models with that of physical-based models, the Soil and Water Assessment Tool (SWAT) model had lower prediction accuracy in comparison to the multilayer ANN model in the simulation of the sediment yield in a watershed (Singh et al., 2012). Pradhan et al. (2019) found that SWAT performed better in low fl ow simulation, while the ANN model was better for high fl ow simulation. Lu (2015) also reported that the ANN model performed better than the Mike 21 model in the Lake Champlain area, which has a complex bathymetry. In the simulation of water levels of a river, the performance of the ANN model was much better than that of the MIKE 11HD model in the simulation of river water levels (Panda et al., 2010).
ANNs are capable of observing relationships in the data, learning from their environments and improving the process performance through learning (Moradzaeh and Khaff afi , 2017). Geographical Information System (GIS) is quite useful in decision-making processes due to its powerful functions for visualizing data and analyzing results (Debaine and Robin, 2012; Zamanisabzi et al., 2018). The integration of ANN models and GIS combines the functions and advantages of both modules and strategies for this integration have been discussed in previous studies. Brandmeyer and Karimi (2000) arranged the categories of methods for integrating GIS and other models into a fi ve-layer pyramid that described the increasing level of integration from one-way data transfer to tool coupling. To date, most of the studies on this integration have presented one-way data transfer applications of ANN model and GIS tools (Ho et al., 2010; Kia et al., 2012; Matouq et al., 2013), that is, using ANN techniques to obtain model results and subsequently switching to GIS tools to visualize the ANN model results, which requires good knowledge of the implementation of both ANN techniques and GIS tools. The main drawback of this method is that it requires manual data transfer between the two environments, which is time consuming (Santini et al., 2010). However, there is a lack of research regarding more advanced integration methods, such as tool coupling or joint coupling. In the case of tool coupling, high technical programing skills are required since the environmental models are developed in a GIS environment using a Macro Language, and complex models cannot be included (Al-Sabhan et al., 2003). Yoo and Kim (2007) embedded trained ANN models in a GIS platform using VB.NET scripts in order to analyze data and visualize the results in the tunneling performance prediction. However, the embedded ANN models were pre-trained and were not alterable in the application.
In view of these problems, an attempt was made in the present study to develop a water quality prediction system that integrates an alterable feed-forward backpropagation ANN module, which is the most common ANN model, and GIS tools using the joint coupling method. A graphical user interface (GUI) was further developed to manage the modeling process of the ANN module and to visually present the georeferenced modeling results. One of the main advantages of the system developed in the present paper was that, the structure of ANN model could be modifi ed through the GUI in order to optimize the model performance during the application of the system. Moreover, a spatial distribution map of the predicted results could be obtained through this system. The purpose of developing the water-quality prediction system reported in this paper was to facilitate the prediction and management process for managers and environmental engineers. Furthermore, a case study was carried out using water quality monitoring data from the Lake Champlain area. The developed system could also be applied in other oceanic or lake regions.
2 MATERIAL AND METHOD
2.1 Construction of the ANN model
The feed-forward back-propagation ANN model applied in the present study includes three layers: an input layer, a hidden layer, and an output layer. The architecture of the ANN model applied in this study, the methods for selecting the input variables of this model, data normalization, model structure optimization, and model performance evaluation were as described in a previous study that modeled the chlaconcentration in Lake Champlain using an ANN model (Lu et al., 2016).
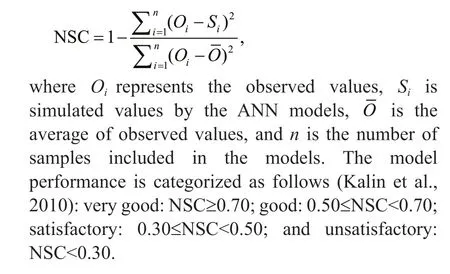
The model performance was also evaluated through graphical techniques (namely the standard regression line and the response curves) and quantitative statistical methods (namely the coeffi cient of determination (R2) and RMSE-observations standard deviation ratio (RSR)) in the present study. Moreover, the Nash-Sutcliff e Effi ciency coeffi cient (NSC) (Nash and Sutcliff e, 1970; Noori and Kalin, 2016) was applied herein to evaluate the ANN model performance. The NSC is calculated as follows (Malekzadeh et al., 2019):
2.2 Development and implementation of the GISbased ANN water quality prediction system
The GIS-based ANN water quality prediction system was developed in the .NET environment using the C# programming language, and integrates the ANN model, ArcGIS Engine 9.3 and the Microsoft Access database. Integration of the ANN model and ArcGIS Engine combines the advantages of these two modules, and could be achieved by various methods. An ANN model could be developed, trained, and validated using Matlab software, and a dynamic link library (DLL) is sequentially built for interfacing with ArcGIS Engine. Although less eff ort is required in terms of coding, the application of this method is not fl exible since the modifi cation of the predetermined ANN model parameters is not possible after building the DLL. Compiling the ANN model using C# programing language could help in developing a model with modifi able parameters; however, this method requires a number of programing codes and a good understanding of the model algorithm. The Encog machine learning framework is an artifi cial intelligence framework that is computed in .NET and supports the algorithm of neural networks. In the present study, the Encog 2.4 framework was used to integrate an ANN model with modifi able parameters with ArcGIS Engine.
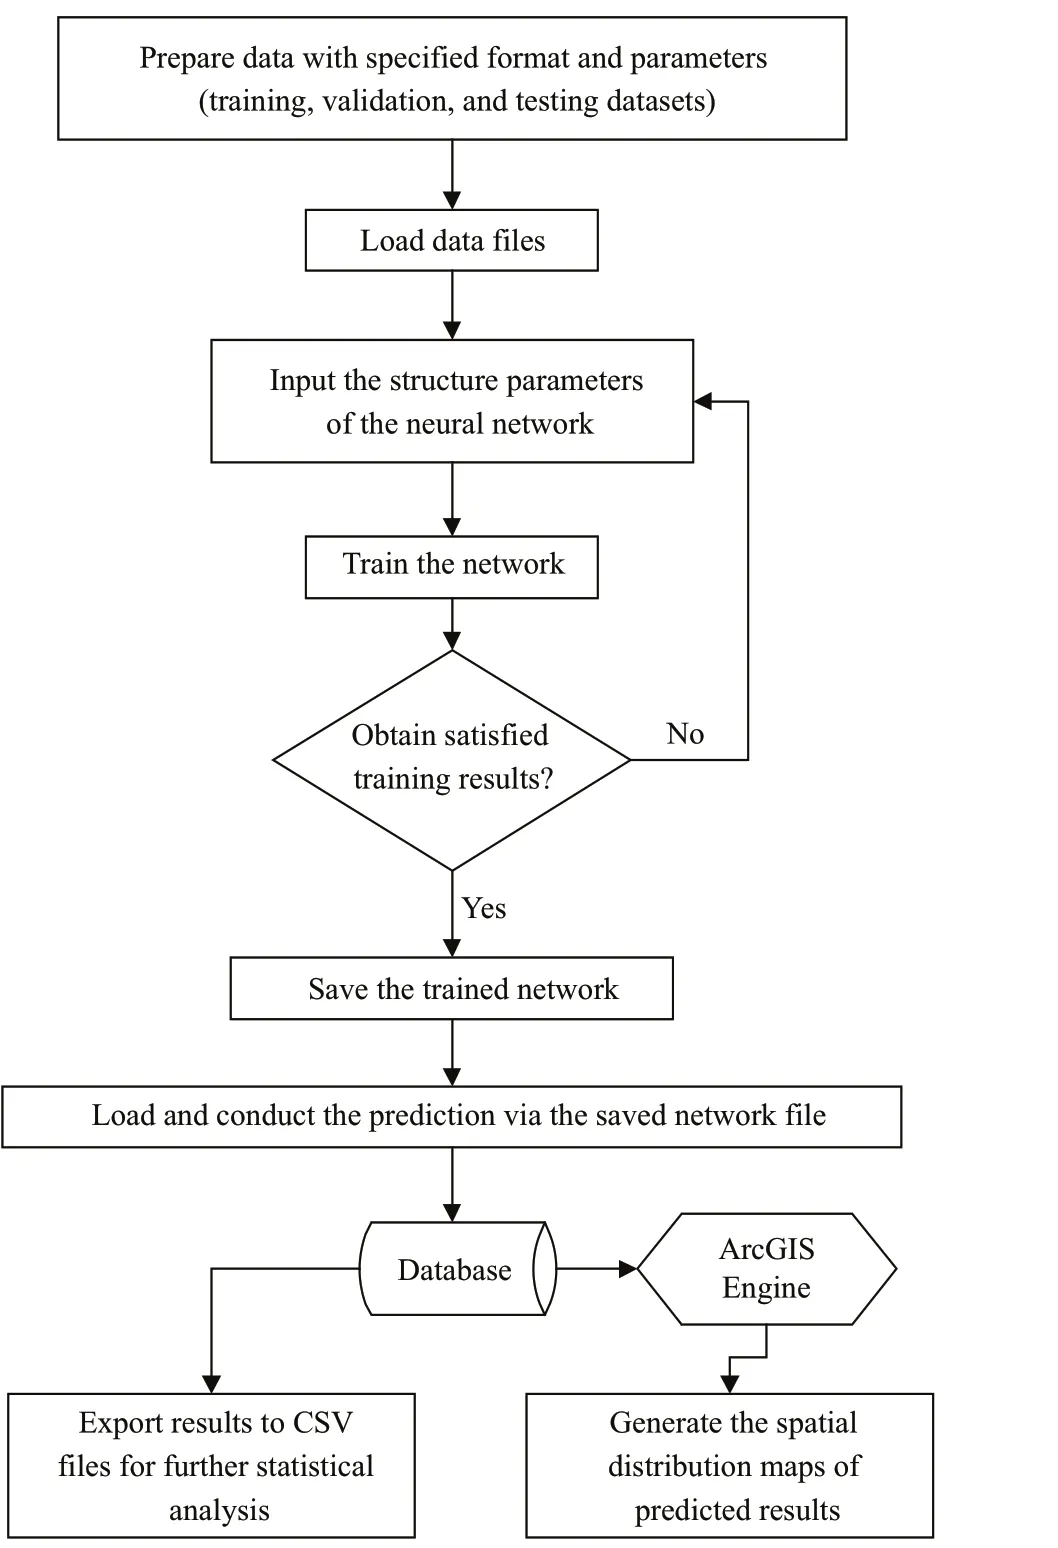
Fig.1 Workfl ow of the GIS-based ANN water quality prediction system
By integrating ArcGIS Engine into the system, GIS was used as a post-processor of the ANN model. The ANN model and ArcGIS Engine module have a common data storage, which was utilized to save the input data and model results, as well as for data retrieval for ArcGIS Engine to generate georeferenced maps. Database management was conducted using the Microsoft Access software.
The water-quality prediction system includes three interconnected parts, namely the training, prediction, and visualization modules, which were capable of training the network, predicting water quality using the trained network, and visualizing the prediction results in the form of spatial distribution maps. A schematic of the workfl ow of the developed system is shown in Fig.1. The steps in the workfl ow could be correspondingly accomplished in the load data module, set neural network module, training network module, and prediction module on the system interface (Figs.2 & 3). The trained and predicted model results could be exported as CSV fi les in order to conduct further statistical analysis ofR2, RSR, and NSC values.
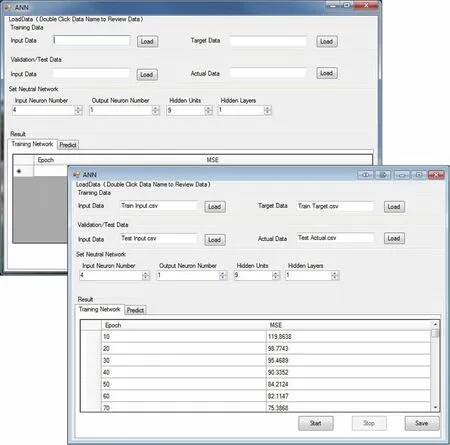
Fig.2 Interface of the load data, set neural network, and training sub-modules of the developed system
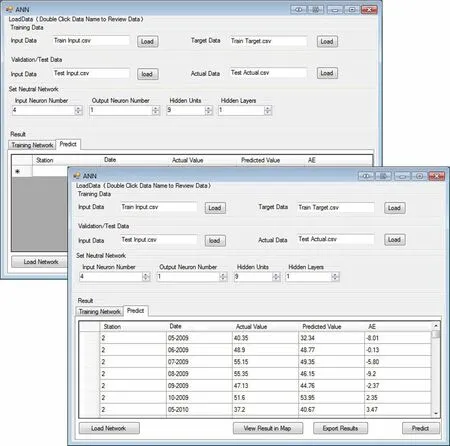
Fig.3 Interface of the prediction sub-module of the developed system
3 CASE STUDY
3.1 Study area
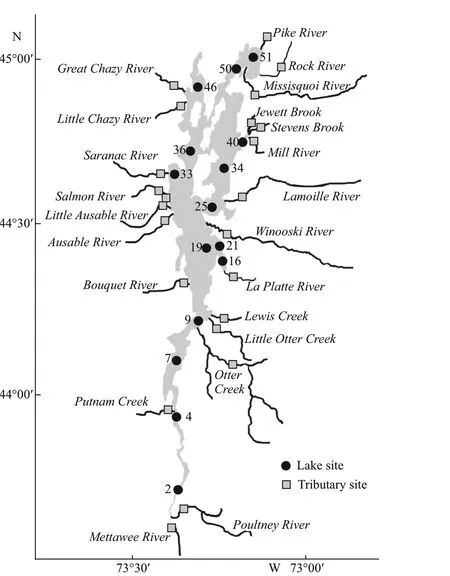
Fig.4 Study area and sampling sites
Lake Champlain, which covers an area of approximately 1 269 km2with a drainage area of 21 326 km2, is one of the numerous large lakes located across the border of the United States and Canada. It has a complex bathymetry, with over 70 islands and a shoreline of over 800 km (Fig.4). The lake is approximately 201-km long and 0.8–23-km wide, with a maximum depth of approximately 120 m. Harmful algae blooms that degrade the lake water quality occurred several times due to the excessive phosphorus loading in the Lake Champlain area (Ghebremichael et al., 2010).
3.2 Data preparation
3.2.1 Data collection
The data used in the present study included lake water chemistry, tributary water chemistry, and tributary fl ow rate data.
Lake water chemistry data from the epilimnion layer were used in this study, which were collected from the Lake Champlain Long-term Water Quality and Biological Monitoring Project database (Smeltzer, 2017). The water samples were collected at 15 lake stations as shown in Fig.4. Stations 9, 16, and 51 were**: correlation is signifi cant at the 0.01 level (2-tailed). added after 2001, while other stations were sampled consistently between 1992 and 2012.
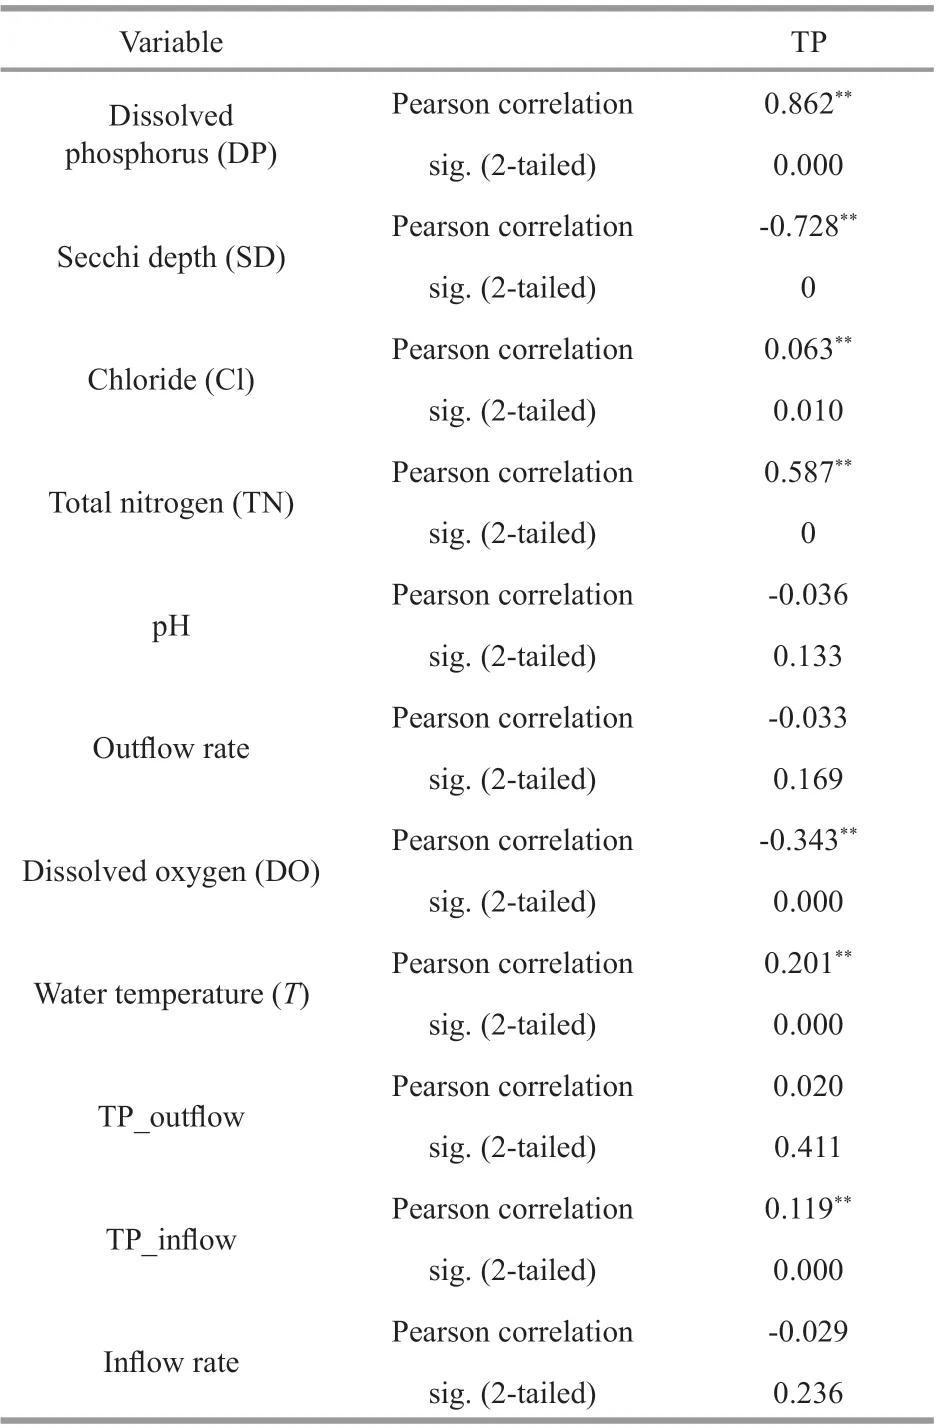
Table 1 Correlation analysis of concentrations of water quality variables and TP concentrations
Tributary water chemistry data used in this study were also retrieved from the Lake Champlain Longterm Water Quality and Biological Monitoring Project database (Smeltzer, 2017) and The Ministry of Sustainable Development, Environment and the Fight against Climate Change (http://www.mddelcc.gouv.qc.ca/index.asp). The monitoring stations at which water chemistry data were collected are shown in Fig.4. Moreover, the tributary fl ow rate data was obtained from the U.S. Geological Survey and the Centre d’expertise hydrique du Québec. The fl ow rates of Pike River at Notre-Dame-de-Stanbridge and Richelieu River at the outlet of Lake Champlain were estimated through the drainage area ratio method (Emerson et al., 2005).

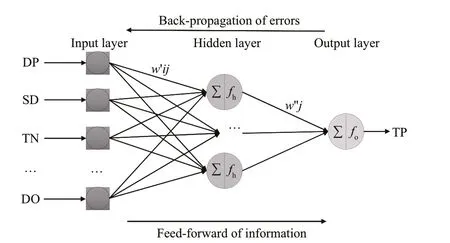
Fig.5 Architecture of the ANN models applied in the present study
whereQungagedis the fl ow at the ungaged site,Qgagedis the fl ow at the gaged site,Aungagedis the drainage area of the ungaged station, andAgagedis the drainage area of the gaged station.
Monthly average values of 12 parameters (as listed in Table 1) were included in the ANN model for the prediction of TP concentrations in Lake Champlain. Excessive loading of phosphorus from tributaries is an important factor in the modeling of TP in Lake Champlain area. The complete lake water quality data set consisted of 1 698 samples, including data from May to October for 12 years (from 2001 to 2012) at stations 9 and 16, data from May to October for 7 years (from 2006 to 2012) at station 51, and data from May to October for 21 years (from 1992 to 2012) at the remaining 12 stations. Data collected from 1992 to 2004 at each station were used as the training data, the validation dataset included data collected from 2005 to 2008, and data from 2009 to 2012 were used as the testing data. Thus, the training, validation and testing data sub-sets were comprised of 984 (57.95%), 354 (20.85%) and 360 (21.2%) samples, respectively.
3.2.2 Alternative input variable selection
Alternative input variables of the ANN model were selected according to the correlative analysis results (Table 1). Variables with the absolute value of correlation coeffi cients that was greater than 0.1 were selected as the alternative input variables for TP prediction, including SD, DP, TN, DO,T, and TP_infl ow.
The architecture of the ANN models used in the present study is presented in Fig.5.
3.2.3 Spatial variation of the alternative input variables
Statistical parameters of the concentration of selected alternative variables and TP concentrations are presented in Table 2. The TP and DP concentrationsshowed a relatively large variation, and their mean concentrations in Lake Champlain were 23.04±16.58 μg/L and 10.86±7.37 μg/L (mean±S.D.), respectively. The coeffi cient of variation for TP and DP were 0.68 and 0.72, respectively.

Table 2 Statistics of the selected variables for TP prediction ( n=1 698)

Table 3 Scenarios and results of TP prediction models
3.3 Implementation of the developed system
According to the results of alternative input variable selection discussed in Section 3.2.2, six scenarios were established, as listed in Table 3. The alternative input variables were sequentially excluded one by one in descending order of their correlation coeffi cients with TP. Considering the scenario with four input variables as an example, Figs.2 & 3 present the implementation of the developed system following the steps illustrated in Section 2.2. Multiple runs were conducted for each scenario with diff erent model structures, and the best model performance among these runs were selected as the model results, which were exported as CSV fi les for statistical evaluation. Moreover, spatial distributions of TP concentrations could be presented in contour maps generated by the system.
4 RESULT
The GIS-based ANN water quality prediction system introduced in the present study was developed to utilize the advantages of ANN models and ArcGIS. The developed system has two main components, coupling the prediction function of ANN models with ArcGIS Engine that visually presents the model results.
The performance of the embedded ANN model in the water quality prediction system will be discussed in the following section.
The best model performances of the training, validation, and testing data sets of the six scenarios are listed in Table 3. It was observed that the model with fi ve input variables exhibited the best performance, with fi ve neurons in the input layer, ten neurons in the hidden layer, and one neuron in the output layer. The values ofR2were 0.90, 0.92, and 0.92 in the training, validation, and testing datasets, respectively. The RSR values of the three data sets were 0.44, 0.39, and 0.40, respectively. Correspondingly, the NSC values of the three data sets were 0.81, 0.85, and 0.84.
A comparison of the predicted and measured concentrations of total phosphorus in the training, validation, and testing data sets is presented in Fig.6. All predicted TP concentrations were further compared with the monitored values in Fig.7. The regression equations,R2, RSR, and NSC values are listed in the fi gures.
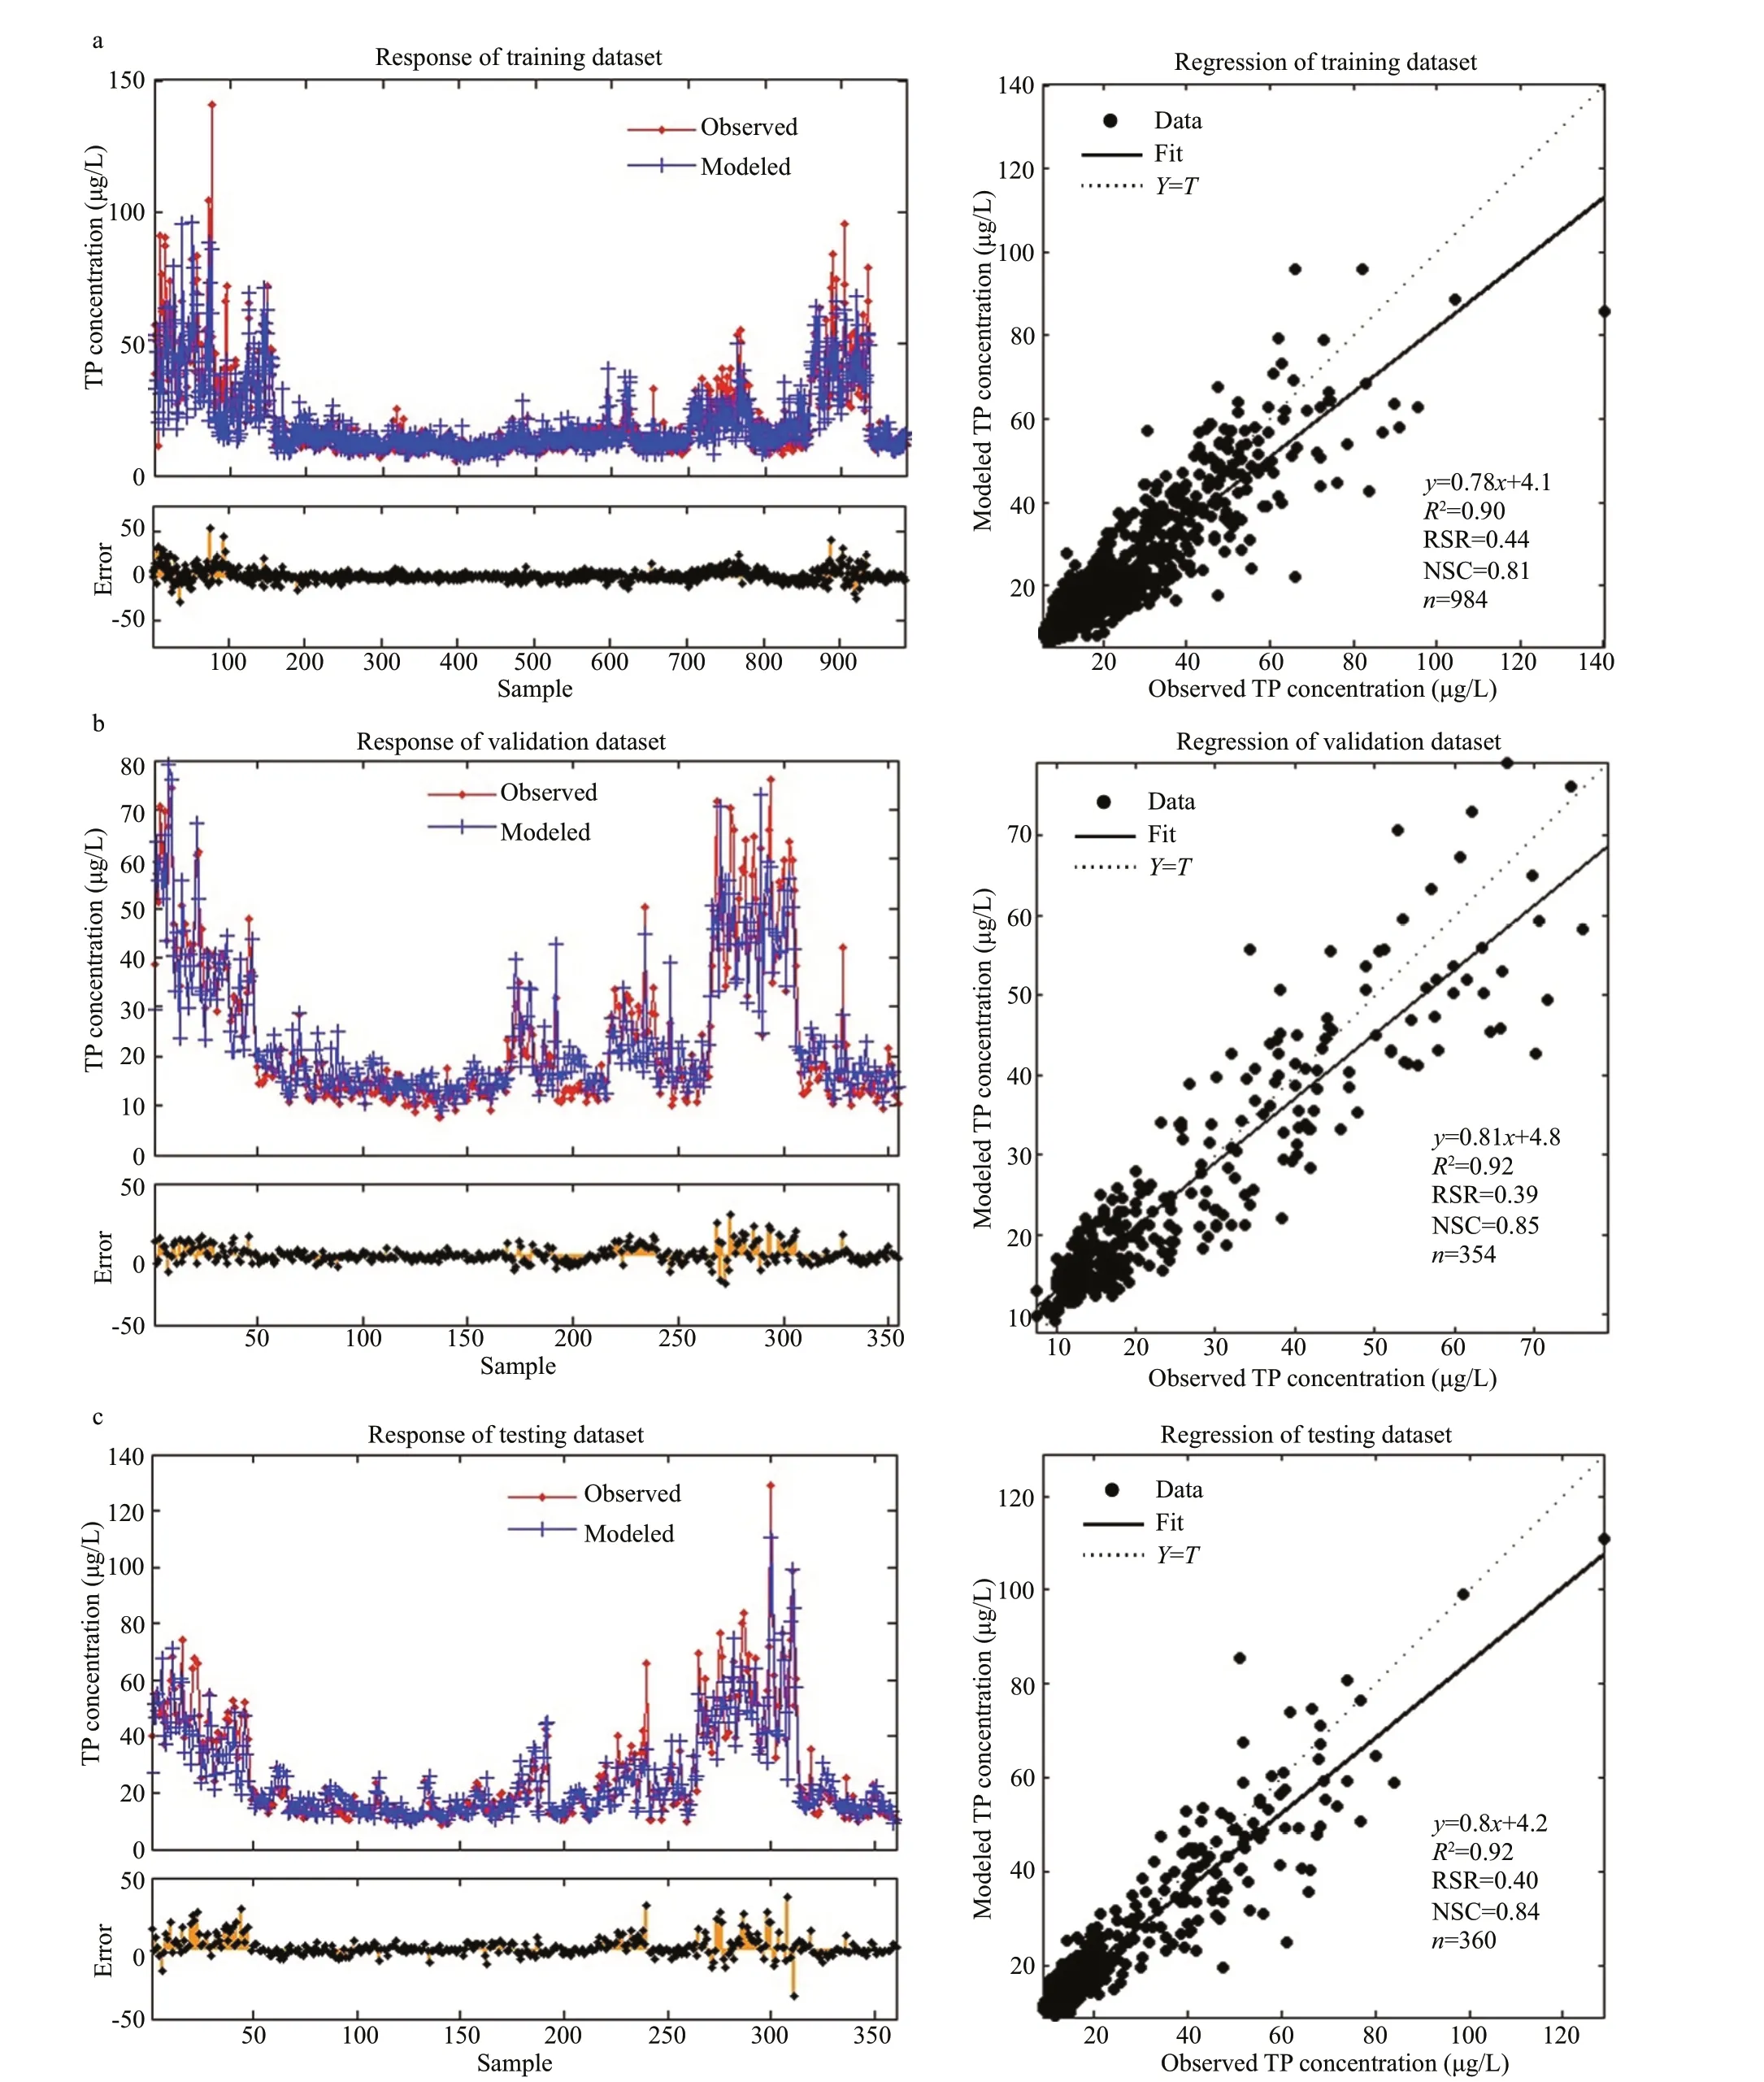
Fig.6 Comparison of the observed and modeled concentrations of TP in training dataset (a), validation dataset (b), and testing dataset (c)
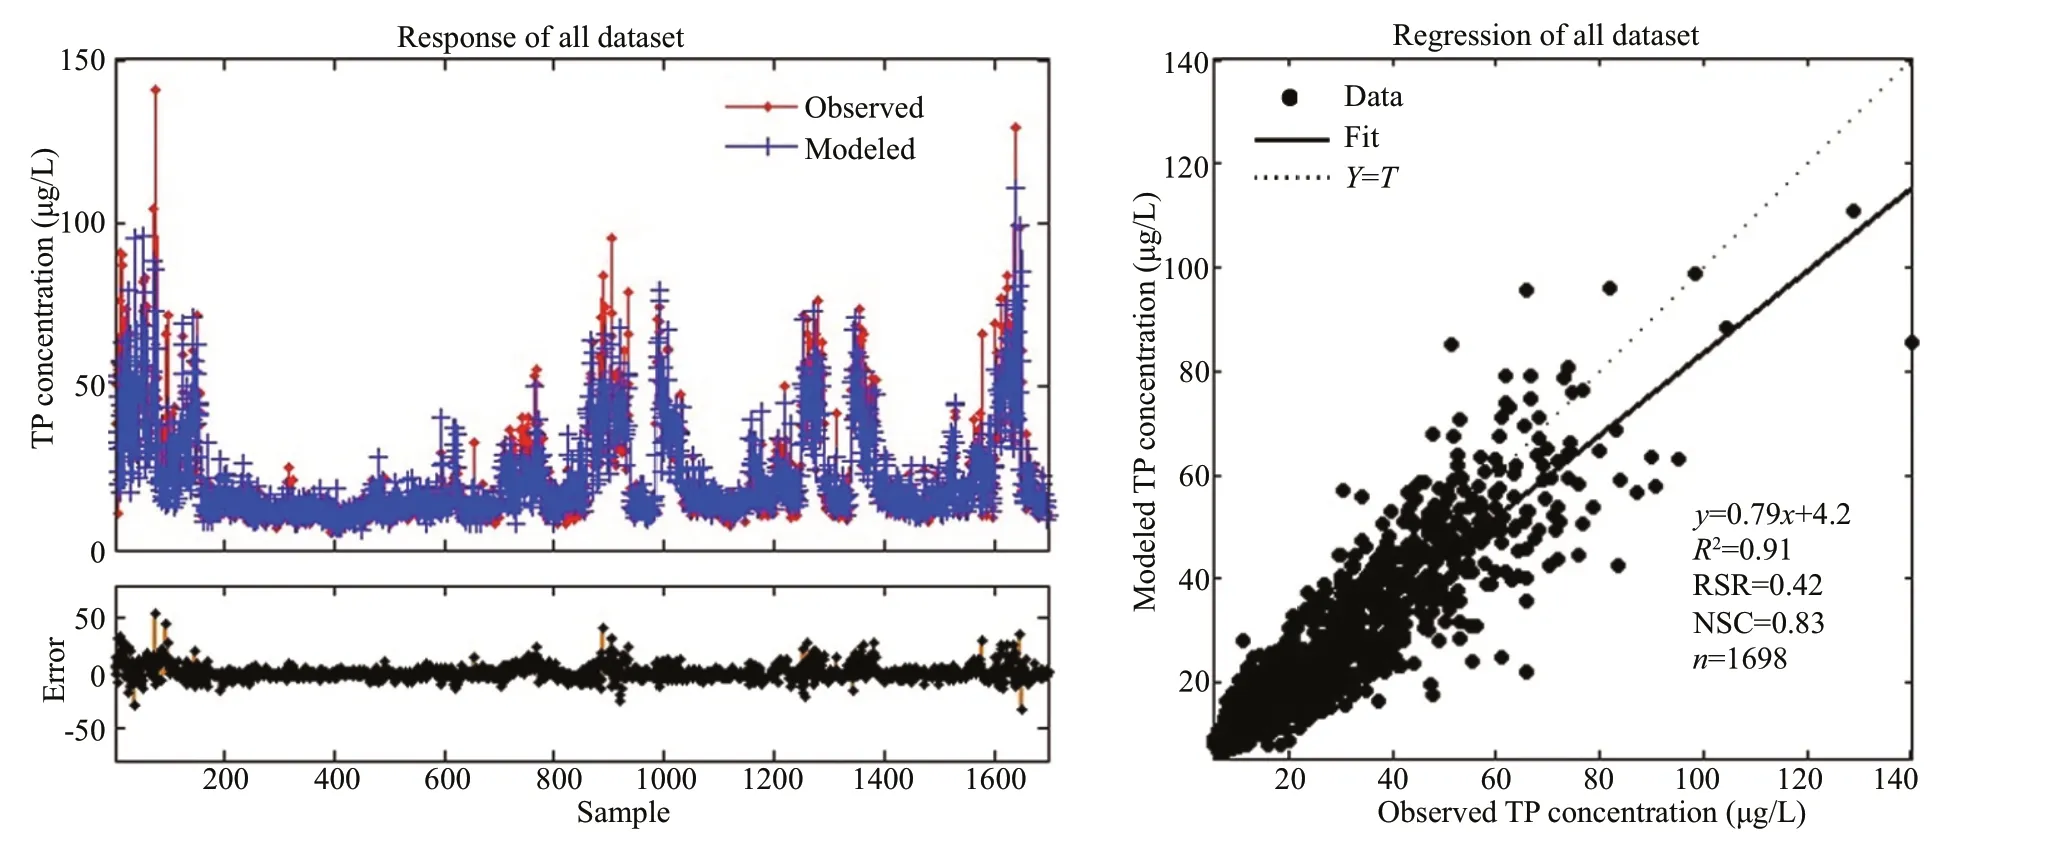
Fig.7 Comparison between the observed and modeled TP concentrations for all the data
5 DISCUSSION
As presented in Figs.6 & 7, the regression lines of all the datasets intersected with the dot lines that represent the perfect fi tting, and most part of the regression lines were below the dot lines. This demonstrated that the low values were slightly overestimated, whereas the high values were underestimated in the prediction. These errors are probably due to the abrupt variation of TP loads into Lake Champlain. In addition, errors during water sample collection and laboratory analysis are other possible factors infl uencing the prediction results. As seen in these fi gures, the validation and testing datasets had similar regression analysis results, indicating that the prediction model was not overtrained. The predicted TP concentrations were in good agreement with the monitored values, as indicated by statistics showing that theR2values of all the datasets were larger than 0.9, the RSR values were less than 0.7 (Moriasi et al., 2007), and the NSC values were larger than 0.7 (Kalin et al., 2010). Even though some peak values were not perfectly predicted, the prediction model established in the developed system was capable of simulating the variations of TP concentrations in Lake Champlain. As for the comparison between the results of the three datasets, the TP prediction results in the present study diff ered from those of chlaprediction in a previous study (Lu et al., 2016). In this previous study, the ANN model for chlaprediction showed a better performance in the training dataset as compared to other datasets, since the model was very specifi c to the training dataset with a smaller range of data, and was unableto correctly predict variation trends that were out of the range of the training data. By contrast, in the present study, the TP prediction results of the validation and testing datasets showed largerR2values, smaller RSR values, larger NSC values, and larger slopes of the linear regression lines as compared to those of the training dataset, indicating better performance in the validation and testing datasets. It was speculated that the reason behind this performance was the larger range of TP concentrations in the training dataset in comparison to the validation and testing datasets, as presented in Table 4. The TP prediction model was trained to fi t the target dataset with a larger data range, and thus, it was able to predict the variations in the two datasets that had a smaller data range.
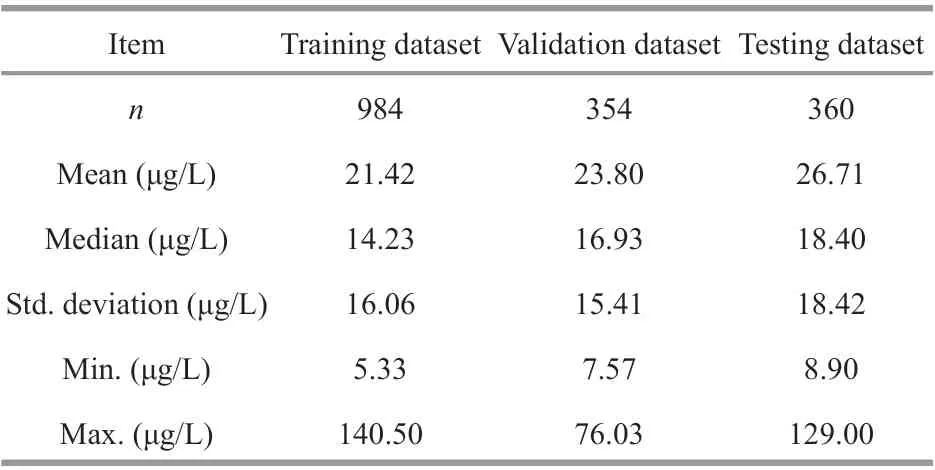
Table 4 Statistics of TP concentrations in training, validation, and testing datasets
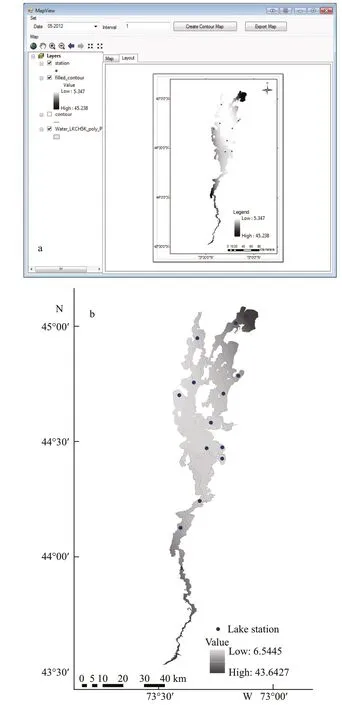
Fig.8 Comparison of the spatial distribution of the predicted TP concentration (μg/L) via the developed system (a) and the monitoring TP concentration (b) in May 2012
Moreover, the spatial distribution of the predicted TP concentrations could be presented in the “MapView” module of the system. Figure 8a presents the spatial distribution of the predicted TP concentrations in May 2012, as an example. Compared with the spatial map of the monitoring TP concentrations in May 2012 that was generated through GIS (Fig.8b), the spatial distribution of the predicted TP concentrations obtained by the developed system are in good agreement with that of the monitoring values. This observation further proved that the developed GIS-based ANN water quality prediction system was able to obtain reliable results and could be used as a useful tool to support regional water quality management.
6 CONCLUSION
The present study presents the development and application of a GIS-based ANN water quality prediction system. The algorithm of ANN was compiled using C# script via the Encog artifi cial intelligence framework to achieve the function of the alterable ANN module. Integration of the ANN module with ArcGIS Engine and the Microsoft database was performed. A user-friendly GUI was further developed to manage the data input and modeling process, as well as visually present the results. A case study was then carried out to predict the TP concentrations in Lake Champlain area using the developed system, and the prediction results were verifi ed against the lake water quality monitoring data. As indicated by the statistical analysis of predicted and monitored values, the prediction model in the developed system was capable of providing satisfactory results. Moreover, the system also intuitively presents the prediction results in the form of spatial distribution contour maps, which were in good agreement with the distribution of the monitored values, which further proving that the developed GISbased ANN water quality prediction system off ers an effi cient tool for engineers and decision makers.
7 DATA AVAILABILITY STATEMENT
The lake water chemistry data from the epilimnion layer and the tributary water chemistry data used in this study were available in the Champlain Lake longterm water quality and biological monitoring project database. Tributary fl ow rate data was available at the website of U.S. Geological Survey (USGS) and the Centre d’expertise hydrique du Québec (CEHQ). All the data are publicly available.
8 ACKNOWLEDGMENT
The authors thank the Vermont Department of Environmental Conservation for off ering the data.
References
Al-Sabhan W, Mulligan M, Blackburn G A. 2003. A realtime hydrological model for fl ood prediction using GIS and the WWW.Computers,EnvironmentandUrbanSystems, 27(1): 9-32, https://doi.org/10.1016/S0198-9715(01)00010-2.
Azimi S, Azhdary Moghaddam M, Hashemi Monfared S A. 2019. Prediction of annual drinking water quality reduction based on Groundwater Resource Index using the artifi cial neural network and fuzzy clustering.JournalofContaminantHydrology, 220: 6-17, https://doi.org/ 10.1016/j.jconhyd.2018.10.010.
Brandmeyer J E, Karimi H A. 2000. Coupling methodologies for environmental models.EnvironmentalModelling&Software, 15(5): 479-488, https://doi.org/10.1016/S1364-8152(00)00027-X.
Cho S, Lim B, Jung J, Kim S, Chae H, Park J, Park S, Park J K. 2014. Factors aff ecting algal blooms in a man-made lake and prediction using an artifi cial neural network.Measurement, 53: 224-233, https://doi.org/10.1016/j.measurement.2014.03.044.
Debaine F, Robin M. 2012. A new GIS modelling of coastal dune protection services against physical coastal hazards.Ocean&CoastalManagement, 63: 43-54, https://doi.org/10.1016/j.ocecoaman.2012.03.012.
Deperlioglu O, Kose U. 2011. An educational tool for artifi cial neural networks.Computers&ElectricalEngineering, 37(3): 392-402, https://doi.org/10.1016/j.compeleceng. 2011.03.010.
Emerson D G, Vecchia A V, Dahl A L. 2005. Evaluation of Drainage-Area Ratio Method Used to Estimate Streamfl ow for the Red River of the North Basin, North Dakota and Minnesota. U.S. Department of the Interior, U.S. Geological Survey, Reston, VA. García-Alba J, Bárcena J F, Ugarteburu C, García A. 2019. Artifi cial neural networks as emulators of process-based models to analyse bathing water quality in estuaries.WaterResearch, 150: 283-295, https://doi.org/10.1016/j.watres.2018.11.063.
Ghebremichael L T, Veith T L, Watzin M C. 2010. Determination of critical source areas for phosphorus loss: Lake Champlain basin, Vermont.TransactionsoftheASABE, 53(5): 1 595-1 604, https://doi.org/10.13031/2013.34898.
Ho C I, Lin M D, Lo S L. 2010. Use of a GIS-based hybrid artifi cial neural network to prioritize the order of pipe replacement in a water distribution network.EnvironmentalMonitoringandAssessment, 166(1-4): 177-189, https://doi.org/10.1007/s10661-009-0994-6.
Kalin L, Isik S, Schoonover J E, Lockaby B G. 2010. Predicting water quality in unmonitored watersheds using artifi cial neural networks.JournalofEnvironmentalQuality, 39(4): 1 429-1 440, https://doi.org/10.2134/jeq2009.0441.
Khudair B H, Jasim M M, Alsaqqar A S. 2018. Artifi cial neural network model for the prediction of groundwater quality.CivilEngineeringJournal, 4(12): 2 959-2 970, https://doi.org/10.28991/cej-03091212.
Kia M B, Pirasteh S, Pradhan B, Mahmud A R, Sulaiman W N A, Moradi A. 2012. An artifi cial neural network model for fl ood simulation using GIS: Johor River Basin, Malaysia.EnvironmentalEarthSciences, 67(1): 251-264, https://doi.org/10.1007/s12665-011-1504-z.
Lu F, Chen Z, Liu W Q, Shao H B. 2016. Modeling chlorophyll-aconcentrations using an artifi cial neural network for precisely eco-restoring lake basin.EcologicalEngineering, 95: 422-429, https://doi.org/10.1016/j.ecoleng.2016.06.072.
Lu F. 2015. Development of an Integrated GIS-Based System for Surface Water Quality Assessment and Management (GIS-SWQAM). Concordia University, Montreal.
Malekzadeh M, Kardar S, Shabanlou S. 2019. Simulation of groundwater level using MODFLOW, extreme learning machine and Wavelet-Extreme Learning Machine models.GroundwaterforSustainableDevelopment, 9: 100279, https://doi.org/10.1016/j.gsd.2019.100279.
Matouq M, El-Hasan T, Al-Bilbisi H, Abdelhadi M, Hindiyeh M, Eslamian S, Duheisat S. 2013. The climate change implication on Jordan: a case study using GIS and artifi cial neural networks for weather forecasting.JournalofTaibahUniversityforScience, 7(2): 44-55, https://doi.org/10.1016/j.jtusci.2013.04.001.
Moradzaeh A, Khaff afi K. 2017. Comparison and evaluation of the performance of various types of neural networks for planning issues related to optimal management of charging and discharging electric cars in intelligent power grids.EmergingScienceJournal, 1(4): 201-207, https://doi.org/10.28991/ijse-01123.
Moriasi D N, Arnold J G, van Liew M W, Bingner R L, Harmel R D, Veith T L. 2007. Model evaluation guidelines for systematic quantifi cation of accuracy in watershed simulations.TransactionsoftheASABE, 50(3): 885-900, https://doi.org/10.13031/2013.23153.
Nash J E, Sutcliff e J V. 1970. River fl ow forecasting through conceptual models part I—a discussion of principles.JournalofHydrology, 10(3): 282-290, https://doi.org/10.1016/0022-1694(70)90255-6.
Noori N, Kalin L. 2016. Coupling SWAT and ANN models for enhanced daily streamfl ow prediction.JournalofHydrology, 533: 141-151, https://doi.org/10.1016/j.jhydrol.2015.11.050.
Panda R K, Pramanik N, Bala B. 2010. Simulation of river stage using artifi cial neural network and MIKE 11 hydrodynamic model.Computers&Geosciences, 36(6): 735-745, http://dx.doi.org/10.1016/j.cageo.2009.07.012.
Pradhan P, Tingsanchali T, Shrestha S. 2019. Evaluation of soil and water assessment tool and artifi cial neural network models for hydrologic simulation in diff erent climatic regions of Asia.ScienceoftheTotalEnvironment, https://doi.org/10.1016/j.scitotenv.2019.134308.
Ranković V, Radulović J, Radojević I, Ostojić A, Čomić L. 2010. Neural network modeling of dissolved oxygen in the Gruža reservoir, Serbia.EcologicalModelling, 221(8): 1 239-1 244, https://doi.org/10.1016/j.ecolmodel.2009.12. 023.
Saber A, James D E, Hayes D F. 2019. Estimation of water quality profi les in deep lakes based on easily measurable constituents at the water surface using artifi cial neural networks coupled with stationary wavelet transform.ScienceoftheTotalEnvironment, 694: 133690, https://doi.org/10.1016/j.scitotenv.2019.133690.
Santini M, Caccamo G, Laurenti A, Noce S, Valentini R. 2010. A multi-component GIS framework for desertifi cation risk assessment by an integrated index.AppliedGeography, 30(3): 394-415, https://doi.org/10.1016/j.apgeog.2009.11.003.
Sarkar A, Pandey P. 2015. River water quality modelling using artifi cial neural network technique.AquaticProcedia, 4: 1 070-1 077, https://doi.org/10.1016/j.aqpro.2015.02.135.
Singh A, Imtiyaz M, Isaac R K, Denis D M. 2012. Comparison of soil and water assessment tool (SWAT) and multilayer perceptron (MLP) artifi cial neural network for predicting sediment yield in the Nagwa agricultural watershed in Jharkhand, India.AgriculturalWaterManagement, 104: 113-120, https://doi.org/10.1016/j.agwat.2011.12.005.
Smeltzer E, Shambaugh A D, Stangel P. 2012. Environmental change in Lake Champlain revealed by long-term monitoring.JournalofGreatLakesResearch, 38(S1): 6-18, https://doi.org/10.1016/j.jglr.2012.01.002.
Smeltzer E. 2017. Long-Term Water Quality and Biological Monitoring Project for Lake Champlain. VT Department of Environmental Conservation. FEMC. https://www.uvm.edu/femc/data/archive/project/long-term-water-quality- biological-monitoring (access date: May 15, 2019).
Wang F, Wang X, Chen B, Zhao Y, Yang Z F. 2013. Chlorophyllasimulation in a lake ecosystem using a model with wavelet analysis and artifi cial neural network.EnvironmentalManagement, 51(5): 1 044-1 054, https://doi.org/10.1007/s00267-013-0029-5.
Wu N C, Huang J C, Schmalz B, Fohrer N. 2014. Modeling daily chlorophylladynamics in a German lowland river using artifi cial neural networks and multiple linear regression approaches.Limnology, 15(1): 47-56, https://doi.org/10.1007/s10201-013-0412-1.
Yoo C, Kim J M. 2007. Tunneling performance prediction using an integrated GIS and neural network.ComputersandGeotechnics, 34(1): 19-30, https://doi.org/10.1016/j.compgeo.2006.08.007.
Zamanisabzi H, King J P, Dilekli N, Shoghli B, Abudu S. 2018. Developing an ANN based streamfl ow forecast model utilizing data-mining techniques to improve reservoir streamfl ow prediction accuracy: a case study.CivilEngineeringJournal, 4(5): 1 135-1 156, https://doi.org/ 10.28991/cej-0309163.
Zhang Y Y, Gao X, Smith K, Inial G, Liu S M, Conil L B, Pan B C. 2019. Integrating water quality and operation into prediction of water production in drinking water treatment plants by genetic algorithm enhanced artifi cial neural network.WaterResearch, 164: 114888, https://doi.org/10. 1016/j.watres.2019.114888.
 Journal of Oceanology and Limnology2020年6期
- Journal of Oceanology and Limnology的其它文章
- Eff ects of vitamin C defi ciency or excess on growth performance, anti-oxidative response and fatty acid composition of juvenile abalone Haliotis discu s hannai Ino*
- Exploring sensitive area in the tropical Indian Ocean for El Niño prediction: implication for targeted observation*
- Analysis of the typhoon wave distribution simulated in WAVEWATCH-III model in the context of Kuroshio and wind-induced current*
- Characterizing the capability of mesoscale eddies to carry drifters in the northwest Pacifi c*
- Observation system simulation experiments using an ensemble-based method in the northeastern South China Sea*
- Statistical analysis of intensity variations in tropical cyclones in the East China Sea passing over the Kuroshio*
