Emergency Evacuation Plan of the Louvre Based on Cellular Automata Superposition Model
XIEJiayong(谢嘉泳),LIQiqi(李琪琪),LONGJiali
School of Physics and Telecommunication Engineering, South China Normal University, Guangzhou 510006, China
Abstract: The Louvre is a famous French building and a tourist attraction. It is of great significance to make an emergency evacuation plan for tourists. A social force model and cellular automata were established to simulate the crowd evacuation in unidimensional plane, and then the downstairs model was considered to simulate three-dimensional evacuation. Finally the real evacuation situation was simulated, considering the hazard source as well as other factors. The study found that the exit was closer to the corner, and the evacuation distance of descending stairs could be controlled between 0.3 and 0.6 m to maximize evacuation efficiency. The influence of the hazard at the edge of the channel was greater than that at the center of the channel. Therefore, in the process of evacuation, the staff should be guided to the nearest exit, to maintain the optimal distance, the staff to eliminate the danger source in the center of the passage.
Key words: evacuation; self-propelled particles; cellular automaton; optimal exit
Introduction
Increasing terrorist attacks force us to establish a plan for the evacuation of the Louvre in case of emergency[1-2]. In order to let all the tourists leave the building safely as soon as possible, once the evacuation is informed, the tourists need tond the best exit and choose the best escape route according to their own situation at that time,to empty the building as soon as possible.
The Louvre has four regular exits and many secret exits, which should be fully utilized in the modeling process. It is important to consider emergency evacuees and tourist exits. At the same time, given the low security of secret exports, it is necessary to measure whether and when to use these additional exports. Therefore, we established a social force model[3-7]and considered the influence of staircase factors and the location of the hazard. What’s more, the simulation of cellular automata travel is introduced into the hazard source location model, which is also one of the biggest innovations in our article. In addition, we also need to consider the inuence of language[8], waiting time and other factors on the evacuation plan[9-11].
1 Model and Methods
1.1 A social force model
Figure 1 illustrates the floor plan of the Louvre and the schematic diagram of our model. The system size of the model isL, and the exit width iss, anddis the distance between the corner and the exit.

Fig. 1 Social force model: (a) floor plan of Louvre and (b) schematic diagram
Based on the basic principles of the Vicsek model[12]and the leader-follower model, we establish an extended evacuation model of self-propelled particle system with movable exits. The effective self-organizing evacuation strategy is proposed from the closed space.
Let the size of the space beL×L, the particle moves in this space with a boundary of velocityv, and the position of exits can be moved randomly. The direction of particle movement is determined by the interaction between groups. The position and direction of particle movement are randomly distributed. The details can be expressed as[12]
θ=cosθi+sinθj,
(1)
whereθis the direction of movement;iandjare the unit vectors. In this limited range [-π,π), the update of particle position at the next moment is also random, namely[12]
xi(t+1)=xi(t)+xi(t)Δt,
(2)
wherexi(t+1) is the location att+1 andviis the speed ofi. The direction of motion of particles can be modified as[13]

(3)
wheregiis the preferred direction and the weighting factor isω; |〈θi(t)〉r| represents the average direction vector of all particlesjin the interaction radiusrof particlei, which is further revised as[14-15]
〈θi(t+1)〉=∑θj(t)|∑θj(t)|.
(4)
Considering the time everyone displays to the online application when “moving”, in this case, the weight and its preferred direction should be considered as[13]

(5)
wherexsign(t) is the location of the exit signs. Furthergi(t) explanation: whenωapproaches 1, the motion direction of the particle is close to its preferred direction. As it approaches 0, the particle has no preferred direction. That is, its direction of motion is random. When the self-propelled particle hits the wall, it will move under the reflection boundary condition.
1.2 Effect of stair
On the basis of the model, a simple staircase model[16-17]is added, which is the preliminary overall model of the emergency evacuation of the Louvre. There are no obstacles in the corridor and stairs. During evacuation, tourists on each floor shall take the shortest route to the temporary stairway, and speed up and form a queue in the shortest time. The reaction time of all tourists is the same, and the body thickness of the people in the queue is the same. In the process of evacuation, if there is detention at the door or the stairway because of bottleneck factors, it shall be processed as waiting in line. As is the case on all floors, the phenomenon of congestion, crossing or falling is ignored. The types of stairs in the Louvre are the same, and they are all core tube stairs.
The speed of movement on a straight path is[16]
3.617D1+0.95,
(6)
D1=NAp/wLs,
(7)
whereApis the horizontal projected area of an individual,ωis the traffic density, andLsis the length of stream of people. The rate of movement down the stairs is[16]
vD=xdownvL,
(8)
xdown=0.775+0.44 e-0.39D1down·
sin(5.16D1down-0.224).
(9)
Given that people in emergency situations usually have this great psychological pressure and cause the change of escape speed, so a revision is needed[16]
v1=u1vL,
(10)
v2=u1v0,
(11)
u1=1.49-0.36D1,
(12)
wherev1,v2, andvLare the normal stair speed, the speed that people go down stairs in the emergency, and the speed when people move on a straight path. The slant length of each stair is known to beLstair. The effective width of floor platform and intermediate platform isB, and the width of ladder section isb. It is easy to get that the evacuation time of stairwell is[16]

(13)
whereLstair,B, andbare the dimensions of stairwell.
When evacuees on top and bottom meet, two situations will occur. In order to ensure evacuation safety, latecomers need to wait for all the first comers to complete evacuation before starting evacuation. The waiting time corresponding to the two situations is[16]
(14)
wherev3is the speed that people are in terrain affected emergency,tw1is the waiting time of the personnel of theMfloor when the evacuees of the first floor arrive at the stairway, andtw2is the waiting time when the evacuees arrive at the stairway after thekfloor.
Considering that the planar evacuationTtime has been calculated in model, the total evacuation time in this case is[16]
T=T+Tstair, m-1+tw
.
(16)
1.3 Place of the danger source
The cellular automata model[18-19], namely the dynamic search model, is introduced into the static model of the model, but only the dynamic hazard source is simulated here. The simulation method for other potential factors, such as bottlenecks and contingency, is the same. At the initial moment, pedestrians are randomly distributed in the evacuation space. Judge the evacuation space of the pedestrian, calculate the mobile income matrix of the pedestrian in the row, and select the cell with the largest mobile income matrix. After the calculation of the mobile revenue matrix for all pedestrians is completed, the position of pedestrians will be updated uniformly. When the pedestrians move to the exit, they will move out of the evacuation space. Repeat the above steps until all pedestrians leave the evacuation space, and the simulation ends.
Near the hazards consider separately the idealized space, namely (M+2)×(N+2), a two-dimensional(2D) discrete cellular network system, and set up evacuation space for walls on both sides, left and right sides for export. What’s more, pedestrians are separated in different directions by a virtual line. Pedestrians cross this line, which centers on dangerous source, and their radius of influence isR, as shown in Fig. 2[18].
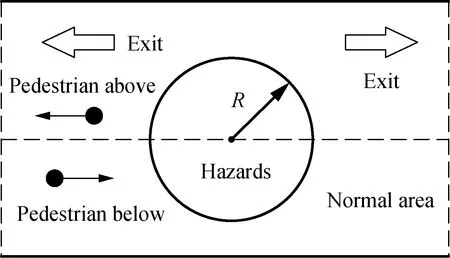
Fig. 2 Schematic diagram of evacuation space
Here, hazard area is defined as 2D normal distribution[17]

(17)
whereRis the radius of influence of hazard source andσ2is the variance of normal distribution.
Moore type field is shown in Fig. 3(a). Mobile income matrix of mobile income combination in each field, as shown in Fig. 3(b), is defined as[18]
Aij=[Eij+(1-a)Dij+aFij](1-ηij),
(18)
whereAijis the yield parameter andDijis the default direction return. The export earnin with wall isEijandFijis the direction of derivative yield. The area control parameter isa.
When the pedestrian is in the normal area,a=0; When pedestrians are in the hazard area,a=1.
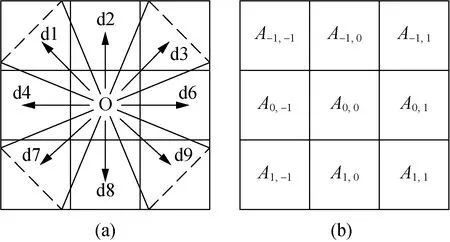
Fig. 3 Rule of cellular automata: (a) Moore type eld and (b) mobile income matrix of mobile income combination in each eld
When the exit is located in the pedestrian field, the attraction of the meta-cell is infinite, and the pedestrian leaves the evacuation space through the exit as far as possible. The exit benefit is defined as[18]

(19)
When pedestrians are located in the hazard area, they will move away from the hazard area as fast as possible. To describe the direction of pedestrians’ escape from the hazard area, the following is[18]
Fij=-gradf(xij,yij),
(20)
whereFijis the directional derivative yield.
When pedestrians are in the normal area, please move in the default direction. At this point, pedestrians are divided into normal pedestrians and pedestrians flee from the source of danger, and move towards the nearest exit. There is[18]
1.4 Situation of the intersection
Then, we consider the corridor connecting the intersection, and give the evacuation method when queuing. In the actual evacuation process, due to panic, conformity and other reasons, the evacuees cannot fully follow the guidance and cooperate with the diversion. According to the population distribution rules withdrawn from the organization, the crowd evacuation process is carried out for each source point: the crowd enter the evacuation road from the source node and proceed along the direction of movement of the convergence point to reach the intersection. And they pass the road in sequence, enter through continuous stretching motion and cross nodes, and finally reach the final node.
The evacuation speed of people is affected by the degree of traffic congestion. When the degree of congestion is small, the evacuation speed of people basically does not interfere with each other and evacuates at the maximum speed. On the contrary, the evacuation speed will decrease with the increase of the degree of traffic congestion[20], which can be described by exponential function. Therefore, at timet, the evacuation speed of people on section (i,j) can be expressed as

(22)
Set the decision variablexijto represent the relationship between the road section and evacuation path is[20]
(23)
Then the evacuation time of people flow at nodeois[20]

(24)
whereUis the number of nodes, and theowithdare the nodes.
Therefore, the evacuation timeTffor the stream of people is expressed as the maximum value ofTod, and obviously, it is also the final evacuation completion timetfinalof the entire network of the stream of people, that is[20]

(25)
whereTfis the crowed evacuation time.
2 Results and Discussion
2.1 Exit and visual field radius
We change the number of groupN, system sizeL, the positiond, width of the exitsand the weighing factor of preferred directionωto investigate the collective evacuation. Our results of MATLAB simulation are shown in Fig. 4.
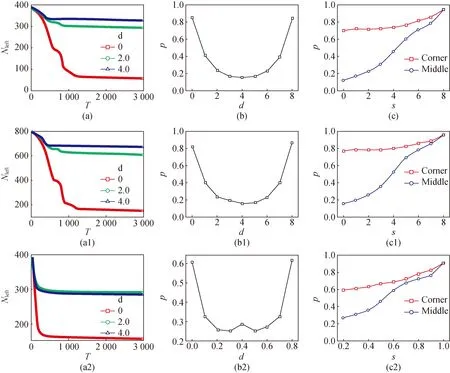
Fig. 4 Rules of the system with no preferred direction(no exit sign ω=0)
Figures 4 (a), (a1), (a2) are the number of individuals left in the spaceNleftas time stepTfor the different distances between the corner and the exit d; The evacuation proportion of the grouppas a function ofdatT=500 was shown in Figs. 4 (b), (b1), (b2) was shown in Figs. 4 (b), (b1), (b2). In Figs. 4 (c), (c1), (c2),pis a function of different width of the exitswhen the exit is located in the corner and middle of the boundary.
MATLAB is used to simulate the relationship between visual field radius[21-22]and evacuation time. The results are shown in Table 1.
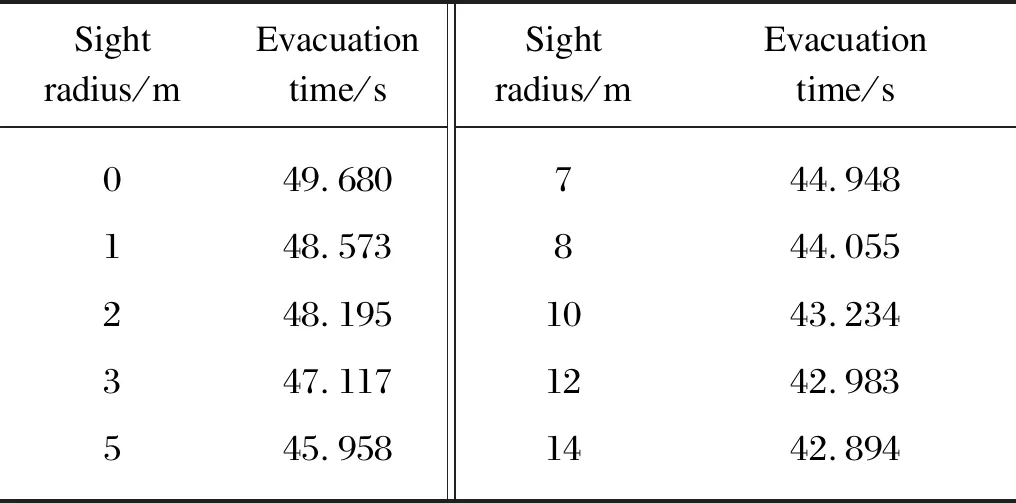
Table 1 Relationship between visual field radius and evacuation time
When the exit is located at the edge of the corner and the middle. In Figs. 4(a), (b), and (c),N=400,L=1.0,s=2.0; in Figs. 4(a1), (b1), and (c1),N=800,L=10,s= 2.0; in Figs. 4(a2), (b2), and (c2),N=400,L=1.0,s=0.2. In Figs. 4 (a), (a1), and (a2), the smaller the distancedbetween the corner and the exit, the higher the degree of population evacuation, indicating that the closer the exit is to the corner, the higher the efficiency of crowd evacuation. Figures 4 (b), (b1), and (b2) also verify this conclusion. According to Figs. 4 (c), (c1), and (c2), no matter where the exit is, the evacuation proportion increases with the increase of exit width, so we can know that a larger exit width is conducive to crowd evacuation.
It is further inferred from the simulation results that increasing the number of exits will reduce the evacuation efficiency of personnel to a certain extent. It can be seen from Fig. 5 that adding a certain mark at the exit can increase the efficiency of evacuation. While some conclusions have been reached, more consideration needs to be given. In the current simulation system, we only consider the two-dimensional rectangular space and ignore some factors, such as visual angle, noise, and oval stadium. More complex models lead to more complex results.
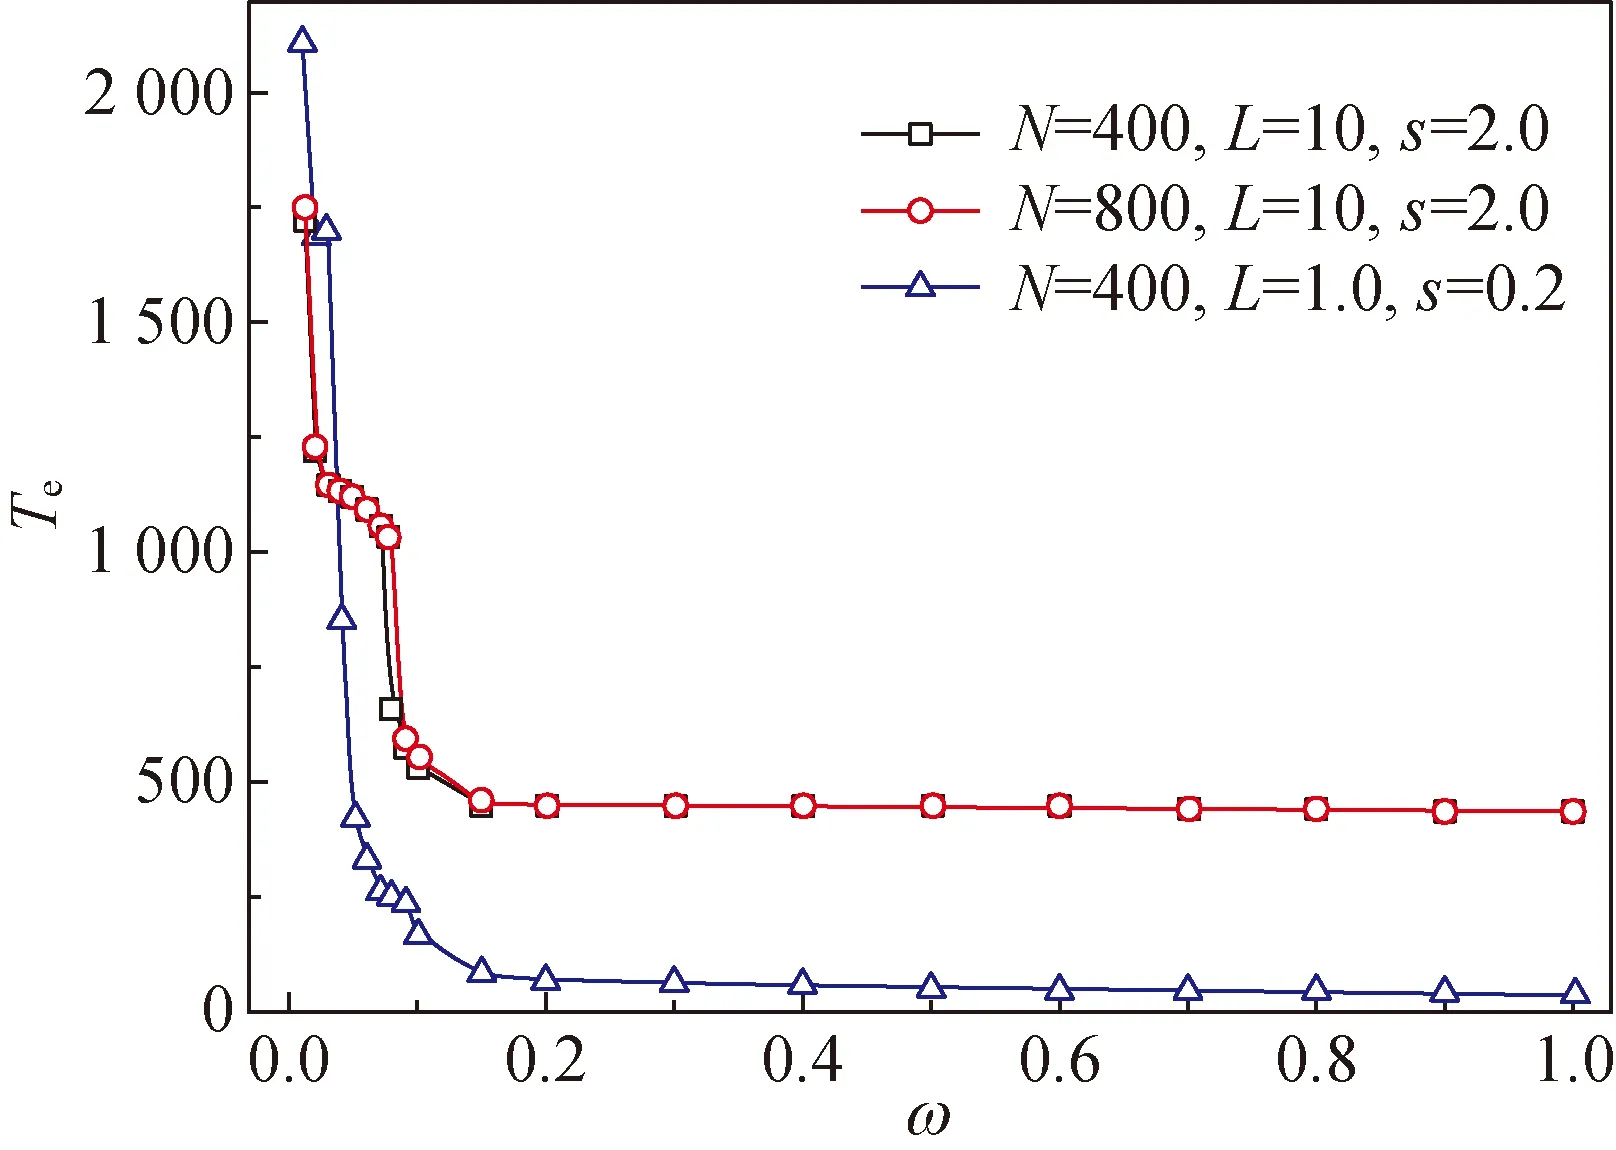
Fig. 5 Evacuating time needed for all particles Te as a function of weighting factor with one comer exit (with exit sign)
According to the above model, MATLAB software is used to compile the program. Taking the actual situation of the Louvre as an example, the parameters are set according to the specific situation, and the time for all evacuees to escape from the building can be obtained.
It can be seen from Fig. 6 that when the total number of evacuations gradually increases, the total time required for complete evacuation of all evacuations increases with a dotted line, which indicates that the total evacuation time and total evacuation are basically positively correlated if the waiting conditions are not considered. According to Figs. 6 (a) -(b) fold points on the polyline occur when the upper and lower evacuation teams meet and when the evacuation teams on the same floor meet. As the waiting time increases, the total evacuation time increases by a larger margin.When the total number of evacuees continues to increase, the detention waiting time will gradually become the most important factor affecting the total evacuation time.
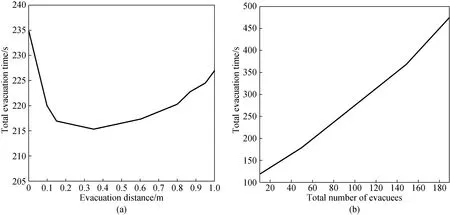
Fig. 6 Relation chart of the total evacuation time: (a) total evacuation time and distances and (b) total evacuation time and total number of evacuation
As shown in Fig. 6, evacuation time decreases first and then increases with the increase of evacuation distance. When the evacuation distance is 0.35 m, the evacuation time reaches the minimum value.When the evacuation spacing is between 0.1 m and 0.6 m, the influence of evacuation spacing on evacuation time is small. Considering the best evacuation efficiency and the degree of recognition of the evacuation interval, and to prevent collisions between evacuees, the 0.5 m evacuation interval suggested above is reasonable[23]. Therefore, in the evacuation exercise or actual evacuation process, it is required that the evacuation distance should be controlled within 0. 3-0. 6 m as far as possible to ensure the high efficiency of evacuation.
2.2 Place of the danger source
In the simulation study, the density of pedestrian flowing in the evacuation line is defined as the number of pedestrians in the system and the number of cells in the pedestrian movement interval ratio ofMtoN, pedestrian evacuation timeTis defined as the number of time steps required by all pedestrians in the system to leave the room[24]. The evacuation timeTof the system is the average result of 20 samples. Unless otherwise specified, the parameter isM=20 andN=20. Three representative schemes of hazard location distribution are shown in Fig. 7.
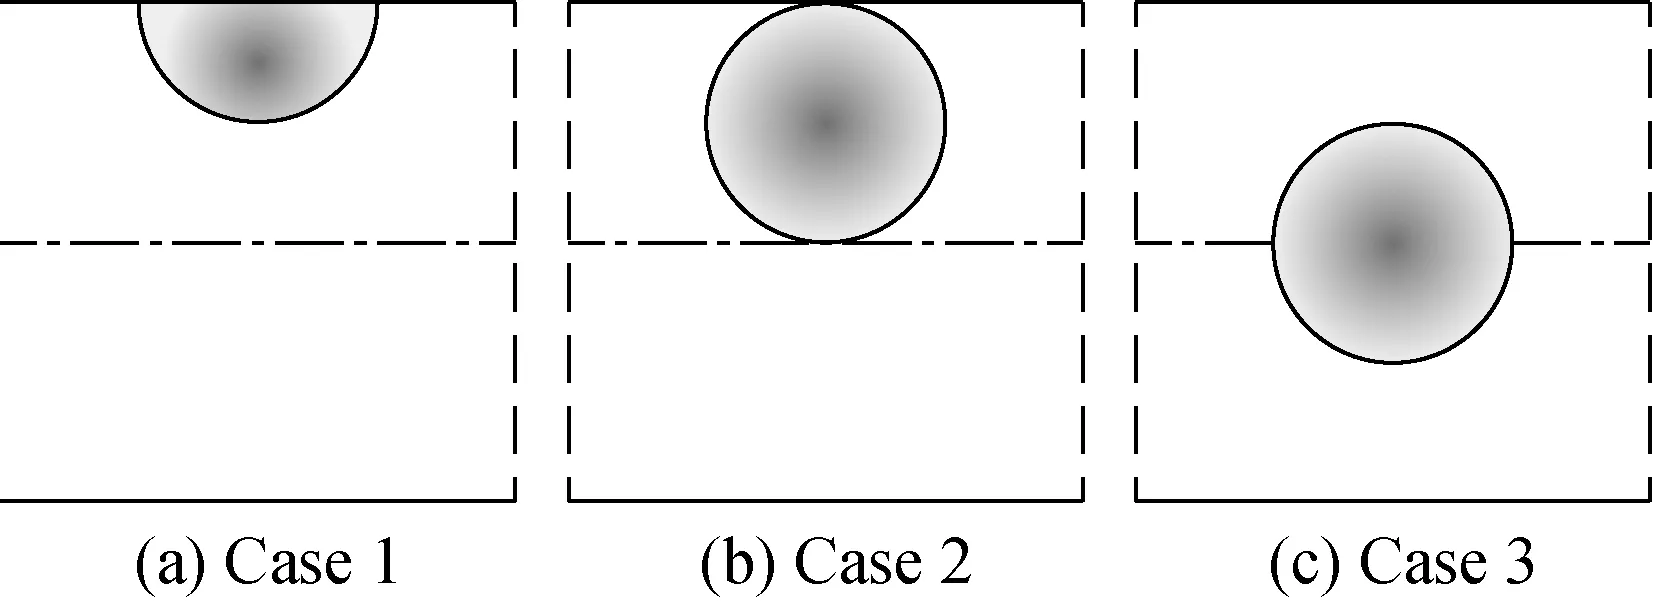
Fig.7 Three representative schemes of hazard location distribution: (a) the hazard at the wall; (b) the hazard at the upper half of evacuation space; (c) the hazard at the central axis of evacuation space
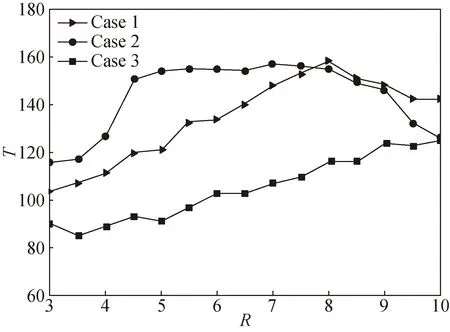
Figure 8 shows the graph of the change of evacuation timeTwith hazard source radiusρin the case of pedestrian density andρ=0.9. As can be seen in Fig. 8(a), with the increase ofR, the required evacuation time of Case 1 and Case 3 is getting longer and longer, while the evacuation time of Case 2 decreases gradually afterR>6. As can be seen in Fig. 8 (ρ=0.5), when the density is high, with the increase ofR, the evacuation time of Case 3 becomes longer and longer. Case 2 presents a relatively stable state when 4
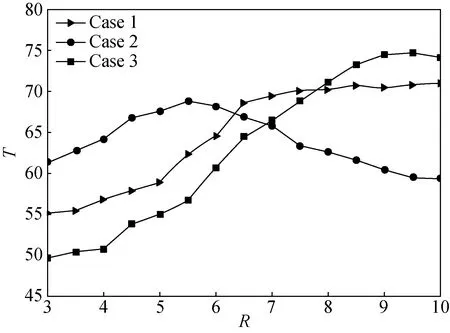
(a) ρ=0.5 (b) ρ=0.9
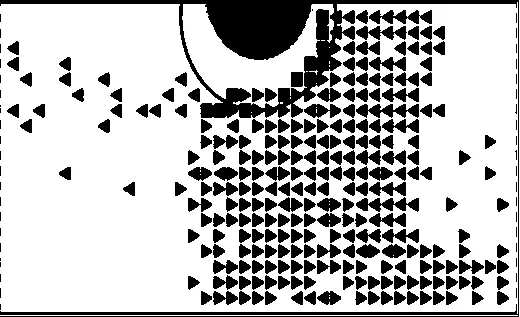
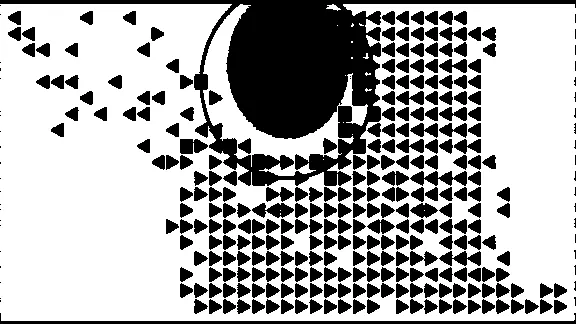
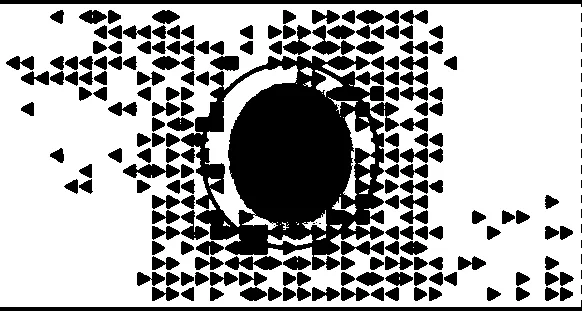
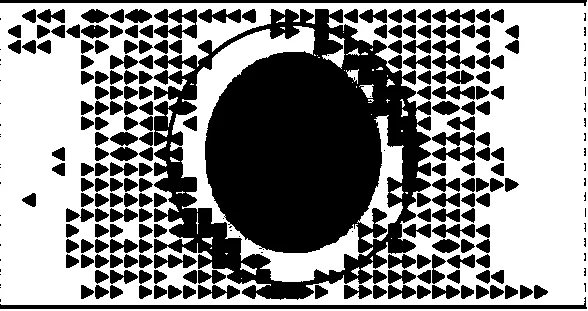
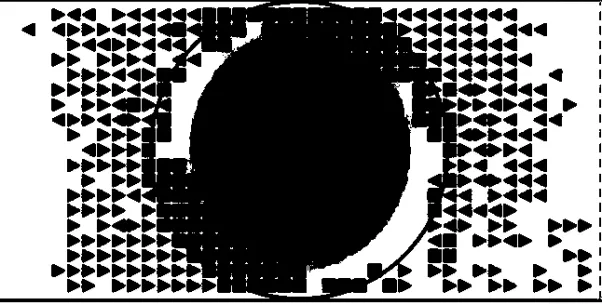
Figure 9 shows the typical spatial and temporal evolution patterns of different hazard radiusRand location distribution schemes when pedestrian densityR=0.9. By observing Figs. 9(a), (b) and (c), whenRis small, Case 1 and Case 2 cause the upper pedestrian to cross the dividing line due to the hazard source blocking the upper pedestrian and form a hedge with the lower pedestrian, which affects the evacuation efficiency. In Case 3, there is a gap between the upper and lower sides of the hazard source, through which pedestrians pass, and the congestion is not obvious. However, with the increase ofR, as shown in Figs. 9(c), (d) and (e), the gap between the upper and lower sides becomes smaller and smaller, so that it is completely blocked. Pedestrians fleeing from the hazard source area are completely blocked together with those in the normal area, which greatly affects the evacuation efficiency. Therefore, the evacuation efficiency of Case 3 decreases with the increase of the radius of the hazard source.
The influence of the hazard source at the edge of the passage is greater than that at the center of the passage. With the increase of the influence radius of the hazard source located in the center of the passage, the required evacuation time increases linearly.
In most cases, the larger the scope of the danger source, the lower the evacuation efficiency, and the greater the possibility of congestion.
(a)
(b)
(c)
(d)
(e)
2.3 Situation of the intersection and other factors
According to the actual road network of the Louvre, the source node, intersection node and sink node are numbered respectively to construct the crowd evacuation road network. The flow of people at each source node is evacuated according to the crowd diversion model constructed. The solving process is shown in Fig. 10.
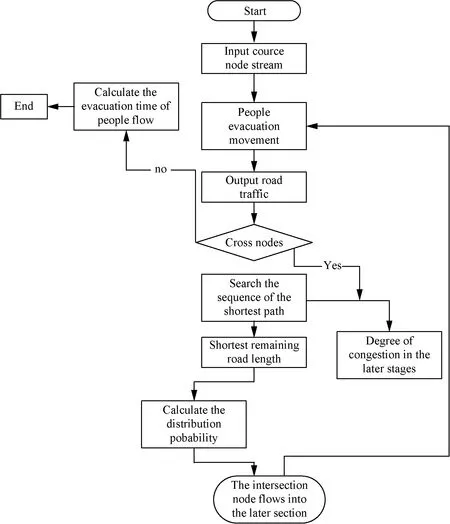
Fig. 10 Calculation flowchart
Dijkstra algorithm is an effective algorithm for solving the classical shortest circuit problem[25]. In this paper, Dijkstra algorithm is used to search the shortest path at the intersection node containing each post-sequence section, and to find the length of the post-sequence shortest remaining path.
According to the real-time congestion degree of evacuation roads and the order of longest remaining shortest roads, the probability of crowd distribution at a road intersection, the traffic input and output relationship of evacuation roads is analyzed. We have formulated rules for evacuation networks for crowds and traffic distribution at road intersections. In addition, a cross-node cross evacuation crowd flow model is set up after the evacuation, which provides reasonable guidance for emergency crowd evacuation. The allocation of the stream of people at each intersection can reduce the evacuation time consumption of the entire road network, guide the balanced distribution of people flow in space and time, effectively prevent congestion, and improve the evacuation efficiency.
In the process of evacuation, the influence of evacuation speed, visual field radius and evacuation environment of the disabled should be considered[26]. Using the stairs of the barrier-free passage, the disabled staff members for the first time in the field escape from the barrier-free passage after the emergency. On the premise that the rights and needs of all people in the building are balanced, and the elevator is not occupied by ordinary people, the best choice for the disabled to escape is the elevator, which will play an important role in the shelter of the disabled.
The average speed of visually impaired people is basically the same when there is a guide for each person and when there is no guide for evacuation. However, in the mode of centralized evacuation by a single guide, the average walking speed is much higher than that in the other two cases. Therefore, single guide is adopted for evacuation of visually impaired people.
3 Conclusions
In summary, we have proposed a social force model for the group escape considering movable exits and leader-follower effect on the basis of the Vicsek model. We investigate the evacuation behavior in our model with various system parameters via simulations. The optimal location of exit for collective evacuation is the corner of a limited square-shaped cell. Increasing the intensity of exit sign will speed up the evacuation quickly, and then it will take no further effect when the intensity of sign exceeds a certain value. And multi exits will hinder the evacuation.
In addition, considering the factors, such as the spacing of the stairs and height under the evacuation, the evacuation spacing control within certain range can maximize the evacuation efficiency. Furthermore,the impact of the hazard source at the edge of the channel is greater than the impact of the hazard source at the center of the channel. Other factors such as tourists’ language and the disabled will also affect the flight time of passengers to a certain extent.
Our study is rather significant to make more safe environment. Besides, our research is likely to be useful in designing a secure passage for a large enclosed place. Although we have drawn some conclusions, more considerations still need to be done. Our model does not take into account all the factors, such as the possible competition and stampede in the process of tourist evacuation. We will explore some complex models to present more realistic effect in future.
 Journal of Donghua University(English Edition)2020年4期
- Journal of Donghua University(English Edition)的其它文章
- Undrained Stability Analysis of Three-Dimensional Rectangular Trapdoor in Clay
- Comprehensive Evaluation Method for Safety Performance of Automobile Textiles
- Method for Detecting Fluff Quality of Fabric Surface Based on Support Vector Machine
- Preserving Data Privacy in Speech Data Publishing
- Zero-Sequence Current Suppression Strategy for Open-End Winding Permanent Magnet Synchronous Motor Based on Model Predictive Control
- Improved Fibroblast Adhesion and Proliferation by Controlling Multi-level Structure of Polycaprolactone Microfiber
