Population Genetic Analysis of Sillago nigrofasciata (Perciformes:Sillaginidae) Along the Coast of China by Sequencing Mitochondrial DNA Control Region
ZHANG Xiaomeng, GAO Tianxiang, YE Yingying, SONG Na, YU Zhengsen,and LIU Yong
Population Genetic Analysis of(Perciformes:Sillaginidae) Along the Coast of China by Sequencing Mitochondrial DNA Control Region
ZHANG Xiaomeng1), GAO Tianxiang2), YE Yingying3), SONG Na1), YU Zhengsen1),and LIU Yong4),*
1),,266003,2),,316022,3),,316022,4),,200090,
, a small to moderate size nearshore species, is newly found along the eastern and southern coasts of China. The present study is carried out in order to analyze the population genetics of the. The control region sequence of mitochondrial DNA revealing 73 haplotypes were obtained from 162 individuals collected at 8 locations along the coast of China. The wholepopulation along the coast of China showed a low nucleotide diversity (0.012) and a high population diversity (haplotype diversity) (0.943), and all the 8 local populations showed low nucleotide diversities (0.014–0.001), suggesting the protective measures are effective. The haplotypes of the 8 local populations were widely distributed in haplotype network diagram and neighbor-joining phylogenetic tree, while no branch associating with sampling locations was detected. Recent gene flow analysis showed asymmetric gene exchanges among local populations. The pairwiseSTvalues and unweighted pair-group method with arithmetic mean (UPGMA) tree revealed a certain amount of genetic difference among local populations. Moreover, analysis of molecular variance (AMOVA) reflected genetic differences between hypothetical subdivision groups. Neutral test and mismatch distribution of pairwise nucleotide suggestedmay have experienced recent population expansion events. The historical geographic events associating with ice age may be the main explanation to the heterogeneity among local populations with short geographic distances, and the homogeneity among local populations with long geographic distances.
;sp.;population genetics; mitochondrial DNA; control region; coast of China
1 Introduction
The fish species of family Sillaginidae distribute along the coasts of Indian Ocean and western Pacific Ocean. They are small to middle in size, inhabit shoals and estuaries, feed on benthic or epibenthic organisms, and are va- luable in commerce and scientific research (McKay, 1992).belongs to PerciformesSillaginidae, which can be found in the eastern and southern coasts of China. It is characterized by a distinct long black band near the lateral line of body (Xiao, 2018). The article that names the new species (sp.) by the discover is to be pub- lished. The research progresses have been made in other species from genus, for example, their population genetics, morphology, microsatellite, evolution, transcrip- tome and reference genome (Zhang, 2013; Wang, 2014; Xiao, 2015; Wu., 2016; Xu., 2018; Gao., 2019;Tian., 2019). The present study is on the population genetic structure of the wholepopulation along the coast of China by sequencing mitochondrial DNA control region.
Population genetic studies can reveal genetic differentiation within and among populations, and many molecular markers are available for such purposes (Liu, 2017). The mitochondrial DNA markers have been indispensable to related studies because of their advantages compared to the nuclear DNA markers, for example, faster evolution, maternal inheritance and absence of gene recombination (Hamilton, 2017; Wang, 2017). Moreover, the mitochondrial DNA control region is widely used to detect ge- netic differences. It is at the fastest evolutionary rate among the mitochondrial DNA fragments thus more suitable for intraspecific population genetic studies than other mitochondrial DNA fragments (Grant., 2012; Camargo., 2016; Marques., 2016). Actually, many important research progresses have been made in many fish species including,,,,, andbased on its use, which have helped to resolve problems of population genetics and evolution (Li., 2015; Valenzuela-Quiño- nez., 2016; Vella and Vella, 2017; Baisvar., 2019; Moreira., 2019; Zhong., 2019).
Population genetic studies on fish species are important bases of related researches (Ward and Grewe, 1994; Do- naldson and Wilson, 1999). In present study, we investigatedthe population genetics ofpopulationalongthe coast of China by sequencing mitochondrial DNA con-trol region, and provided a reference for further researches and applications.
2 Materials and Methods
2.1 Sampling
A total of 162 individuals were obtained at 8 locations along the eastern and southern coasts of China (Fig.1; Table 1). Muscle tissues each fish individuals were isolated and stored in ethanol (95%) at −20℃.
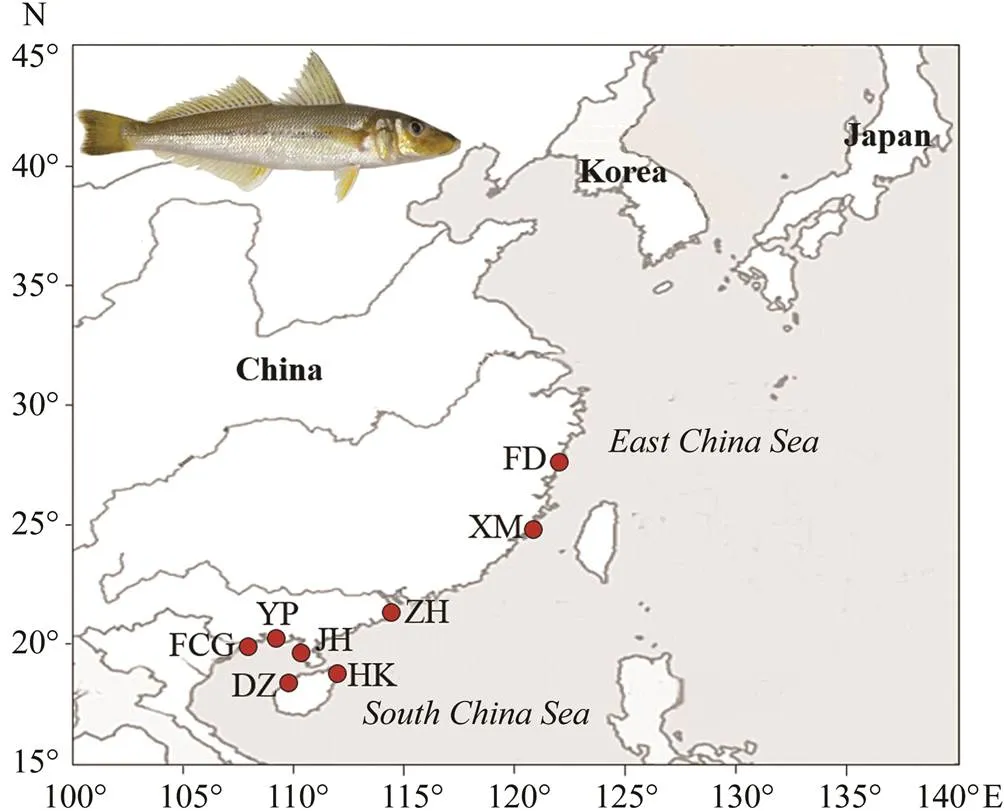
Fig.1 Sampling locations. Details are shown in Table 1.
2.2 Template DNA Extraction, PCR and Sequencing
The template DNA extraction was performed with the proteinase K-phenol-chloroform method as Maniatis. (1982).
Mitochondrial DNA control region sequences ofwere amplified with the primers DLR (5’-TTA ACT TAT GCA AGC GTC GAT-3’) and DLS (5’- CCC ACC ACT AAC TCC CAA AGC-3’). The PCR was performed in a 25μL volume containing 1×PCR buffer(containing MgCl2), dNTP (0.2mmolL−1each), primers (0.4μmolL−1each),DNA polymerase (1 unit) and tem- plate DNA (10–100ng). PCR was thermocycled from aninitial denaturing (94℃ for 5min), followed by 35 cycles of denaturing (45s at 94℃), annealing (45s at 50℃) and elongation (45s at 72℃) and an additional elongation (72℃ for 10min).
The qualified PCR products were sequenced from two ends after checking through agarose gel electrophoresis (1.0%).
2.3 Data Analysis
The indices of genetic diversity based on all of the sequences edited with SeqMan were calculated with Arlequin 3.5 and DnaSP 5.10, which included the population diversity (haplotype diversity), the nucleotide diversity, and the mean number of pairwise differences (Librado and Ro- zas, 2009; Excoffier and Lischer, 2010). The haplotype net-work diagram was constructed with Arlequin 3.5 while theNJ tree (neighbor-joining phylogenetic tree) was built with MEGA 7.0 by the optimal substitution model obtained with Modeltest 3.7 (Posada and Crandall, 1998; Excoffier and Lischer, 2010; Kumar., 2016).
The analysis ofrecent gene flow was performed with Lamarc 2.1.10 while relevant indices including(effective population size) and(immigration rate) were calculated (Kuhner, 2006). With Arlequin 3.5, the exacttest was performed while the values ofST(pairwise fixation index) were calculated to detect genetic differences (Weir and Cokerham, 1984; Excoffier and Lischer, 2010). The UPGMA (unweighted pair-group method with arith- metic mean) tree based on genetic distance was built with MEGA 7.0 before AMOVA (analysis of molecular variance) was performed with Arlequin 3.5 to detect population genetic structures (Excoffier., 1992; Excoffier and Lischer, 2010; Kumar., 2016).
The demographic history and population dynamic were investigated with the neutral test as well as the mismatch distribution by Arlequin 3.5 (Excoffier and Lischer, 2010). The significant negative values of the neutral test (Taji- ma’sandS) as well as the good fitting degree of the mismatch distribution (demographic expansion model and spatial expansion model) can be the signatures of population expansion events (Tajima, 1989; Rogers, 1995; Fu, 1997). The time since the population expansion can be estimated according to the equation=2, whereis the expansion parameter (an index of mismatch distribution),is mutation rate (depend on the specific species and length of se- quence under study), andis theestimated time.
3 Results
All the sequences obtained were uploaded to the GenBank with the accession numbers: MN256159-MN2563 21. The repeat segments within each sequence weredeleted before the data analyses.
A total of 73 haplotypes were obtained from the wholepopulation. As shown in Table 1, the whole population diversity was 0.943 and the nucleotide diversity was 0.012. The highest and lowest sub-population diver- sities werefound in ZH and JH sub-populations, which were 0.978 and 0.455, respectively. XM sub-population had the highest nucleotide diversity while JH sub-popu- lationhad the lowest one, which were 0.014 and 0.001, res- pectively.
There were 73 haplotypes among 162individuals of, of them 11 were shared and 62 were unique. These haplotypes varied in the number of nucleotides be- tween 1 and 16. The largest haplotype was haplotype 3 which was shared by 35 individuals from 6 sub-populations (FCG, FD, JH, XM, YP and ZH). It was the center of haplotype network diagram. In haplotype network dia- gram (Fig.2) and NJ tree (Fig.3), the haplotypes of 8 sub- populations were widely distributed among sampling locations. Such a pattern may be caused by historical geographic events associating with ice age (He., 2014; Yan., 2015).
DZ and HK sub-populations were not considered in genetic structure analysis because of insufficient number of samples. Recent gene flow analysis showed that the gene exchanges among 6 sub-populations was asymmetric, and the most and the least migrations were detected in XM and JH sub-populations, respectively (Table 2). Exacttest,STvalues and UPGMA tree were basically consis- tent. They together illustrated the genetic differentiationamong 6 sub-populations. The differentiation was distinct between group 1 (FCG, FD and JH) and group 2 (XM, YP and ZH) (Fig.4).

Table 1 Genetic diversity indices and sample information ofSillago nigrofasciata sub-population along the coast of China
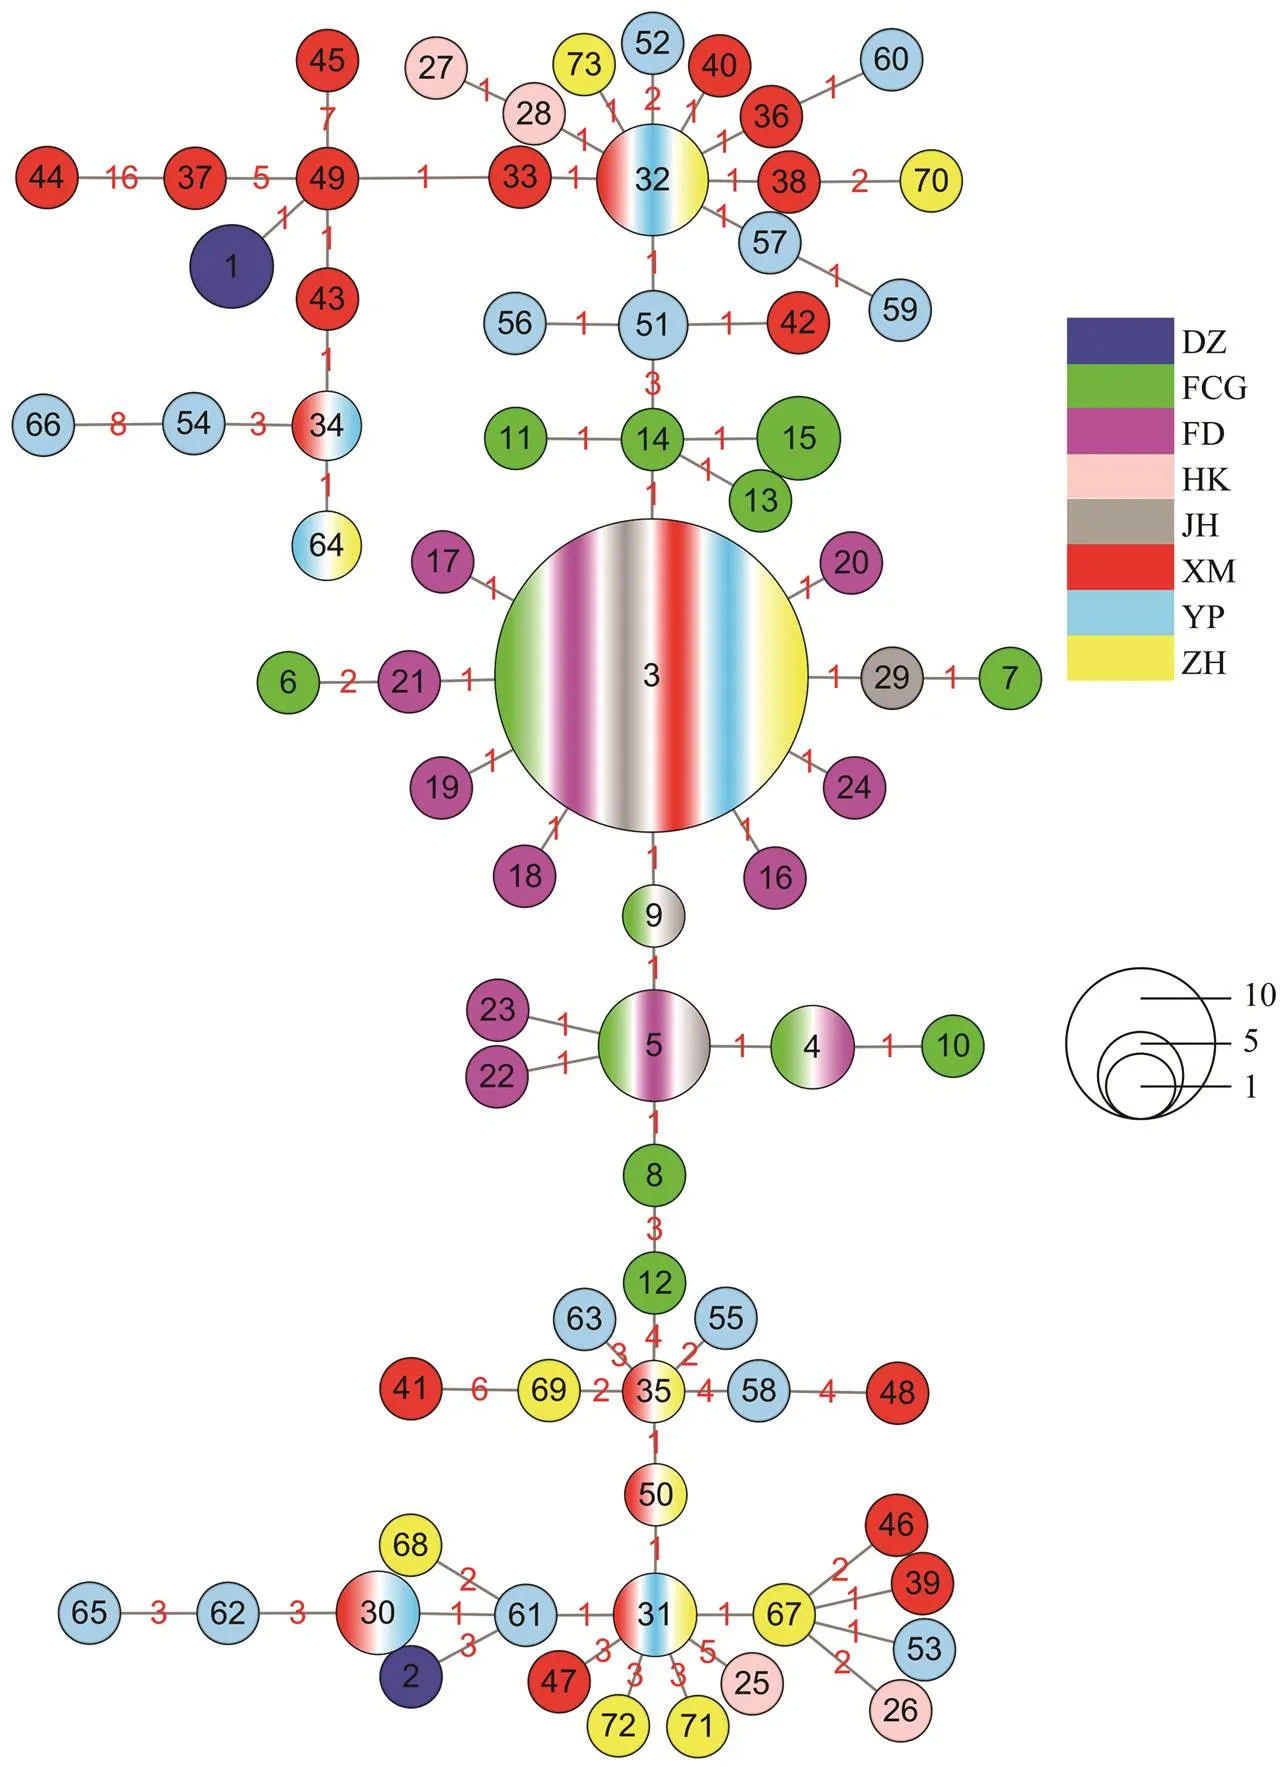
Fig.2 Haplotype network diagram showing the genetic relationship of Sillago nigrofasciata mitochondrial DNA control region haplotypes. The black numbers in circles represent haplotypes. The color of a circle represents its sub-populations. The size of a haplotype represents its frequency. The red numbers on lines joining haplotypes represent the number of nucleotide substitutions.
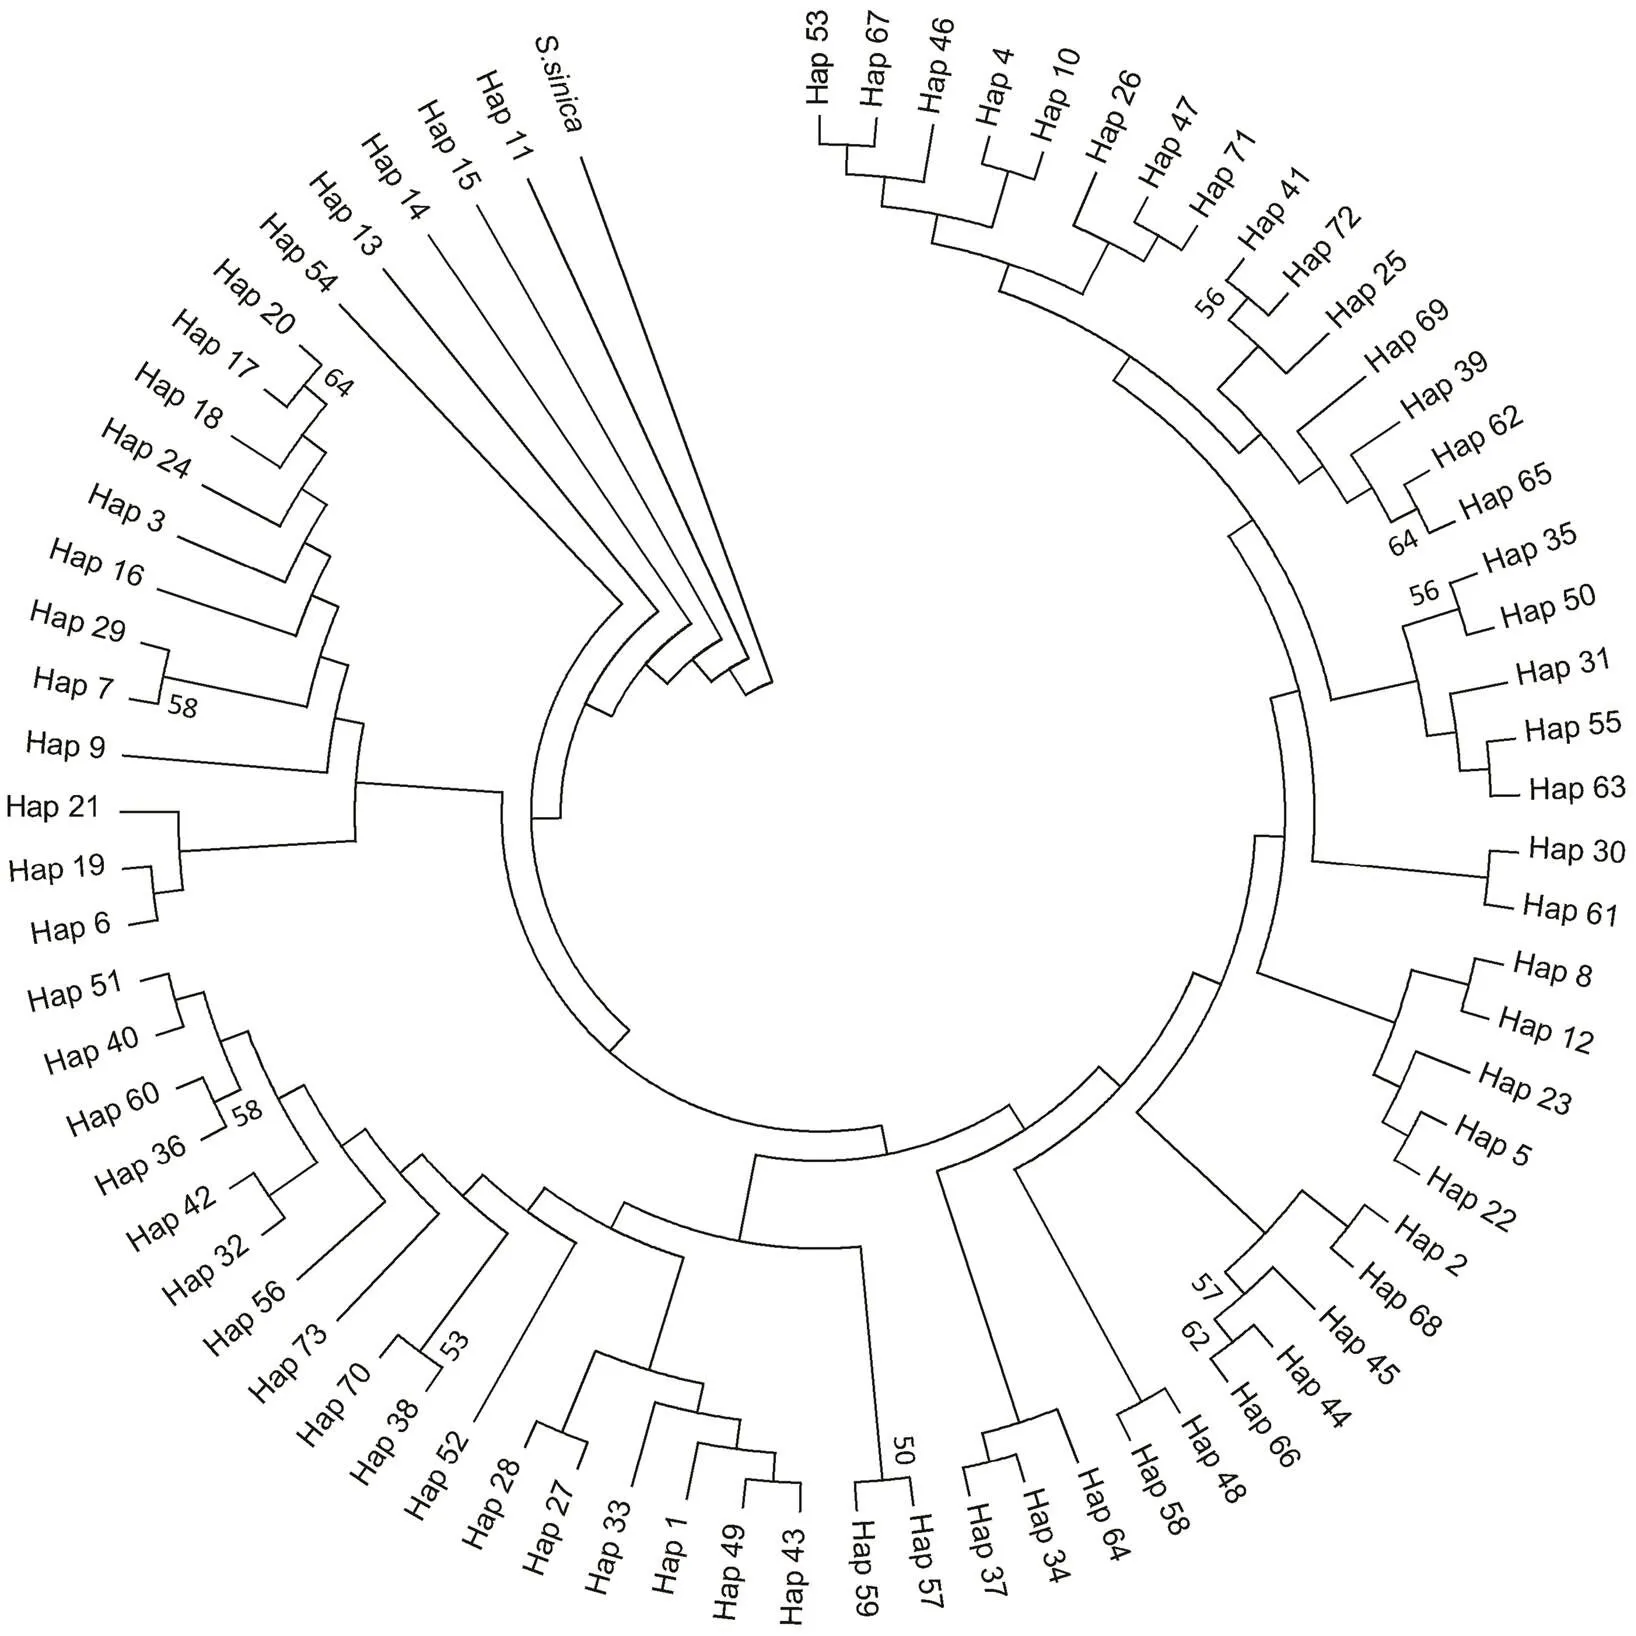
Fig.3 NJ tree showing the genetic relationships among S. nigrofasciata mitochondrial DNA control region haplotypes. The congener S. sinica is the outgroup. Bootstraps above 50% in 1000 replicates are shown.

Table 2 Gene flow estimates of six sub-populations with effective population size (θ) and number of recent migration (θM)
For AMOVA grouping methods, sub-populations among them less genetic difference was detected were in a group while those among them shorter geographical distances were found were in a group.A certain amount of genetic difference (ST=0.348,<0.01) was shown within 6 sub- populations by the first method (one gene pool). The se- cond grouping method with the division of group 1 (FCG, FD and JH) and group 2 (XM, YP and ZH)showed the highest value of the source of variance among hypothetical subdivision groups (45.67%) and the highest value of genetic differences (CT=0.457) (Table 3). Thusall sub- populations can be divided into the two groups, between them more genetic difference was detected while within them less genetic difference was detected.
The neutral test showed significantly negativeSvaluesofwhole population (s=−24.978,=0.000), group 1 (s=−17.122,=0.000) and group 2 (s=−25.271,=0.000) (Table 4), suggesting population ex- pansion events may exist (Fu, 1997). Consistent with the results of neutral test, the mismatch distribution ofpopulation with a good fitting degree (SSD=0.740 for the demographic expansion/population expan- sion model,SSD=0.370 for the spatial expansion model) (Fig.5) also suggested population expansion events (Har- pending, 1994). The mismatch distribution of groups 1 and 2 showed good fitting degrees also. In group 1, theSSDwas 0.750 as was calculated using demographic expansion model, andSSDwas 0.960 as was calculated using spatial expansion model. In group 2,SSDwas 0.600 as was calculated with demographic expansion model, and 0.380 as was calculated using spatial expansion model (Fig.6; Fig.7).
There is not a universal unit mutation rate in mito- chondrial DNA control region suitable for the equation to calculate time point of population expansion events be- cause it is different among different fish species (Donald- son and Wilson, 1999; Iwamoto., 2012; Kwan., 2012; Winkelmann., 2013). The estimated time point at which the population expansion events forvaried between 77012 and 154025 years (=7.424; unit mutation rate=5%–10% per million years), a time window within the ice age (late Pliocene or late Pleisto- cene) (Imbrie.,1992; Muss., 2001). Our esti- mated time of the population expansion events ex- panded from 26421 to 52842 years (=2.547; late Pleis- tocene) for group 1 and from 57624 to 115249 years (=5.555; late Pleistocene) for group 2.
4 Discussion
4.1 Present Situation and Formation of Genetic Diversity
whole population studied was charac- terized by a high population diversity and a low nucleotide diversity. This characteristics may be caused by the stability of effective population size and the bottleneck effect, founder event, and population expansion events. The star-like structure of the haplotype network diagram illustrated the same influence (Avise., 1987; Slatkin and Hudson, 1991; Grant and Bowen, 1998; Li, 2014). Liv- Living conditions were harsh in ice age. Many marine species may survive only in compressed ecosystems (shelters). Such situation may have reduced their effective population sizes and genetic diversities (bottleneck effect) (He- witt, 2000). Meanwhile, population expansion events inspired by the improvement of living conditions may have accumulated the quantity of haplotypes with the increase of biomass (founder event) (Avise., 1984). These two processes relating to biomass change can make a stable and small effective population size for the characteristics shown (Rogers and Harpending, 1992). Thus the historical geographic events may be the main factor in forming the present genetic diversity of.
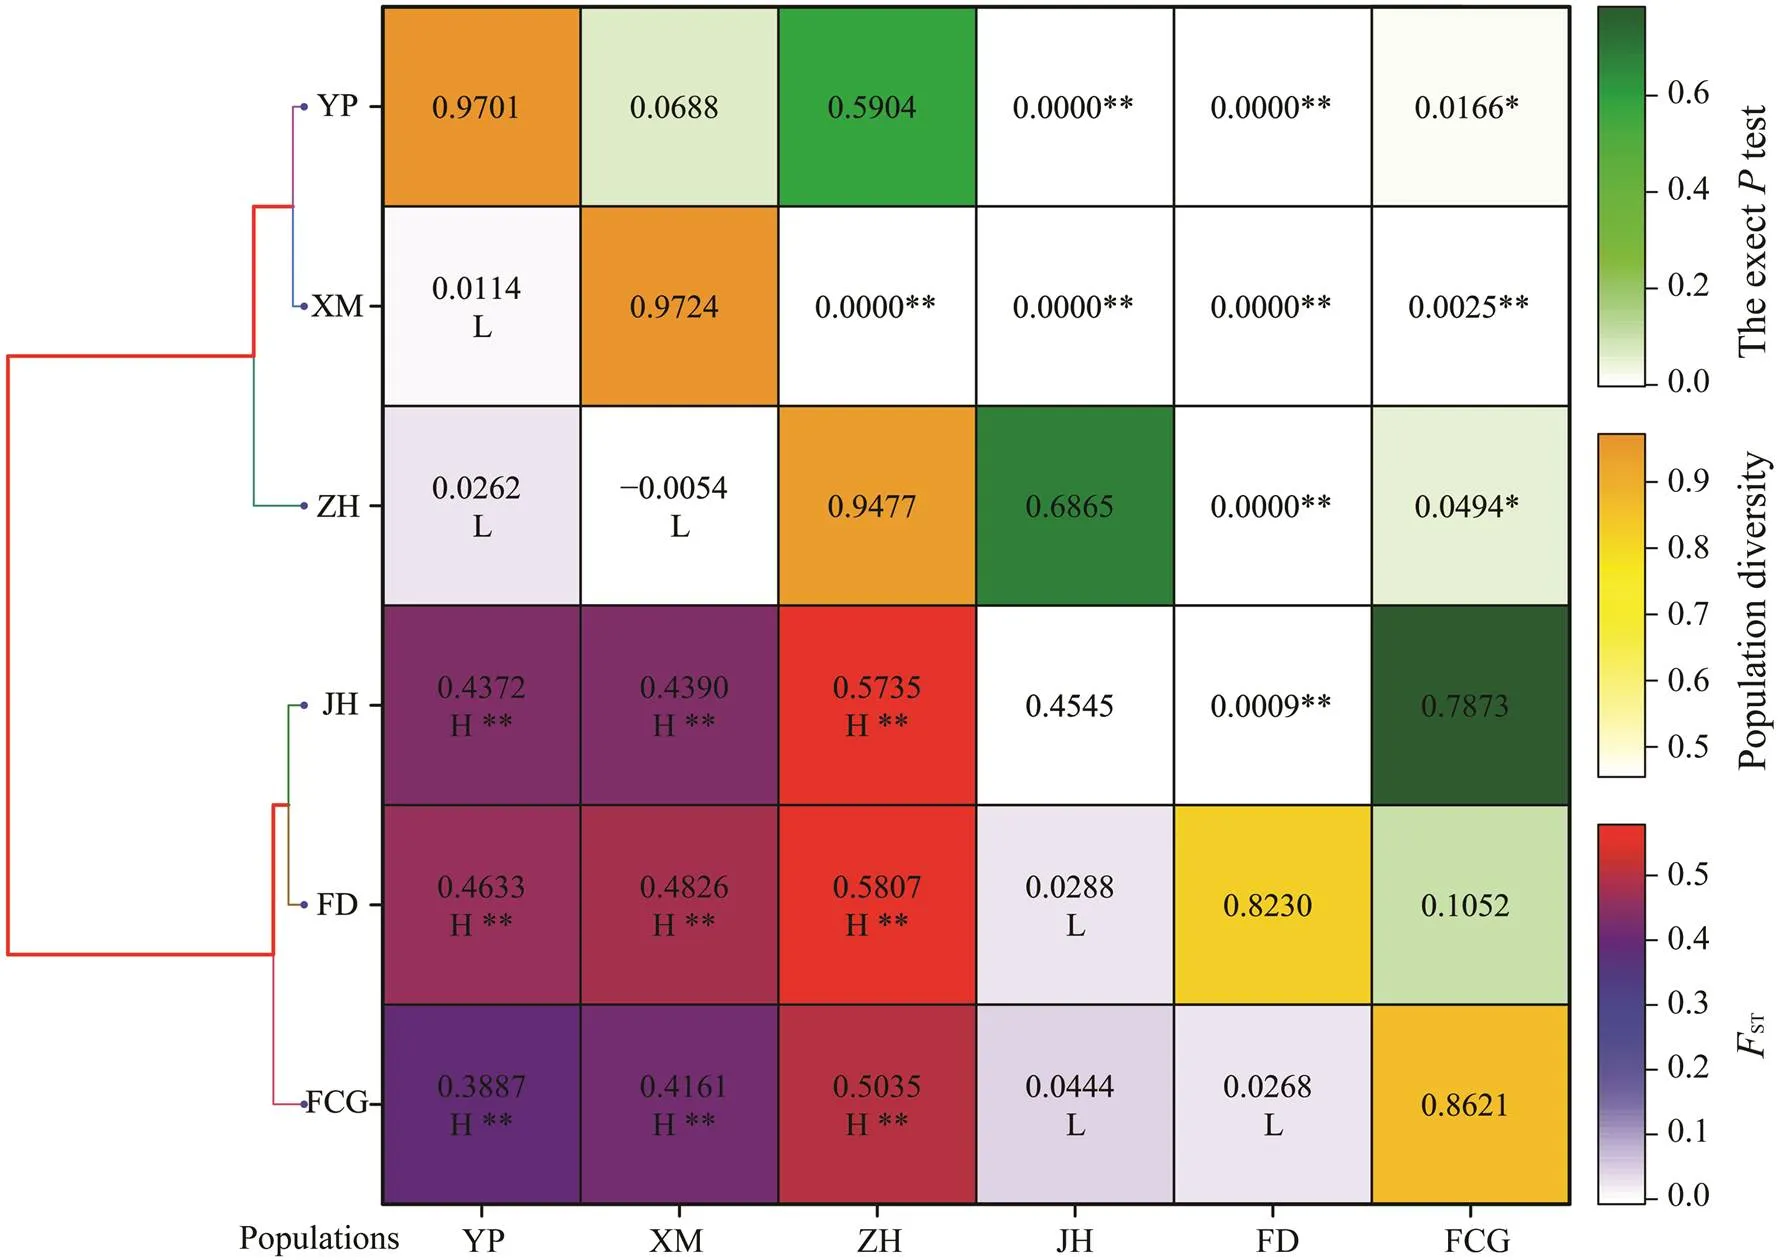
Fig.4 UPGMA tree, FST (below diagonal), exact P test (above diagonal) and sub-population diversity (on diagonal). The asterisk superscript shows significance (*P<0.05, **P<0.01). The level of FST is noted by L (low, −1.00–0.15), M (medium, 0.15–0.25) and H (high, 0.25–1.00).

Table 3 AMOVA of hypothetical subdivision groups
Notes: The number in brackets represent the 4 grouping methods. Brackets with sub-populations of a grouping method represent hypothetical subdivision groups. Slashes of a grouping method distinguish different groups. The asterisk superscript shows significance (*<0.05, **<0.01).

Table 4 Results of neutral test
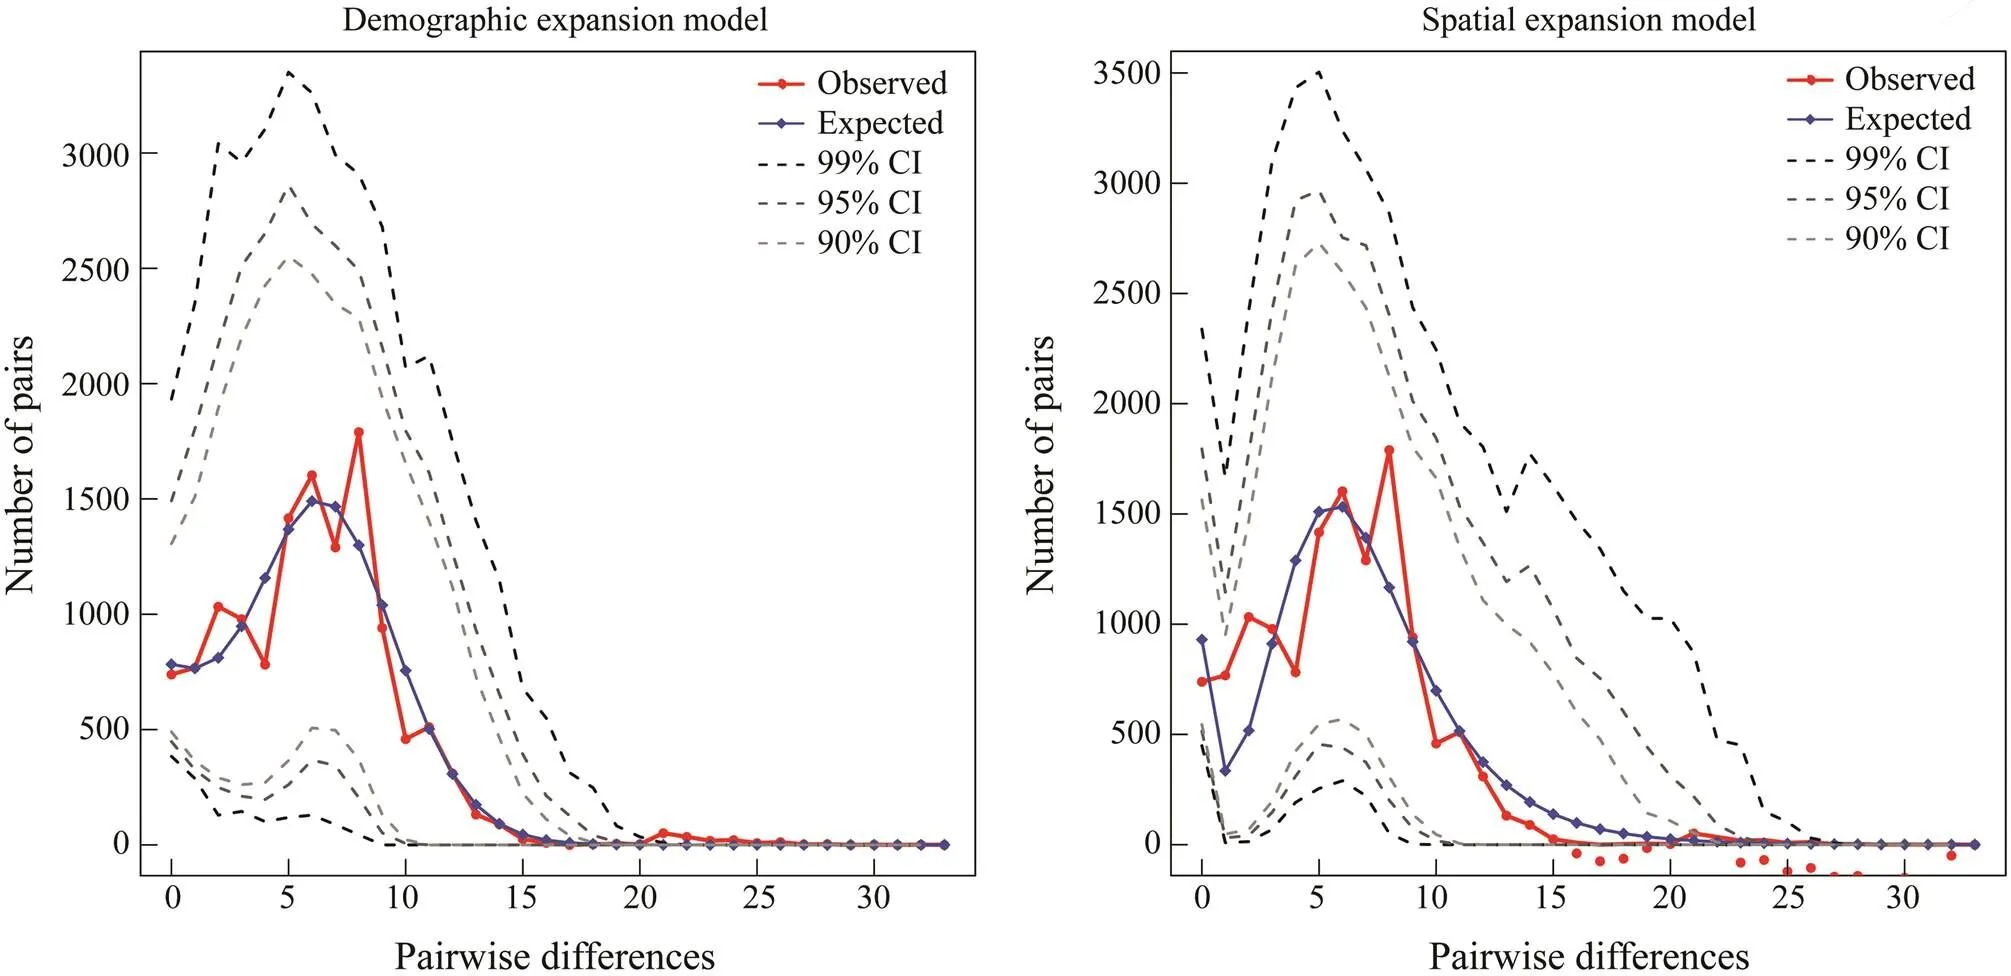
Fig.5 Mismatch distribution of mitochondrial DNA control region of S. nigrofasciata.
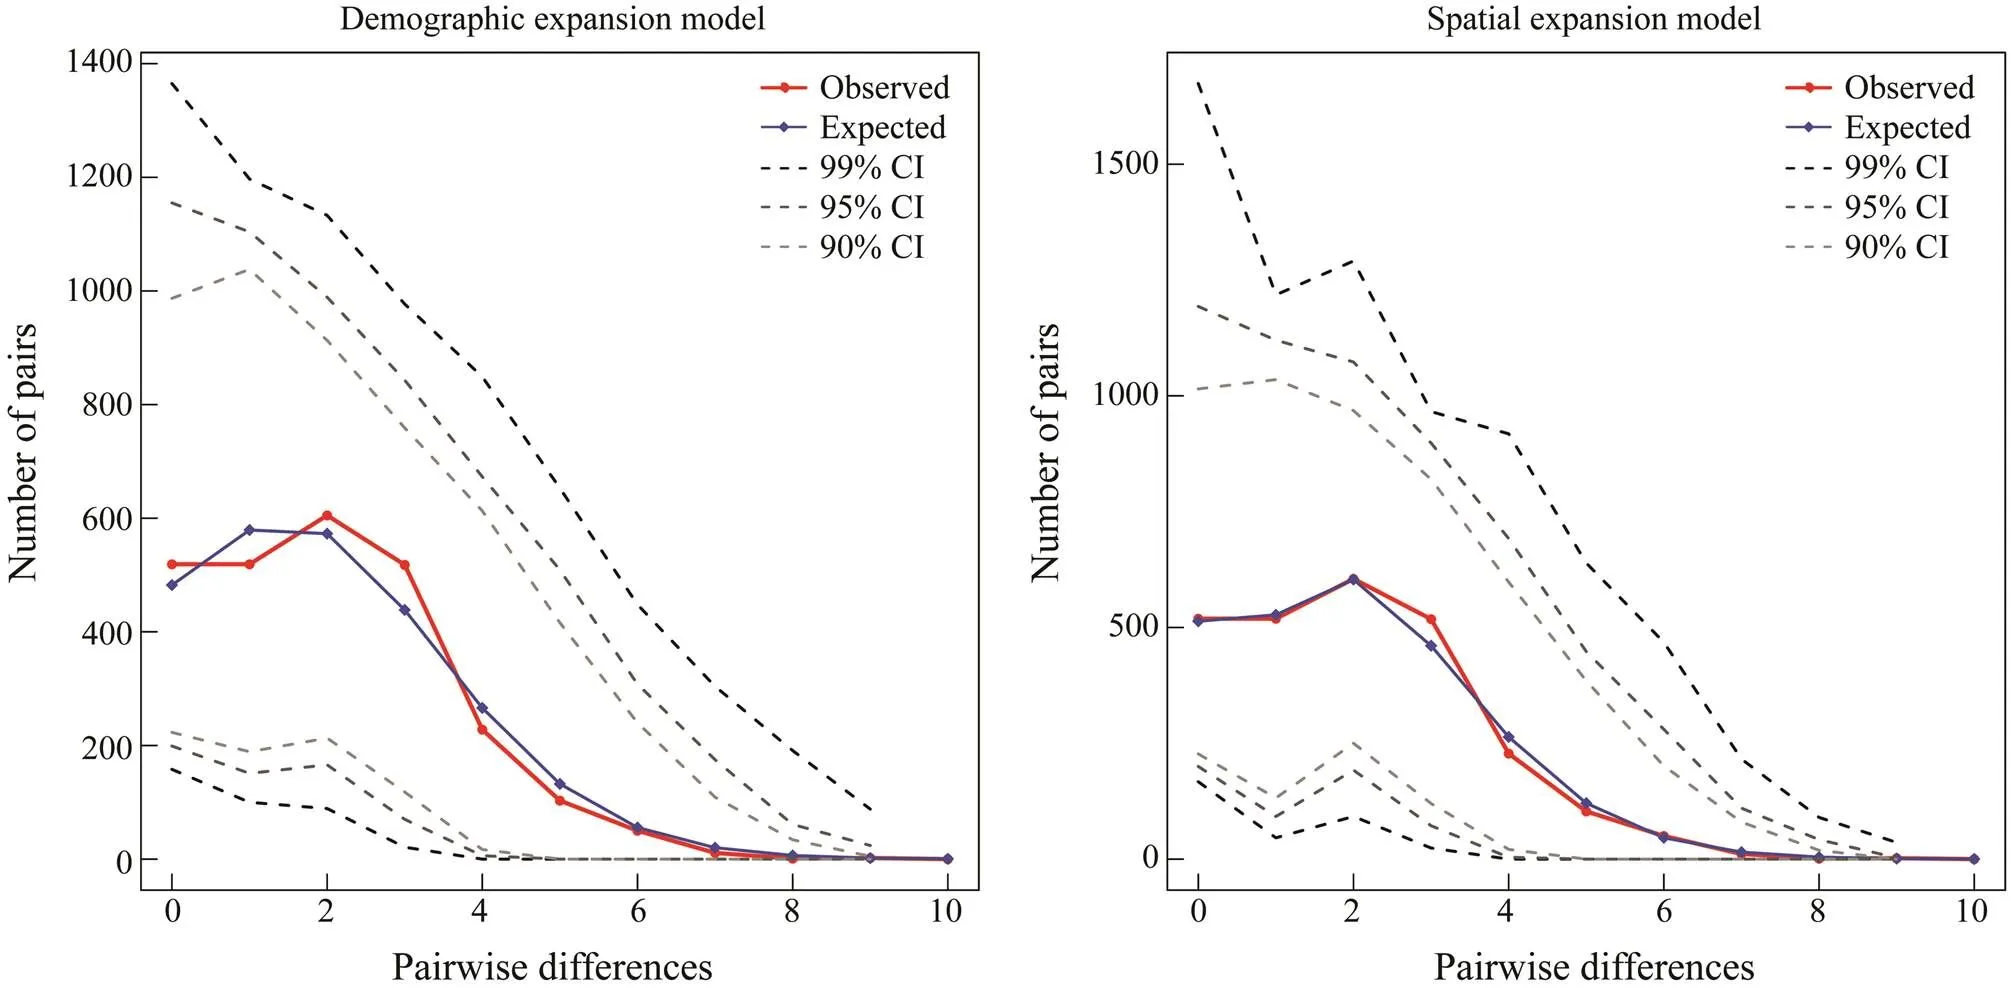
Fig.6 Mismatch distribution of mitochondrial DNA control region of group 1 (FCG, FD and JH).
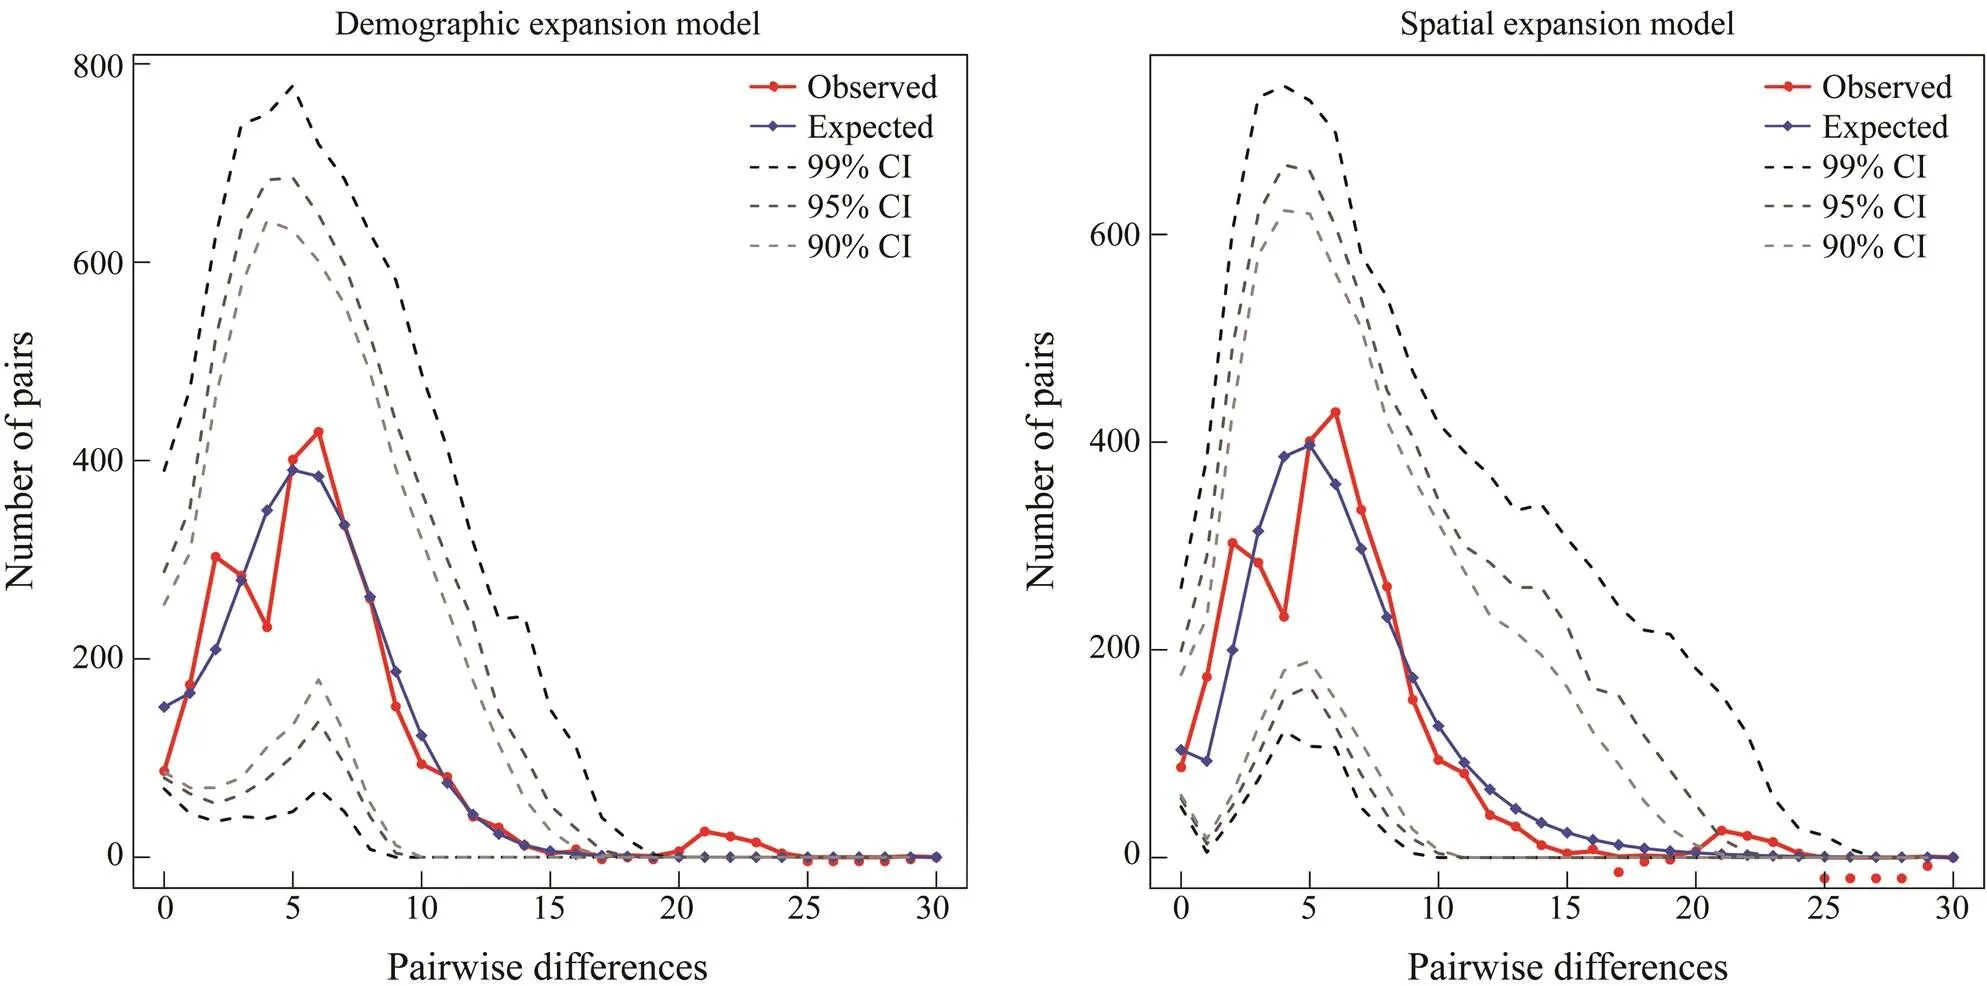
Fig.7 Mismatch distribution of mitochondrial DNA control region of group 2 (XM, YP and ZH).
Genetic diversity is essential to their survival and evolution. A high genetic diversity is also beneficial to the de- velopment of fishery resources (Solbrig, 1991; Zhang.,2002; Last., 2010; Li, 2014). Assessment of the ge- netic diversity of a species can reveal its adaptabilityto environmental change, which is important for preventing resource decline (Schmitt and Hewitt, 2004; Beheregaray, 2008; Li, 2014).population along the coast of China is characterized by a lower nucleotide diversity than that of other marine fish species (Kwan., 2012; Song., 2014; Da Silva., 2015; Zhang.,2019). Moreover, all sub-populations showed low nucleotide diversities. Human fishing activity should lead to a further reduction in the genetic diversity of. The ability ofto adapt to environmental change is very poor, and protective measures arene- cessary to prevent the resource depletion of this species.
4.2 Genetic Structure and Formation
Mitochondrial DNA sequences are one of the best tools to reveal the genetic structure of marine fish species po- pulations (Buonnacorsi., 2001; He., 2014; Song., 2014; Qiu., 2015).STvalues and AMOVA were consistent as was indicated by the genetic differentiation between group 1 (FCG, FD and JH) and group 2 (XM, YP and ZH). Moreover, mismatch distribution ofwhole population was bimodal, reflecting no demographic equilibrium existed within all sub-popula- tions (Rogers and Harpending, 1992; Rogers, 1995; Ray., 2003). The division of groups 1 and 2 was the genetic structure pattern withinpopulation in the eastern and southern coasts of China. There is a large genetic differentiation between two groups and a small genetic differentiation within groups. Information of genetic structure patterns can provide important guidance for the regional protection and management of species (Kronholm., 2010). Thus different managements are necessary for different sub-populations ofalong the coast of China.
Usually the negative effect on the gene exchange from the long geographical distance causes differentgenetic structures within populations (Taguchi., 2015; Zhang., 2019). However, in the present study, there is a short geographic distance between FCG and YP sub-po- pulations. JH sub-population was in the middle of YP and ZH. The historical geographic event factor should con- tribute more to the genetic structure withinsub-population than recent gene exchange factor does (Yan., 2015). Sub-populations in group 1 showed less genetic differences, but they had less gene exchanges. More genetic differences were detected between two groups, and more individuals migrated into group 2 from group 1. Gene flow analysis also suggested that a recent gene exchange is not the major factor in forming the genetic struc- ture of.Historical geographic events may play a more important role than the recent gene exchange factor (Bernardi, 2000; Dawson., 2002; Bernardi, 2005). A large genetic differentiation over a short geographical distance and a small genetic differentiation over a long geographical distances can also be found in other marine organisms, which may be caused by historical geo- graphic events (Ekman, 1953; Lindberg, 1991; Quinterio.,2000; Fauvelot., 2003). After ice age, habitat expansion is an important factor in forming the geographical distributionpattern of populations and genetic structures within populations. The genetic differentiation between two groups may be caused by different ancestors in ice age (Hewitt, 2000). No strong genetic structure was detected in both haplotype network diagram and NJ tree. This may be explained by a long period of gene exchange and fusion after ice age. The less genetic differentiation be- tween ancestors in ice age was also possible, but the evidence not enough.
4.3 Demographic History and Population Dynamic
The historical geographic events associated with ice age had affected the biomass and geographical distributionpatterns of many marinespecies. The relevant molecular signals can be found in the genetic information re- vealed by mismatch distribution and neutral test. These analyses suggested that population expansion events ofexisted (He., 2014; Qiu., 2015; Yan., 2015).
Population expansions and habitat expansions may have both influenced the molecular systematic geographical pat- tern ofaccording to the analyses of mismatch distribution based on two models relating through gene flow (Rogers, 1995; Ray., 2003; Excoffier, 2004). Sea level changed dramatically during ice age. The lowest sea level was 140m, lower than the present. At that time, a large part of continental shelf became land, only leaving somemarine fishes survived in shelters (Dynesius and Jans- son,2000; Voris, 2000; Lambeck., 2002). Thetwo po- pulations ofsurvived during ice agein two shelters, most likelyEast China Seaand South China Sea.After ice age, the sea level rose andthe living conditions improved. The two populations experienced population expansion events along the coast of China. The small genetic differentiation within each groups could be due to the same ancestor as well as the limited time for genetic variation while the large genetic differentiation between two groups may be due to different ancestors and short time for gene exchanges and fusion (Slatkin, 1993). It is well known thatmany marine species have genetic differentiation within populations due to different shelters during ice age (Xu and Chu, 2012; He., 2014; Qiu., 2015; Yan., 2015). Thus the point of the present study can be supported.
Another possible population history is the existence of oneduring ice age, which may be the common ancestor of two groups. Theancient population had experienced a population expansion event before it was divided into two for survival resources after ice age. Then the two populations made a certain amount of genetic differentiation under certain natural conditions, ma- king the second generation of ancestors of two groups, respectively. Then the two second generation of ancestors made the genetic structure withinpopula- tion.
The first possibility is much more reliable based on the mismatch analysis in the present study because the mismatch analysis for the wholepopulation was bimodal. This analysis indicated two molecular signals from two groups rather than one molecular signal from wholepo- pulation. Furthermore, the first possibility is more reasonable in respect of the population expansion time estimates based on relevant studies (Dynesius and Jansson, 2000; Song., 2014;Zhang., 2019). The estimations were both during the period of late Pleistocene (Im- brie.,1992). But the population expansion time for the wholepopulation could be the late Pliocene, a much more distant time (Muss., 2001). Over the past million years, the global climate had gone through a series of glacial-interglacial changes with fluctuations, occurring about every one hundred thousand years, leading to dra- matic changes in sea levels (Imbrie., 1992; Lambeck., 2002). Organism populations may have experienced multiple expansion events, and molecular signals of expansion events were hard to retain except for the one last time. This makes the first possibility much more reliable.Thepopulation along the coast of China could have two shelters in ice age, and its demographichistory and population dynamic could have been influenced by the historical geographic events associated with ice age.
Historical geographic events associated with ice age alsoinfluenced other marine species in terms of demographic history and population dynamic (Grant., 2012; Qiu., 2015; Yan., 2015). The findings of the present study can be a reference for related studies in other marine species.
5 Conclusions
This study investigated the population genetics ofpopulationalong the coast of China by sequencing mitochondrial DNA control region, which is an important guidance for the species management and a re- ference for related studies. The conclusions are as follows:
1) In terms of genetic diversity, analyses showed that the potential ofpopulation along the coastof China to adapt to the changes of living conditions is very poor. Thus the protective measures of fishery ad- ministration arenecessary.
2) In terms of genetic structure, a genetic structure pa- ttern withinpopulation was detected, su- ggesting that different protection schemes of fishery ad- ministration should be developed and supplemented for dif- ferent populations.
3) In terms of population history, this study indicated thatpopulation along the coast of China may have two shelters in ice age. Itssystematic geogra- phical pattern may be related to the historical geogra- phic events associated with ice age rather than the recent gene exchange factor.
Acknowledgements
Many thanks to Drs. Jiaguang Xiao and Shengyong Xu and Mr. Wei Zhou for their helps in experiments. Many thanks to Mr. Guang Shi for the help in English editing. This work was supported by the National Natural Science Foundation of China (Nos. 41976083 and 41776171).
Avise, J. C., Arnold, J., Ball, R. M., Bermingham, E., Lamb, T., Neigel, J. E., Reeb, C. A., and Saunders, N. C., 1987. Intraspecific phylogeography: The mitochondrial DNA bridge between population genetics and systematics., 18: 489-522.
Avise, J. C., Neigel, J. E., and Arnold, J., 1984. Demographic in- fluences on mitochondrial DNA lineage survivorship in animal populations., 20: 99-105.
Baisvar, V. S., Singh, M., and Kumar, R., 2019. Population stru- cturing offrom Indian waters using control region of mtDNA., 30 (3): 414-423.
Beheregaray, L. B., 2008. Twenty years of phylogeography: The state of the field and the challenges for the Southern Hemisphere., 17: 3754-3774.
Bernardi, G., 2000. Barriers to gene flow in, a marine fish lacking a pelagic larval stage., 54: 226- 237.
Bernardi, G., 2005. Phylogeography and demography of sympa- tric sister surfperch species,andalong the California coast: Historical versus ecological factors., 59: 386-394.
Buonnacorsi, V. P., McDowell, J. R., and Graves, J. E., 2001. Reconciling patterns of inter-ocean molecular variance from four classes of molecular markers in blue marlin ()., 10: 1179-1196.
Camargo, S. M., Coelho, R., Chapman, D., Howey-Jordan, L., Brooks, E. J., Femando, D., Mendes, N. J., Hazin, F. H. V., Oliveira, C., Santos, M. N., Foresti, F., and Mendonca, F. F., 2016. Structure and genetic variability of the oceanic White- tip shark,, determined using mitochondrial DNA., 11: e0155623.
Da Silva, R., Veneza, I., Sampaio, I., Araripe, J., Schneider, H., and Gomes, G., 2015. High levels of genetic connectivity among populations of yellowtail snapper,(Lutjanidae-Perciformes), in the western South Atlantic revealed through multilocus analysis., 10 (3): e0122173.
Dawson, M., Louie, K. D., Barlow, M., Jacobs, D. K., and Swift, C. C., 2002. Comparative phylogeography of sympatric sister species,and(Teleo- stei, Gobiidae), across the California Transition Zone., 11: 1065-1075.
Donaldson, K. A., and Wilson, R. R., 1999. Amphi-Panamic ge- minates of snook (Percoidei: Centropomidae) provide a calibration of the divergence rate in the mitochondrial DNA control region of fishes., 13: 208-213.
Dynesius, M., and Jansson, R., 2000. Evolutionary consequences of changes in species’ geographical distributions driven by Mi- lankovitch climate oscillations., 97: 9115- 9120.
Ekman, S., 1953.. Sidgwick and Jackson Press, London, 417pp.
Excoffier, L., 2004. Patterns of DNA sequence diversity and ge- netic structure after a range expansion: Lessons from the infinite-island model., 13: 853-864.
Excoffier, L., and Lischer, H. E. L., 2010. Arlequin suite ver 3.5: A new series of programs to perform population genetics ana- lyses under Linux and Windows.,10: 564-567.
Excoffier, L., Smouse, P. E., and Quattro, J. M., 1992. Analysis of molecular variance inferred from metric distances among DNA haplotypes: Application to human mitochondrial DNA restriction data., 131: 479-491.
Fauvelot, C., Bernardi, G., and Planes, S., 2003. Reductions in the mitochondrial DNA diversity of coral reef fish provide evidence of population bottlenecks resulting from Holocene sea-level change., 57 (7): 1571-1583.
Fu, Y. X., 1997. Statistical tests of neutrality of mutations against population growth, hitchhiking and background selection., 147: 915-925.
Gao, T. X., Yang, T. Y., Yanagimoto, T., and Xiao, Y. S., 2019. Levels and patterns of genetic variation in Japanese whiting () based on mitochondrial DNA control region., 30 (1): 172-183.
Grant, E. H. C., Lynch, H. J., Muneepeerakul, R., Arunachalam, M., and Rodríguez-Iturbe, I., 2012. Interbasin water transfer, riverine connectivity, and spatial controls on fish biodiversity., 7: 134-170.
Grant, W. S., and Bowen, B. W., 1998. Shallow population histories in deep evolutionary linages of marine fishes: Insights from sardines and anchovies and lessons for conservation., 5: 415-426.
Grant, W. S., Liu, M., Gao, T. X., and Yanagimoto, T., 2012. Li- mits of Bayesian skyline plot analysis of mtDNA sequences to infer historical demographics in Pacific herring (and other species)., 65 (1): 203-212.
Hamilton, H., Saarman, N., Short, G., Sellas, A. B., Moore, B., Hoang, T., Grace, C. L., Gomon, M., Crow, K., and Simison, W. B., 2017. Molecular phylogeny and patterns of diversification in Syngnathid fishes., 107: 388-403.
Harpending, H. C., 1994. Signature of ancient population growth in a low-resolution mitochondrial DNA mismatch distribution., 66: 591-600.
He, L. J., Zhang, A. B., Weese, D., Li, S. F., Li, J. S., and Zhang, J., 2014. Demographic response of cutlassfish (and) to fluctuating palaeo-climate and regional oceanographic conditions in the China seas., 4: 6380.
Hewitt, G. M., 2000. The genetic legacy of the Quaternary ice ages., 405: 907-913.
Imbrie, J., Boyle, E. A., Clemens, S. C., Duffy, A., Howard, W. R., Kukla, G., Kutzbach, J., Martinson, D. G., McIntyre, A., Mix, A. C., Molfino, B., Morley, J. J., Peterson, L. C., Pisias, N. G., Prell, W. L., Raymo, M. E., Shackleton, N. J., and Toggweiler, J. R., 1992. On the structure and origin of major glaciation cy- cles, 1. Linear responses to Milankovitch forcing., 7: 701-738.
Iwamoto, K., Chang, C. W., Takemura, A., and Imai, H., 2012. Genetically structured population and demographic history of the goldlined spinefootin the northwestern Pacific., 78: 249-257.
Kuhner, M. K., 2006. LAMARC 2.00: Maximum likelihood and Bayesian estimation of population parameters., 22 (6): 6768-6770.
Kronholm, I., Loudet, O., and Meaux, J., 2010. Influence of mu- tation rate on estimators of genetic differentiation-lessons from., 11 (1): 33.
Kumar, S., Stecher, G., and Tamura, K., 2016. MEGA7: Mole- cular evolutionary genetics analysis version 7.0 for bigger datasets., 33 (7): 1870.
Kwan, Y. S., Song, H. K., Lee, H. J., Lee, W. O., and Won, Y. J., 2012. Population genetic structure and evidence of demogra- phic expansion of the ayu () in East Asia., 28 (4): 279-290.
Lambeck, K., Esat, T. M., and Potter, E. K., 2002. Links between climate and sea levels for the past three million years., 419: 199-206.
Last, P. R., White, W. T., Caira, J. N., Dharmadi, F., Jensen, K., Lim, A. P. K., Manjaji-Matsumoto, M. B., Naylor, G. J. P., Pogono- ski, J. J., Stevens, J. D., and Yearsley, G. K., 2010.CSIRO Publishing, Collingwood, 298pp.
Li, N., 2014. Molecular phylogeography of sand lance and the red stingray in the Northwestern Pacific. PhD thesis. Ocean University of China (in Chinese with English abstract).
Li, N., Chen, X., Sun, D., Song, N., Lin, Q., and Gao, T.,2015. Phylogeography and population structure of the red stingray,inferred by mitochondrial control region., 26 (4): 505-513.
Librado, P., and Rozas, J., 2009. DnaSP v5: A software for com- prehensive analysis of DNA polymorphism data., 25 (11): 1451-1452.
Lindberg, D. R., 1991. Marine biotic interchange between the Nor- thern and Southern Hemispheres., 17: 308-324.
Liu, L., 2017. Studies on molecular phylogeography ofand. PhD thesis. Ocean Uni- versity of China (in Chinese with English abstract).
Liu, J. X., Gao, T. X., Zhuang, Z. M., Jin, X. S., Yokogawa, K., and Zhang, Y. P., 2006. Late Pleistocene divergence and subsequent population expansion of two closely related fish species, Japanese anchovy () and Australian anchovy ()., 40: 712-723.
Maniatis, T., Fritsch, E. F., and Sambrook, J., 1982.. Cold Spring Harbor Laboratory Press, New York, 545pp.
Marques, A. C. P. B., Franco, A. C. S., Salgueiro, F., García- Berthou, E., and Santos, L. N., 2016. Genetic divergence among invasive and native populations of the yellow peacock cichlid., 89: 2595-2606.
McKay, R. J., 1992. FAO species catalogueIn:. FAO Press, Rome, 87pp.
Moreira, C., Correia, A. T., Vaz-Pires, P., and Froufe, E., 2019. Genetic diversity and population structure of the blue jack mackerelacross its western distribution., 94 (5): 725-731.
Muss, A., Robertson, D. R., Stepien, C. A., Wirtz, P., and Bowen, B. W., 2001. Phylogeography of Ophioblennius: The role of ocean currents and geography in reef fish evolution., 55 (3): 561-572.
Posada, D., and Crandall, K. A., 1998. Modeltest: Testing the model of DNA substitution., 14: 817-818.
Qiu, F., Li, H., Lin, H., Ding, S. X., and Miyamoto, M. M., 2015. Phylogeography of the inshore fish,, along the Pacific coastline of China., 96: 112-117.
Quinterio, J., Vidal, V., and Rey-Méndez, M., 2000. Phylogeny and biogeographic history of hake (genus), inferred from mitochondrial DNA control region sequences., 136: 163-174.
Ray, N., Currat, M., and Excoffier, L., 2003. Intra-deme mole- cular diversity in spatially expanding populations., 20: 76-86.
Rogers, A. R., 1995. Genetic evidence for a Pleistocene population expansion., 49: 608-615.
Rogers, A. R., and Harpending, H., 1992. Population growth makes waves in the distribution of pairwise genetic differences., 9: 552-569.
Schmitt, T., and Hewitt, G. M., 2004. The genetic pattern of po- pulation threat and loss: A case study of butterflies., 13: 21-31.
Slatkin, M., 1993. Isolation by distance in equilibrium and non- equilibrium populations., 47: 264-279.
Slatkin, M., and Hudson, R. H., 1991. Pairwise comparisons of mitochondrial DNA sequences in stable and exponentially grow- ing populations., 129: 555-562.
Solbrig, O. T., 1991.. IUBS Press, Cambridge, 123pp.
Song, N., Ma, G. Q., Zhang, X. M., Gao, T. X., and Sun, D. R., 2014. Genetic structure and historical demography ofinferred from mtDNA sequence analysis., 97: 69-77.
Taguchi, M., King, J. R., Wetklo, M., Withler, R. E., and Yoka- wa, K., 2015. Population genetic structure and demographic history of Pacific blue sharks () inferred from mitochondrial DNA analysis., 66: 267-275.
Tajima, F., 1989. Statistical method for testing the neutral mutation hypothesis by DNA polymorphism., 123: 585-595.
Tian, C., Li, Z., Dong, Z., Huang, Y., Du, T., Chen, H., Jiang, D., Deng, S., Zhang, Y., Wanida, S., Shi, H., Wu, T., Zhu, C., and Li, G., 2019. Transcriptome analysis of male and female ma-ture gonads of silver sillago ()., 10 (2): E129.
Valenzuela-Quiñonez, F., De-Anda-Montañez, J. A., Gilbert-Hor- vath, E., Garza, J. C., and García-De León, F. J.,2016. Panmi- xia in a critically endangered fish: The totoaba () in the Gulf of California., 107 (6): 496-503.
Vella, N., and Vella, A., 2017. Population genetics of the deep- sea bluntnose sixgill shark,, revealing spatial genetic heterogeneity., 36: 25-32.
Voris, H. K., 2000. Maps of Pleistocene sea levels in Southeast Asia: Shorelines, river systems and time durations., 27: 1153-1167.
Wang, L. Y., 2014. Population genetics for Chinese sillago () and Japanese sillago () based on microsatellite markers. Master thesis. Ocean University of Chi- na (in Chinese with English abstract).
Wang, Z. Y., 2017. Mitogenomic characterization and mitochon- drial phylogeographical analysis ofandin China seas. PhD thesis. Ocean University of Chi- na (in Chinese with English abstract).
Ward, R. D., and Grewe, P. M., 1994. Appraisal of molecular genetic techniques in fisheries., 4: 300-325.
Weir, B. S., and Cockerham, C. C., 1984. Estimating-statistics for the analysis of population structure., 38: 1358-1370.
Winkelmann, I., Campos, P. F., Strugnell, J., Cherel, Y., Smith, P. J., Kubodera, T., Allcock, L., Kampmann, M. L., Schroeder, H., Guerra, A., Norman, M., Finn, J., Ingrao, D., Clarke, M., and Gilbert, M. T. P., 2013. Mitochondrial genome diversity and population structure of the giantsquid: Genetics sheds new light on one of the most enigmatic marine species.–, 280: 20130273.
Wu, R. X., Zhang, H. R., Niu, S. F., Zhai, Y., and Liu, X. F., 2016. Development of polymorphic microsatellites forbased on next-generation sequencing and transfer- ability to., 15 (4): gmr15049046.
Xiao, J. G., 2015. The complete mitochondrial genomes and phy-logenetic analysis ofspecies. Master thesis. Ocean Uni- versity of China (in Chinese with English abstract).
Xiao, J. G., 2018. The taxonomy, phylogeny and biogeography of Sillaginidae species in China. PhD thesis. Ocean University of China (in Chinese with English abstract).
Xu, J., and Chu, K. H., 2012. Genome scan of the mitten crabin East Asia: Population differentiation, hybridization and adaptive speciation., 64: 118-129.
Xu, S., Xiao, S., Zhu, S., Zeng, X., Luo, J., Liu, J., Gao, T., and Chen, N., 2018. A draft genome assembly of the Chinese sillago (), the first reference genome for Sillaginidae fishes., 7 (9): giy108.
Yan, S., Catanese, G., Brown, C. L., Wang, M., Yang, C., and Yang, T. B., 2015. Study on the chub mackerel () in the northwestern Pacific indicates the late Pleistocene po- pulation isolation.–, 36 (3): 753-765.
Zhang, H. Y., 2013. Study on morphology and genetics of. Master thesis. Shanghai Ocean University (in Chi- nese with English abstract).
Zhang, X. M., Zhang, X. M., Song, N., Gao, T. X., and Zhao, L. L., 2019. Study on population genetics of(Per- ciformes: Sillaginidae) in the coast of China., 30 (8): 825-834.
Zhang, Y. P., Wang, X. X., Ryder, O. A., Li, H. P., Zhang, H. M., Yong, Y. G., and Wang, Y. P., 2002. Genetic diversity and con- servation of endangered animal species., 74: 575-584.
Zhong, J., Yi, S., Ma, L., and Wang, W., 2019. Evolution and phy- logeography analysis of diploid and polyploidpopulations across China., 286 (1901): 20190076.
. Tel: 0086-21-65803266
E-mail: annidy@163.com
August 12, 2019;
September 23, 2019;
March 4, 2020
(Edited by Qiu Yantao)
 Journal of Ocean University of China2020年3期
- Journal of Ocean University of China的其它文章
- Diffusion Characteristics of Swells in the North Indian Ocean
- Analysis of the Dynamic System of Wave Glider with a Towed Body
- Provenance and Tectonic Implications of Paleozoic Strata in the South Yellow Sea Basin, China–Revealed from the Borehole CSDP-2
- Ecological Risk of Heavy Metals in Sediment Around Techeng Island Special Marine Reserves in Zhanjiang Bay
- Geochemical and Grain-Sized Implications for Provenance Variations of the Central Yellow Sea Muddy Area Since the Middle Holocene
- Grain-Size Distribution of Surface Sediments in the Bohai Sea and the Northern Yellow Sea: Sediment Supply and Hydrodynamics
