Fraud Identification of Chinese Listed Companies—an Improvement Based on M-Score
LU Wanting(陆晚亭), ZHAO Xiaokang(赵晓康)
Glorious Sun School of Business and Management,Donghua University,Shanghai 200051,China
Abstract: To evaluate the applicability of the M-score model in the Chinese capital market,this research observed 190 financial fraud samples punished by the China Securities Regulatory Commission (CSRC) in the years from 2014 to 2018. The test results indicate that two types of errors are high,which means that the applicability of the M-score is unacceptable. Therefore,in this paper,a 9-index model is constructed by Wald’s backward stepwise regression method,and the optimal threshold is set by the Beneish expected cost method (ECM). The accuracy of the modified M-score is significantly improved,especially the Type I error rate of is reduced from 70.37% to 19.75%. The receiver operating characteristic (ROC) curve test also proves the superior identification effect of the modified M-score applied in the Chinese market. Finally,variables such as current ratio,fixed asset index,and equity concentration in the modified model could represent the fraud characteristics of Chinese listed companies.
Key words: financial fraud; M-score model; threshold setting; receiver operating characteristic (ROC)curve
Introduction
The recent scandal of Kangmei (stock code: 600518) falsely increasing profits has brought the issue of financial fraud of listed companies to the forefront once again. The frequent occurrence of financial frauds is not only due to the profit-seeking nature of the capital market itself,but also due to the lack of effective and reliable detection tools,which helps investors avoid risks and plays a warning role in the fraud.
The financial fraud identification system has experienced the evolution process from a single variable to multivariable,from static to dynamic. In 1932,Fitzpatrick first used the single variable analysis method to study the companies under financial pressure,which pioneered the theory of financial warning[1]. Most of the subsequent financial fraud identification studies used multivariate analysis in Refs.[2-4]. Their research proved the identification function of the company’s overall financial situation. After that,Beneish[5]proposed the idea of using financial statement data to identify fraud through a dynamic index analysis method,which has been widely used in subsequent research[6-8]. On this basis,Chinese scholars took listed companies punished by China Securities Regulatory Commission (CSRC) for financial fraud as samples to test the impact of various characteristic factors on financial fraud,such as Song and Tan[9],Kong[10],Qian and Luo[11]. However,the characteristic variables used in the existing financial fraud identification research are different. The tested samples occur in different periods of time. The methods to evaluate the accuracy of the model are not detailed enough. Moreover,few studies discuss how to set the threshold of fraud identification. Investors lack a simple and practical fraud identification model.
The M-score model developed by Beneish[12]in 1999 is widely used in the western market and has gained a reputation for successfully predictingthe Enron case. The model calculates the M-value by extracting the financial variables of the company,thereby scoring the company’s financial rationality,and then judging the possibility of the company’s manipulation of profits. The variables of M-score are selected according to the characteristics of financial fraud in American listed companies. However,China and the United States are quite different in terms of market environment and accounting system.
This papers elects the M-score for research and modify the model based on the data of Chinese A-share listed companies to establish a financial fraud identification model that is more suitable for the Chinese market. The modified model can effectively help investors identify fraudulent companies and avoid financial risks. At the same time,this study also theoretically complements the parts of threshold setting and model evaluation that have been lacking in previous related studies.
1 M-Score Model
M-score can identify financial fraud through thresholds. Beneish took the fraudulent companies announced by the U.S. Securities and Exchange Commission (SEC) between 1982 and 1992 as observation samples and estimated an 8-index model based on the financial statement data:
M=-4.840+0.920R1+0.528R2+0.404R3+0.892R4+
0.115R5-0.172R6-0.327R7+4.697R8,
(1)
whereMis the M-value calculated by Eq. (1). The definition and description of the variables are as follows.
R1: days’ sales in receivables index (DSRI). DSRI measures whether there is any abnormal change in receivables and operating revenue in two consecutive years. The higher the DSRI is,the more likely financial fraud is.
R2: gross margin index (GMI). The higher the GMI is,the worse the profitability is and the higher the possibility of financial fraud is.
R3: asset quality index (AQI). The higher the AQI is,the lower the asset quality,the higher the risk of asset realization and the higher the possibility of fraud.
R4: sales growth index (SGI). Companies with high growth will have higher capital requirements and therefore have greater incentives for financial fraud.
R5: depreciation index (DEPI). The higher the DEPI is,the lower the depreciation rate is and the more likely the company is to manipulate the profit by prolonging the service life of the assets.
R6: sales,general,and administrative expenses index (SGAI). High SGAI indicates an unreasonable increase in sales,general,and administrative expenses. In order to reverse this negative signal,companies are more likely to commit fraud.
R7: leverage index (LVGI). High LVGI represents a high financial risk. The higher the risk of financial fraud is,the higher the probability of financial fraud is.
R8: total accruals to total assets (TATA). TATA is used to evaluate the degree of management earnings. Generally speaking,high TATA indicates a high probability of profit manipulation.
The formulas used to calculate the M-score’s variables are as follows:
wheretrefers to the year of fraud;Rrefers to receivables;Srefers sales;Grefers to gross profit margin;Carefers to current assets;Trefers to total assets;Drefers to depreciation;Prefers to property,plant,and equipment;Serefers to sales,general and administrative expense;Tlrefers to total long term debt;Clrefers to current liabilities;Irefers to income before extraordinary item;Orefers to operating cash flow. IfM>-1.78,it means that the possibility of financial fraud is high.
The variables selected by M-score are all in the form of a ratio,which takes account of the articulation between accounting elements,and prevents companies from “cooking books” against a single indicator[13]. According to Beneish’s test,M-score’s accuracy in identifying financial fraud is 76%.
2 Model Testing and Selection of New Variables
2.1 Sample test of Chinese listed companies
In this paper,financial fraud companies announced by the CSRC during the years from 2014 to 2018 are taken as fraud samples,and the non-event years of all companies are taken as non-fraud samples. The sample information comes from the “penalties for major violations” section in the RESSET database. A total of 190 fraud samples and 9 693 non-fraud samples were obtained. This paper randomly select 40% of the total samples as the testing samples for M-score accuracy test. The results are shown in Table 1.

Table 1 Test results of M-score
An effective fraud identification model should minimize two kinds of error rates at the same time. Among them,Type I error refers to misjudgment of fraud samples as non-fraud samples,and Type II error refers to misjudgment of non-fraud samples as fraud samples. Although M-score has a high recognition accuracy for normal samples (84.84%),it has a poor recognition effect for fraud samples (29.63%),with Type I error rate as high as 70.37%,which represents irreparable investment losses[14].
For the fraud samples failed in the M-score test,the fraud methods are summarized in Table 2. In addition to characterizing the fraud characteristics of Chinese listed companies,the fraud means summarized below also point out the blanks that the M-score model cannot capture,which can be used as the basis for index addition.
2.2 Selection of new variables
According to the construction form of the M-score model and the fraud methods summarized above,the ratio formal variables are selected as follows.
2.2.1Financialvariables
R9: current asset turnover (CAT) is the ratio of main business income to average current assets. CAT is used to evaluate the efficiency of assets utilization. The faster the turnover speed is,the higher the utilization efficiency of current assets is,and the stronger the operation capacity is[15]. In terms of index composition,CAT is composed of operating income and current assets which are most related to the fraudulent means of sample companies.
R10: inventory turnover rate (ITR) is the ratio of main business cost to average inventory. ITR is mainly used to measure the sales ability and inventory management level of a company. The higher the ratio,the stronger the liquidity of the inventory,the higher the inventory operation efficiency of the purchase,production,sales,and the weaker the motivation of enterprises to commit financial fraud[16]. ITR is composed of inventory and cost of sales,which are major related projects of common fraud means of Chinese listed companies.
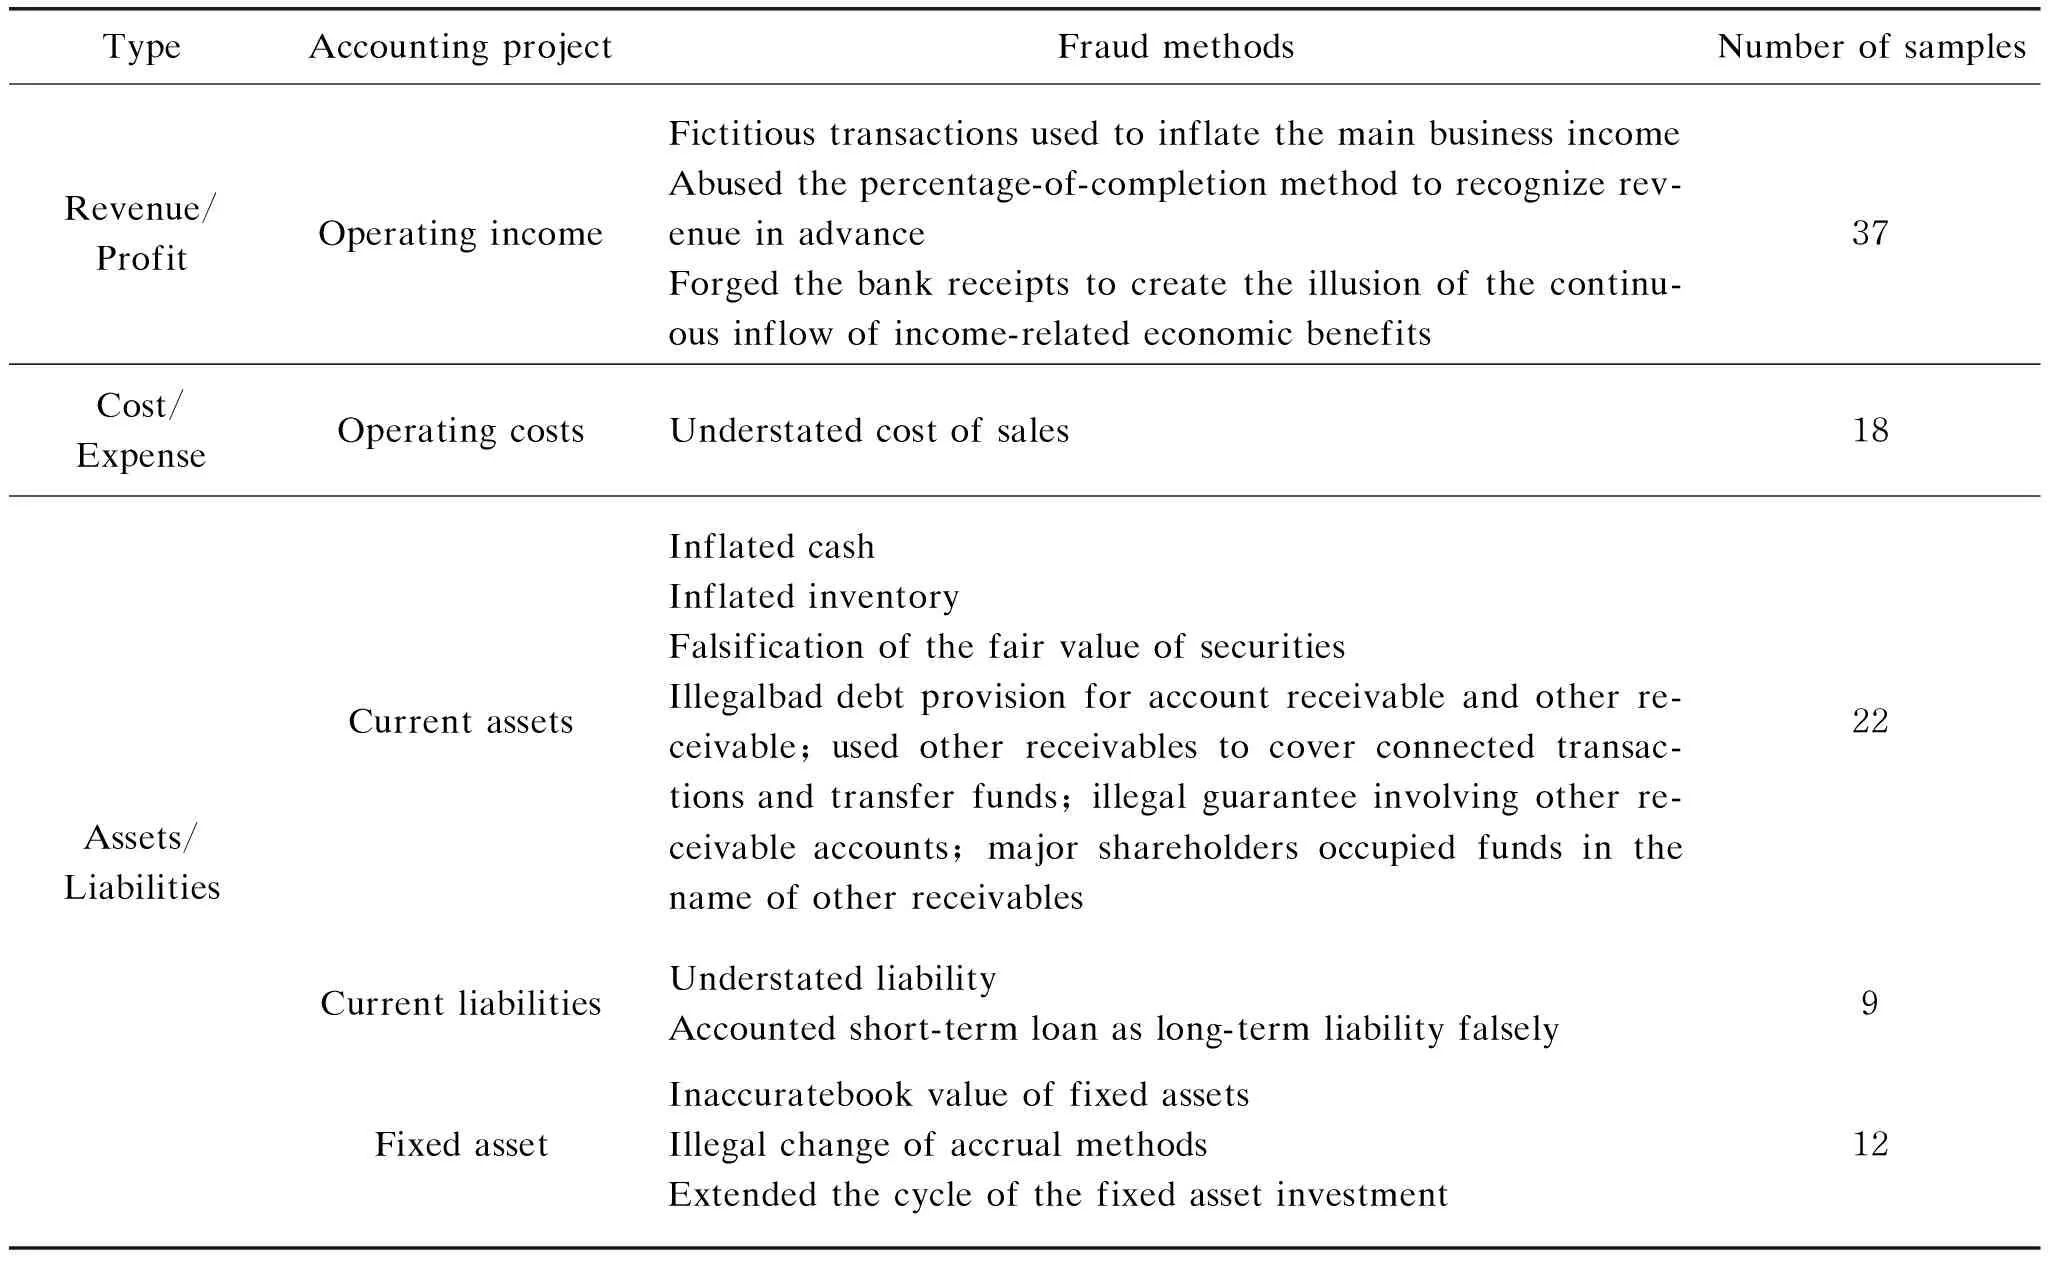
Table 2 Fraud methods of M-score test failed samples
R11: other receivables index (ORI) is the ratio of other receivables to total assets. Other receivables are used to account for the economic transactions between companies and other units. The contents are various,and there is no clear standard for this account. Therefore,it is often used for financial fraud. Generally speaking,the ORI is high,which means that companies are likely to use the account to hide profits,cover up expenses,intercept earnings,and transfer funds[17]. As shown in Table 2,a large part of fraud involved current assets is related to other receivables.
R12: bad debt provision index (BDPI) is the ratio of bad debt provision to total profit. For the company with a large number of receivables,a slight change in bad debt provision will lead to a huge difference in net profit. By less provision for bad debts,the company can instantly “pull up” the company’s profit; by more provision for bad debts,the newly appointed managers can deliberately “do bad” the performance of the previous manager,and then create the illusion that profits increased year by year through less or even no provision for bad debts. As shown in Table 2,many sample companies committed fraud by illegal bad debt provision for account receivable and other receivable.
R13: cash rate of sales (CRS) is the ratio of operating cash flow to main business income. CRS is used to measure the ability to obtain cash. The larger the ratio is,the higher the quality of the sale is,the better the effect of capital utilization is. The low cash rate of sales indicates that the sales quality and cash ratio are both low,and the possibility of false income is high[11]. CRS is composed of main business income and operating cash flow,both of which are related to the most commonly used operating income frauds by Chinese listed companies.
R14: fixed asset index (FAI) is the ratio of fixed assets to total assets. As a non-current asset account,fixed assets are often used for financial fraud in a concealed way. If the early inflated fixed assets are not discovered,the value of this part can be gradually resolved by depreciation and impairment in the later stage,which is not easy to cause the sudden disconnection between profit and cash flow and won’t cause investors to suspect. By deliberately underestimating the investment cost of fixed assets,enterprises can reduce the cost or expense and artificially increase profits[18]. As shown in Table 2,fixed asset fraud is a common type of asset fraud.
R15: current ratio (CR) is the ratio of current assets to current liabilities. CR is used to measure the solvency of a company. The lower CR indicates the worse short-term liquidity of the company and the higher possibility of fraud. The index is composed of current assets and current liabilities,which are the most common types of asset / liability fraud in Chinese listed companies.
2.2.2Non-financialvariables
R16: equity concentration (EC) is the sum of squares of the shareholding ratio of the top 5 shareholders. Moderate concentration of equity can create a convergence effect among shareholders,which is beneficial to corporate governance and performance improvement. However,highly concentrated equity will make the majority shareholders with absolute control rights infringe on the interests of other shareholders. As shown in Table 2,in some sample companies,there are illegal guarantees and illegal occupation of funds by major shareholders. However,another view is that the higher the equity concentration,the more convenient it is for the majority shareholders to control and manage the company,thus reducing the opportunistic behavior of the management and the occurrence of financial fraud[11].
R17: independent directors ratio (IDR) is the ratio of the number of independent directors to the number of board members. Independent directors need to make objective and professional judgments on the company’s affairs. To a certain extent,independent directors can stand on the position of small and medium shareholders and play a role in supervision and warning for the management. The higher the proportion of independent directors is,the lower the possibility of financial fraud is[19].
R18: audit opinion (AO) takes specific values according to different results. Take 1 for unqualified opinions; take 2 for unqualified opinions with explanatory notes; take 3 for qualified opinions; take 4 for rejected or unable opinions; take 5 for negative opinions; take 6 for unaudited opinions; take 7 for reserved explanatory notes.
The type of AO can reflect the authenticity and accuracy of the audited company’s finances,while the western fraud identification model does not include this factor. According to Huang,the higher the AO type,the worse the authenticity and accuracy of the company’s financial status,so the higher the possibility of fraud[20]. Almost all of the 57 fraud samples counted in Table 2 were issued with non-standard unqualified opinions.
The added variables themselves or the variable composition are closely related to the accounting items involved in fraud means,and can represent the financial fraud characteristics of Chinese listed companies.
3 Logistic Regression Model Construction
3.1 Model modification
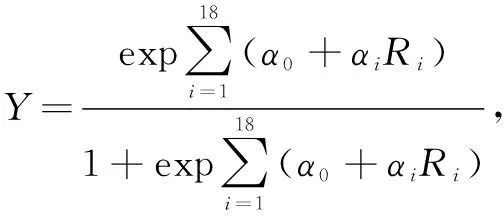
Whether or not fraud is a binary classification result. The logistic regression function is constructed as
(2)
whereYis binary variable of financial fraud. When the financial fraud occurs,Ytakes 1,otherwise,Ytakes 0;α0is constant;R1,R2,...,R8are the original model variables;R9,R10,...,R18are the added variables;αiis the pre-index coefficient,i=1,2,...,18.
In Eq. (2),the 18 variables are modeled using the remaining 60% random sample (modeling samples) to avoid endogenous problems. Because of the large sample size and the unknown correlation between indicators,the logistic stepwise regression method based on Wald was used to build the model.
Logistic regression results show that after ten stepwise backward regressions,nine variables finally enter into the model:R2(GMI),R4(SGI),R5(DEPI),R7(LVGI),R8(TATA),R14(FAI),R15(CR),R16(EC) andR18(AO). The significant negative correlation ofR8indicator is contrary to the results of the original model research,but consistent with the research results of Qian and Luo[11],which indicates that the proportion of accrued items of fraudulent companies in China is lower than that of normal companies. And due to the deterioration of short-term payment ability of fraudulent companies,the increment of business payables is higher than that of receivables. The negative correlation ofR7is consistent with the research conclusion of Qiao and He[21]. The fraudulent company disguised financing ability and solvency by falsely increasing assets and reducing liabilities. At this time,the asset-liability ratio drops,and leverage index decreased.
The formula of the modified M-score model can be obtained in Table 3. The modified M-score can be calculated a probability value by substituting relevant indicators to judge the possibility of financial fraud in a company.
M′=-1.645+0.009R2+0.051R4+0.061R5-
0.586R7-2.049R8-0.240R14-0.148R15-
2.001R16+0.405R18,
(3)
whereM′ is the modified M-score value calculated by Eq. (3). The nine variables of the modified M-score model can explain the financial fraud from three perspectives.
(1) Motivation perspective. The deterioration of gross profit margin (GMI rises) indicates that the company’s profit has decreased and its profitability has been weak. The decline of TATA and current ratio is a signal of poor short-term liquidity. At this time,to maintain sales growth and continue to obtain capital,the management tends to manipulate profits. The loose shareholding structure also makes management unable to be effectively restrained,so there is more implementation space for fraud.
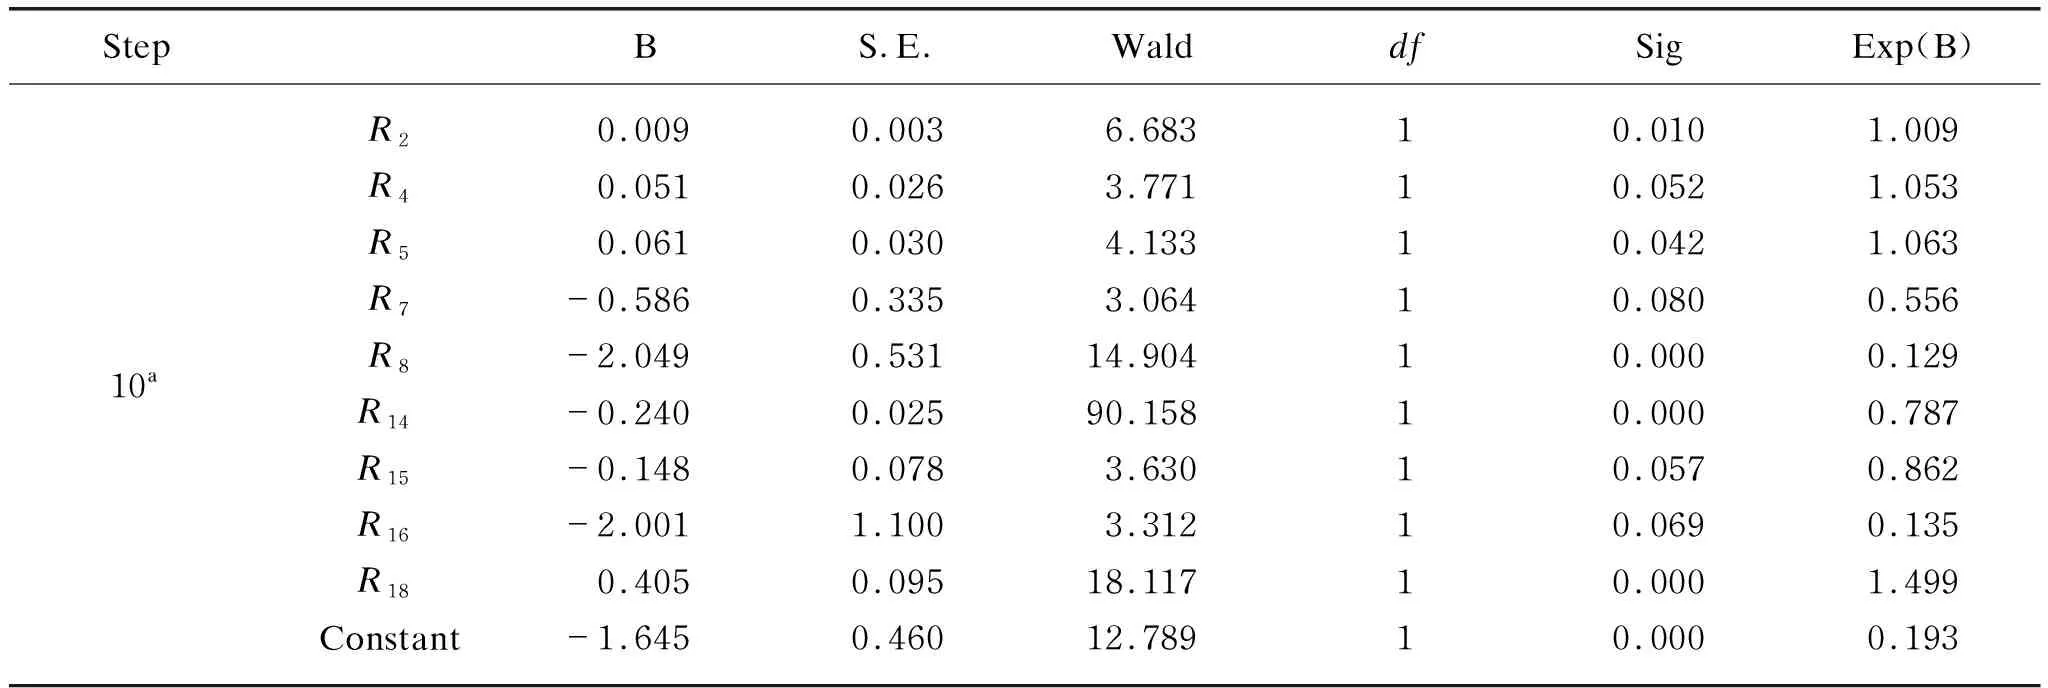
Table 3 Logistic regression results
(2) Behavior perspective. In order to alleviate the performance pressure,the manager often adopts the method of reducing the depreciation rate (DEPI rises) to extend the service life of the assets,“dilute” the depreciation expenses of each period,and reduce the deduction of profits; or adopt the method of reducing liabilities and increasing assets to create the illusion of good asset conditions and strong financing solvency; or use more concealed methods to falsely increase fixed assets in the early stage,and then gradually depreciate this part of the value through depreciation and impairment.
(3) Consequence perspective. The type of audit opinion can reflect the authenticity and accuracy of the company’s finances. A listed company that has been issued a non-standard unreserved audit opinion has a noteworthy financial position.
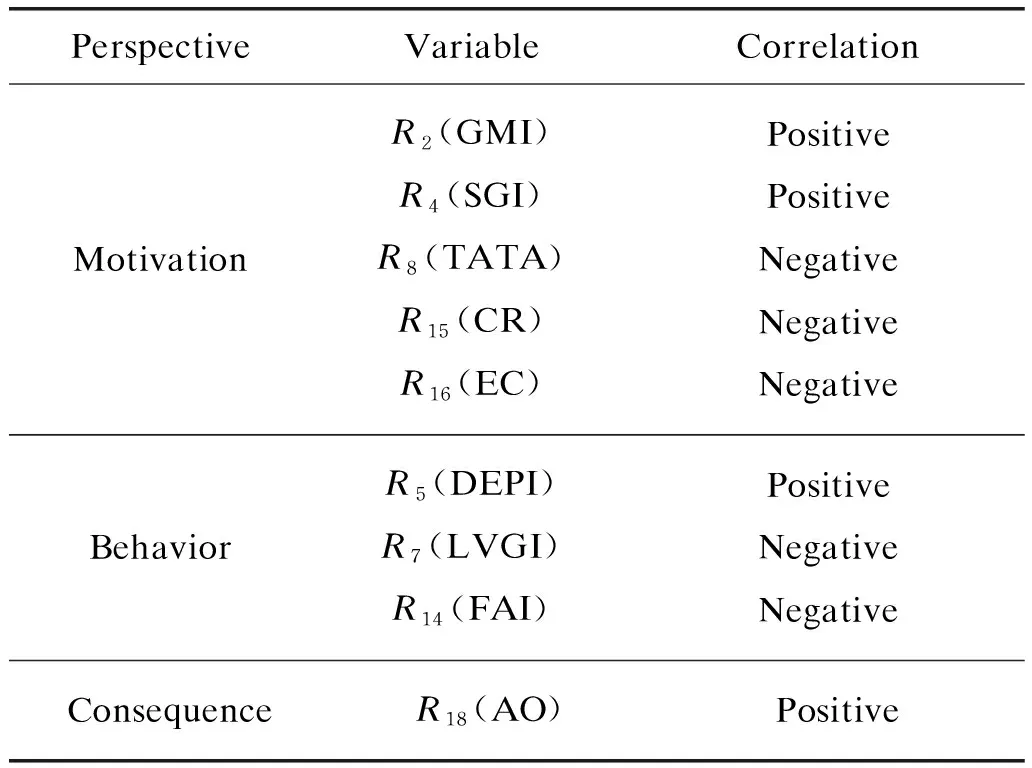
Table 4 Three perspectives of explanatory variables
Therefore,when the gross profit margin of listed companies deteriorates,the short-term solvency becomes worse,the management under theperformance pressure is prone to financial fraud. The loose shareholding structure makes room for the growth of fraudulent motives. To whitewash the report,the management usually adopts methods such as reducing liabilities,increasing fixed assets,and lowering depreciation rate. Companies with financial problems are more likely to be issued non-standard unqualified audit opinions,which is also a signal of financial warning.
3.2 Threshold setting
Any threshold can make two types of errors and produce error costs. In the case of the Type I error,investors can’t identify the fraudulent companies,which results in the loss of investment;In the case of the Type II error,investors mistakenly judge the normal operation companies as fraudulent companies,which limits the investment opportunities. There is no perfect threshold in theory,but the better the value is,the more accurate the model classification is,and the lower the error cost is. Three threshold determination methods are used to find the optimal threshold.
3.2.1Beneishexpectedcostmethod(ECM)
ECM is calculated according to two types of errors and the expected cost caused by misjudgment. The formula is as follows:
CECM=PMP1C1+(1-PM)P2C2,
(4)
whereCis the expected cost;PMis the ratio of fraud sample to total sample;P1andC1are the Type I error and its misjudgment cost;P2andC2are the Type II error and its misjudgment cost. The threshold is optimal when ECM takes the minimum value. Beneish’s assumption isC1/C2=N,C2=1,C1=N=40[12].
The modeling samples are used here. It is calculated thatPM= 0.018 38 andCECM= 0.735 4P1+ 0.981 6P2. When the Type I error rate is 12.84% and the Type II error rate is 9.81%,the ECM value is the smallest (0.190 76),and the threshold value is -2.90.
3.2.2Dechowmethod
Dechow threshold method can be directly calculated by[22]:
D=ln[PM/(1-PM)]=-3.98,
(5)
whereDis the threshold calculated by Dechow method.
3.2.3Youdenindexmethod
Youden index is a method to evaluate and screen the authenticity of a test. The larger the Youden value is,the better the screening effect is[23].
Yd=Ssen+Sspe-1,
(6)
whereYdis the threshold calculated by Youden index method; sen is the sensitivity,which is the correct detection ratio of fraud samples;Sis the value of authenticity; spe is the specificity,which is the correct detection ratio of non-fraud samples. By calculating the Youden value of 5 929 groups through Visual Basic for Applications (VBA),it is found that when the threshold value is 2.07,the Youden value reaches the maximum (0.982 1).
In order to select the optimal threshold,testing samples were used to test the three thresholds respectively. From the comparison results in Table 5,Type II error of the Youden index threshold (2.07) is zero,but the Type I error rate is as high as 97.25%,which violates the original intention of the fraud identification tool to help investors avoid risks. The Type I error of the Dechow threshold (-3.98) is the lowest,but the Type II error rate reaches 29.81%,which represents an overly cautious investment method and misses many possible returns. Taken together,the two types of error of the ECM threshold (-2.90) are both low,indicating that while helping investors identify fraudulent companies,and it will not miss too many investment opportunities.

Table 5 Comparison of threshold detection results
4 Results and Discussion
For the modified model constructed in Eq. (3) and the new threshold value of -2.90,the testing samples are used for effect test and the results are shown in Table 6. The comparison of test results in Table 7 shows that the detection effect of the modified M-score model has been significantly improved compared to the original model. The Type I error rate is reduced to 19.75% and the Type II error rate is only 9.81%,which proves that the modified M-score model is more suitable for the Chinese market.

Table 6 Test results of modified M-score

Table 7 Comparison of test results between M-score
The Receiver Operating Characterist (ROC) curve is used to further verify the overall prediction ability of the modified model. Figure 1 is a comparison of the ROC curves of the M-score and the modified M-score for the full sample. The horizontal and vertical axes represent the specificity and sensitivity of the model indicators respectively[24]. The area below the ROC line measures the discrimination ability of the model. The area between 0.7 and 0.8 indicates that the model’s prediction ability is average. In the range of 0.8 to 0.9,the predictive ability of the model is good. The modified M-score model has an area of 0.920,and its prediction ability is much higher than that of the M-score.
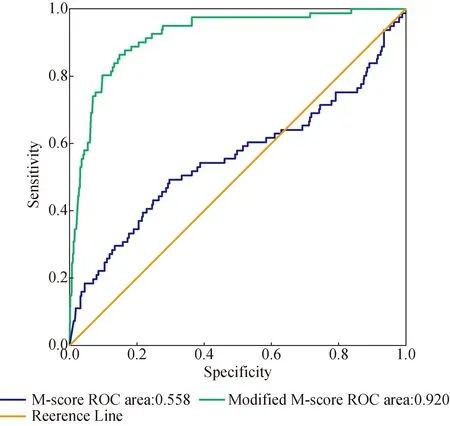
Fig. 1 ROC curves of M-score and modified M-score
5 Conclusions
The modified M-score includesR2(GMI),R4(SGI),R5(DEPI),R7(LVGI),R8(TATA),R14(FAI),R15(CR),R16(EC) andR18(AO). This 9-index model indicates that when the gross profit margin of a listed company with a loose equity structure gradually deteriorates,the asset-liability ratio,current ratio,fixed assets ratio,and depreciation rate all show a downward trend,and short-term payments are in dilemma. At this time,the executives under sales pressure tend to take financial fraud. And fraudulent companies are likely to be issued with non-standard unqualified opinions.
Beneish ECM sets an optimal threshold to minimize the cost of classification errors. Compared with M-score,the overall discrimination accuracy of the modified model is improved to 89.98%. Meanwhile,the area of 0.920 under ROC curve also proves that the modified model has significant discrimination and prediction effect on financial fraud. In general,the modified M-score model characterizes the fraud characteristics of Chinese listed companies better,and is more suitable for the Chinese market.
 Journal of Donghua University(English Edition)2020年3期
- Journal of Donghua University(English Edition)的其它文章
- Recent Progress for Gallium-Based Liquid Metal in Smart Wearable Textiles
- Accident Analysis and Emergency Response Effect Research of the Deep Foundation Pit in Taiyuan Metro
- Effect of Elastane on Physical Properties of 1×1 Knit Rib Fabrics
- Knowledge Graph Extension Based on Crowdsourcing in Textile and Clothing Field
- Analysis on the Application of Image Processing Technology in Clothing Pattern Recognition
- Clothes Keypoints Detection with Cascaded Pyramid Network
