
A nomogram of 5-year risk of type 2 diabetes in Chinese population
2020-09-18 06:20:50XinTianCaiDeLianZhangJingHongQingZhuTingWuNanFangLi
Journal of Hainan Medical College 2020年15期
Xin-Tian Cai, De-Lian Zhang, Jing Hong, Qing Zhu, Ting Wu, Nan-Fang Li
Hypertension Center of the People’s Hospital of Xinjiang Uygur Autonomous Region, National Health Committee Key Laboratory of Hypertension Diagnosis and Treatment Research, Urumqi 830001, China
Keywords:Chinese population Type 2 diabetes Risk factors Nomogram
ABSTRACT Objective: The aim of this study was to analyze the risk factors of type 2 diabetes in 5 years in Chinese population, and to construct the prediction model of nomogram and verify its validity. Methods: The physical examination and follow-up data of the participants who received physical examination at 32 sites in 11 cities in China from 2010 to 2016 were collected from the Dryad digital repository database. Randomly divided into modeling group (n = 22936) and validation group (n = 9830). In the modeling group, the independent risk factors were determined by single factor and multi factor analysis based on Cox regression model, and the nomogram prediction model was constructed by R software. The accuracy and performance of the model were evaluated by AUC value, C-index and calibration curve. Results: The multivariate regression model suggested that fasting blood glucose, triglyceride, smoking history and drinking history were independent risk predictors of 5-year risk of type 2 diabetes in Chinese population. In the modeling group, AUC was 0.776 (95%CI: 0.699-0.849), and C-index was 0.783 (95%CI: 0.706-0.856). Similarly, in the validation group, the AUC value was 0.743 (95%CI:0.665-0.824), and the C-index was 0.764 (95%CI: 0.667-0.846), suggesting that the model had a good discrimination ability. The 5-year adjusted risk curve of type 2 diabetes in Chinese population suggests a good consistency between the predicted value and the actual value. Conclusion: The nomogram model can predict the 5-year risk of type 2 diabetes in Chinese population intuitively and accurately.
1. Introduction
Type 2 diabetes mellitus (T2DM) is a global epidemic. Today, about one in 11 adults in the world has diabetes, and T2DM accounts for 90 — 95% of all diabetes. According to the latest report of the International Diabetes Federation, in 2017, about 451 million adults aged 18 to 99 in the world had diabetes. By 2040, this estimate is expected to increase to 642 million [2]. In China, a large-scale epidemiological survey report based on demography points out that in 2010, more than 113.9 million adults (11.6% of the adult population) had diabetes, 493.4 million adults (50.1% of the total population) were in the stage of pre-diabetes and impaired fasting blood glucose [3]. T2DM and its complications have greatly increased the burden of death and disability worldwide. In the report of the International Diabetes Federation, it is estimated that the number of deaths caused by diabetes and its complications among adults aged 20-79 in the world during 2015 will be at least 5 million [4]. Although genetic predisposition partly affects the susceptibility of individuals to T2DM, unhealthy eating habits and sedentary lifestyles are still important driving factors of global prevalence. Changes in lifestyle, including maintaining a healthy weight, moderate physical activity, smoking cessation and alcohol prohibition, can prevent most T2DM cases.
Nomogram is a convenient graph to show the mathematical model, which combines various important factors to predict specific terminal events. In all existing models, nomogram allows personalized and evidence-based risk assessment, which has gradually become a reliable and convenient tool for quantifying risk, thus promoting management related decision-making [5]. Therefore, the purpose of this study is to develop and validate a nomogram for individual prediction of 5-year risk of T2DM in Chinese population.
2. Materials and methods
2.1 Object of study
The data of this study comes from the public database Dryad digital repository (http://www.datadryad.org/), which is a nonprofit database of basic data of international scientific and medical literature. The original data was provided by Chen et al. [6]. We downloaded the original data and made a secondary analysis. Chen et al. Conducted a retrospective cohort study using a computer database established by the rich healthcare group in China. The original data includes all the medical records of the participants who received health examination at 32 sites in 11 cities (Shanghai, Beijing, Nanjing, Suzhou, Shenzhen, Changzhou, Chengdu, Guangzhou, Hefei, Wuhan, Nantong) in China from 2010 to 2016. The inclusion criteria included: 1. Participants were followed up at least twice between 2010 and 2016; 2. The interval between participants was ≥ 2 years; 3. There was no diabetes in participants' baseline diagnosis and fasting blood glucose was less than 7.0mmol/l for the first time; 4. There was no extreme value in participants' baseline data; 5. There was no missing value in participants' baseline data; 6. Participants' age was ≥ 20 years.
2.2 Data Collection
At each follow-up, participants were asked to complete a detailed questionnaire to assess demographics, lifestyle, chronic medical history, and family history. Height, weight and blood pressure are measured by professional staff. Weight measurements are accurate to 0.1 kg, height measurements are accurate to 0.1 cm, and body mass index (BMI) is calculated by weight (kg) / height2 (m2). Blood pressure is measured with a standard mercury blood pressure meter. Participants were asked to fast for at least 10 hours before each follow-up and collected blood samples from the veins after the fast. Serum triglycerides, total cholesterol, HDL, LDL and plasma glucose levels were measured using an automated analyzer (Beckman 5800). T2DM can be diagnosed if any of the following conditions are met: (1) the current use of sugar-lowering drugs, (2) fasting blood sugar of 7.0 mmol/L, or (3) self-reported explicit diagnosis of T2DM.
2.3 Statistical analysis
Statistical analysis is mainly carried out by R software (version 3.6.1) (htlps: / / www.r-project. Org /). In order to make the nomogram more convenient for practical application, we use the X-tile software (https://medicine.yale.edu/lab/rimm/research/software/) [7] to obtain the best cut-off value of the continuity variable and convert the continuity variable into the classification variable. Continuous variables were expressed as mean ± standard deviation and analyzed by t test or Mann Whitney U test of independent samples. Classification variables are expressed in frequency and percentage, and analyzed by chi square test or Fisher test. All data were divided into modeling group (70%) and verification group (30%) according to the ratio of 7:3 by random sampling. Using the data of modeling group, Cox proportional risk regression model was used to screen the independent risk factors. In the single factor Cox proportional risk regression analysis, the variables with P < 0.1 were included in the multi factor Cox proportional risk regression model, and further analysis was carried out with the positive step-bystep method, in which the variables with P < 0.05 were considered as potential predictive variables. The model of nomogram was constructed and validated by using the prediction variables. In order to evaluate the discrimination ability of nomogram, we used the bootstrap method of 1000 times to calculate the area under ROC curve (AUC) and C index of modeling group and verification group respectively. And combined with the Hosmer-lemeshow test, the calibration curves for the model group and the validation group were drawn to evaluate the model calibration [8]. Bilateral p value < 0.05 was considered statistically significant.
3. Results
3.1 Studying the characteristics of the population
A total of 32766 participants were included in the study, including 22936 participants in the modeling group and 9830 participants in the validation group. The median follow-up time was 3.0 years, the longest was 5.7 years and the shortest was 2 years. X-tile software analysis results of continuous variable data show that age, BMI, fasting blood glucose value, total cholesterol, triglyceride, highdensity lipoprotein, low-density lipoprotein and other continuous variables can be converted into three categories of variables. See Table 1 for the specific cutoff value. The baseline data characteristics of the modeling and validation groups are described in Table 1. There was no significant difference in the following up time, incidence rate of T2DM, prevalence of hypertension, fasting blood glucose, total cholesterol, triglyceride, high-density lipoprotein, low density lipoprotein, smoking status, drinking status and family history of diabetes between the two groups.
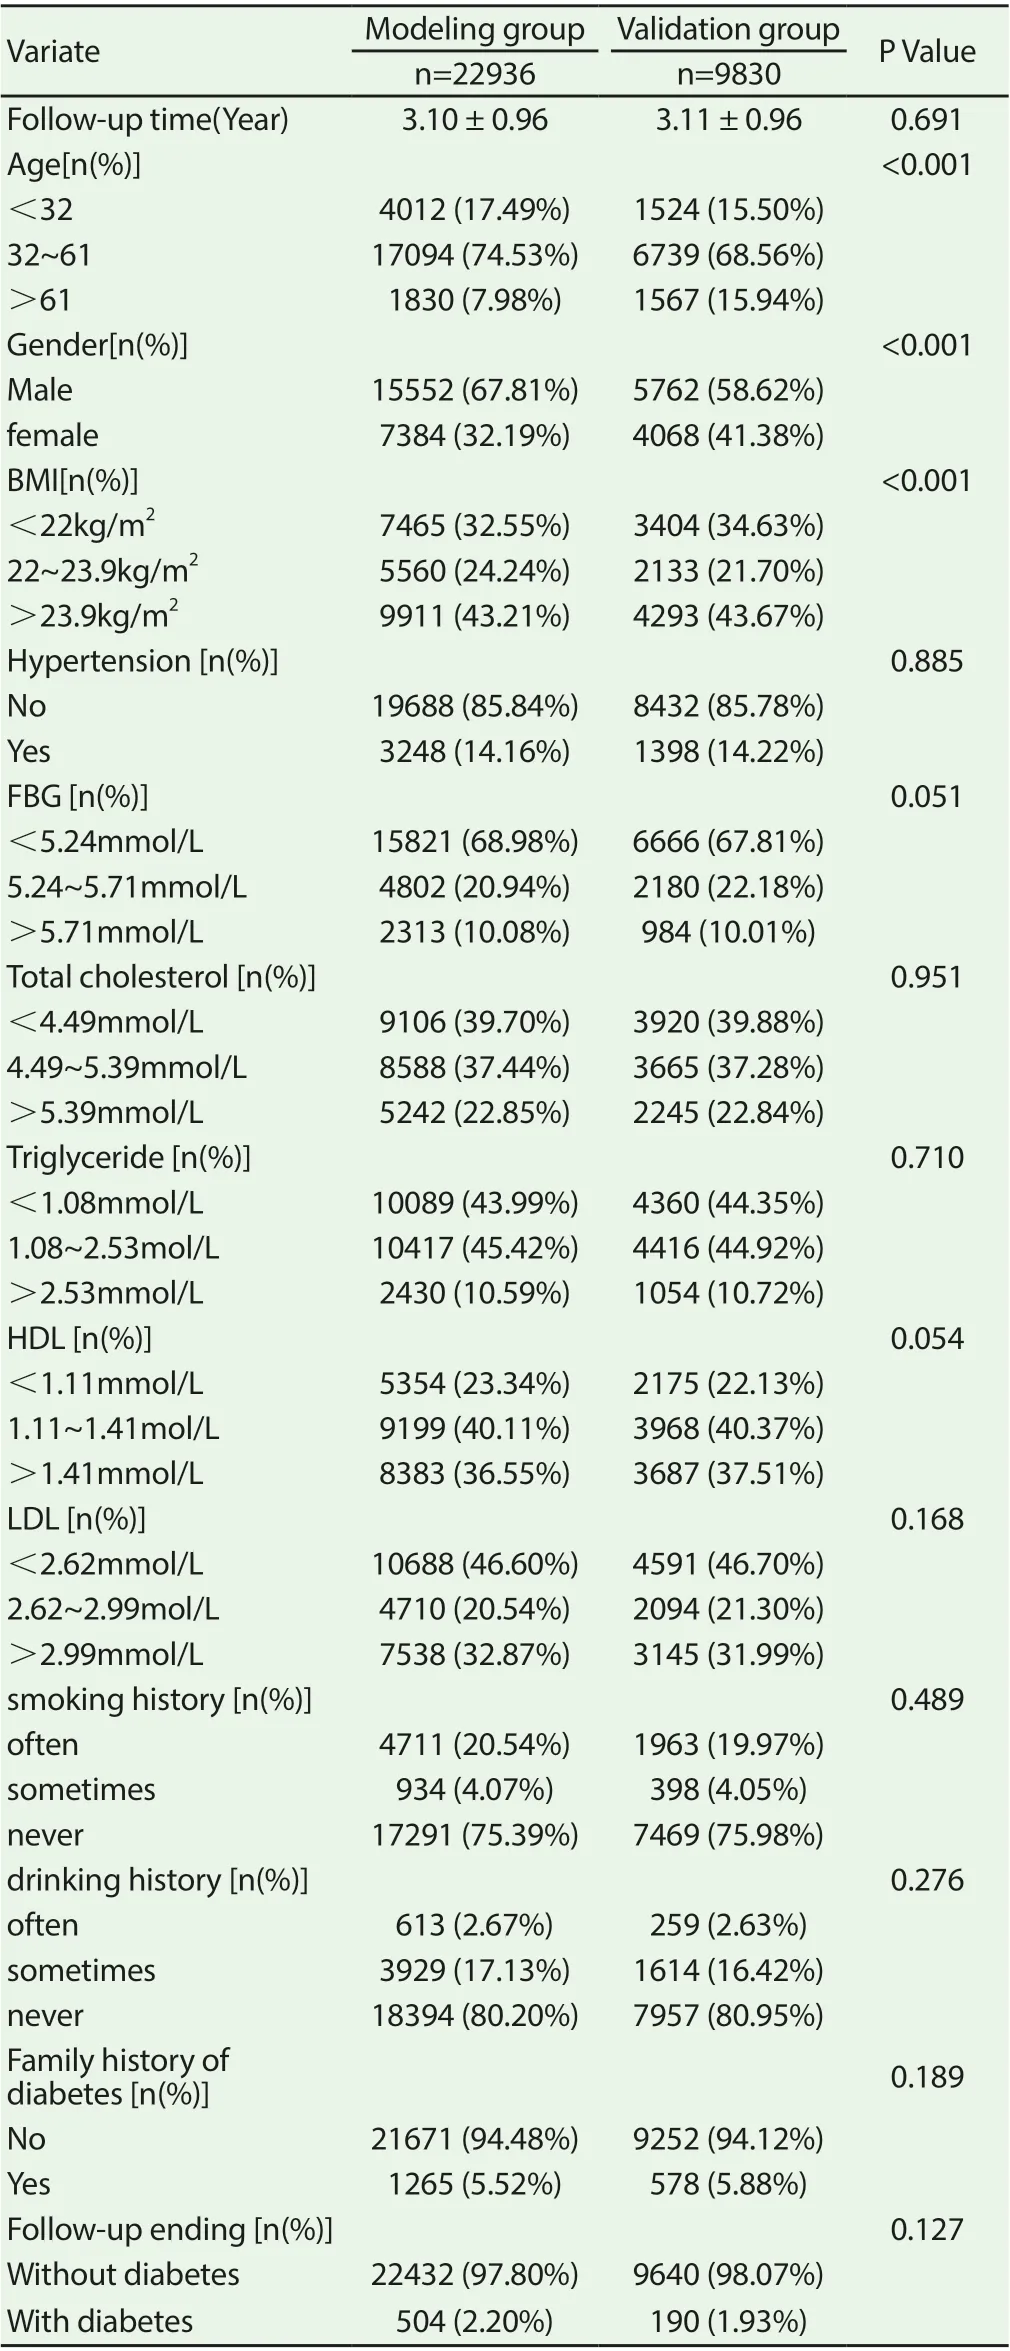
Table 1 Comparison of demographic characteristics and clinical baseline data between the modeling group and the validation group
3.2 Independent risk factors for modeling groups
After single factor Cox regression analysis of the data of the model group, it was found that the p-values of fasting blood glucose, total cholesterol, triglyceride, high-density lipoprotein, low-density lipoprotein, smoking history, drinking history and family history of diabetes were less than 0.05 at the first investigation. The above indexes were further included in the multivariate Cox regression analysis model. The results of multivariate analysis showed that fasting blood glucose, triglyceride level, smoking history and drinking history were independent risk predictors of T2DM, which could be used to establish nomogram. Table 2 lists the results of single factor and multi factor Cox proportional risk regression models for each variable.
3.3 Development and verification of T2DM prediction nomogram
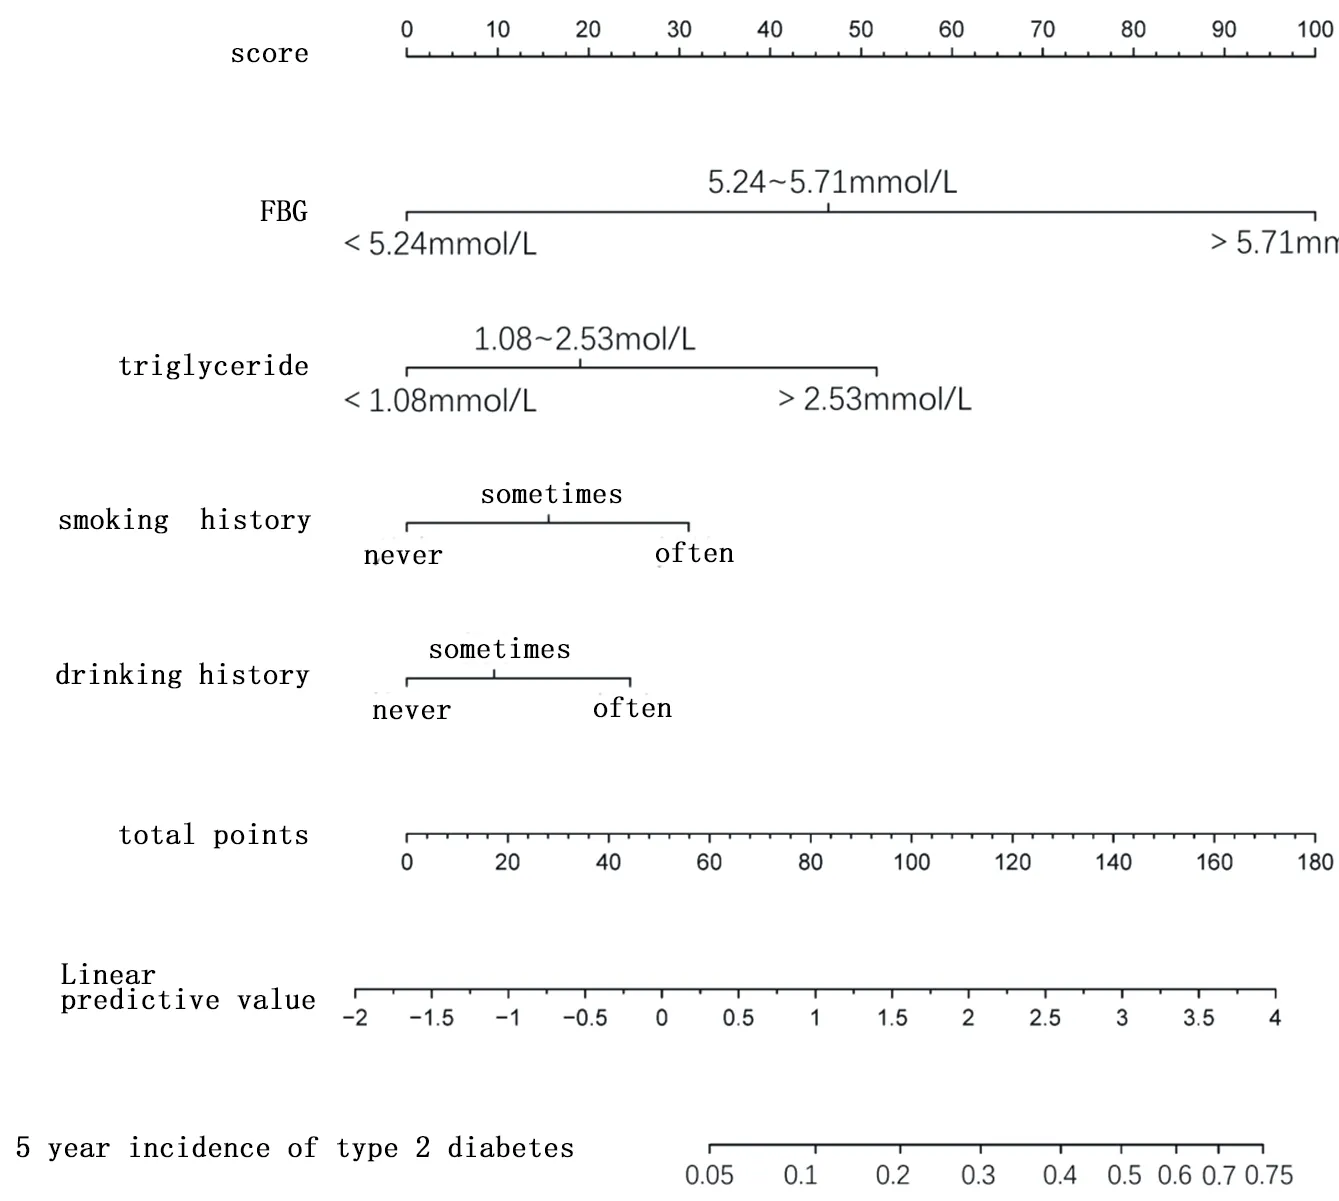
Figure 1 A nomogram model for the incidence rate of type 2 diabetes in Chinese population in 5 years
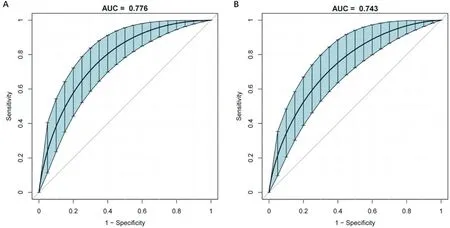
Figure 2 ROC curve of the incidence rate of type 2 diabetes in Chinese population by the nomogram model
Figure 3 Calibration curve of nomogram model
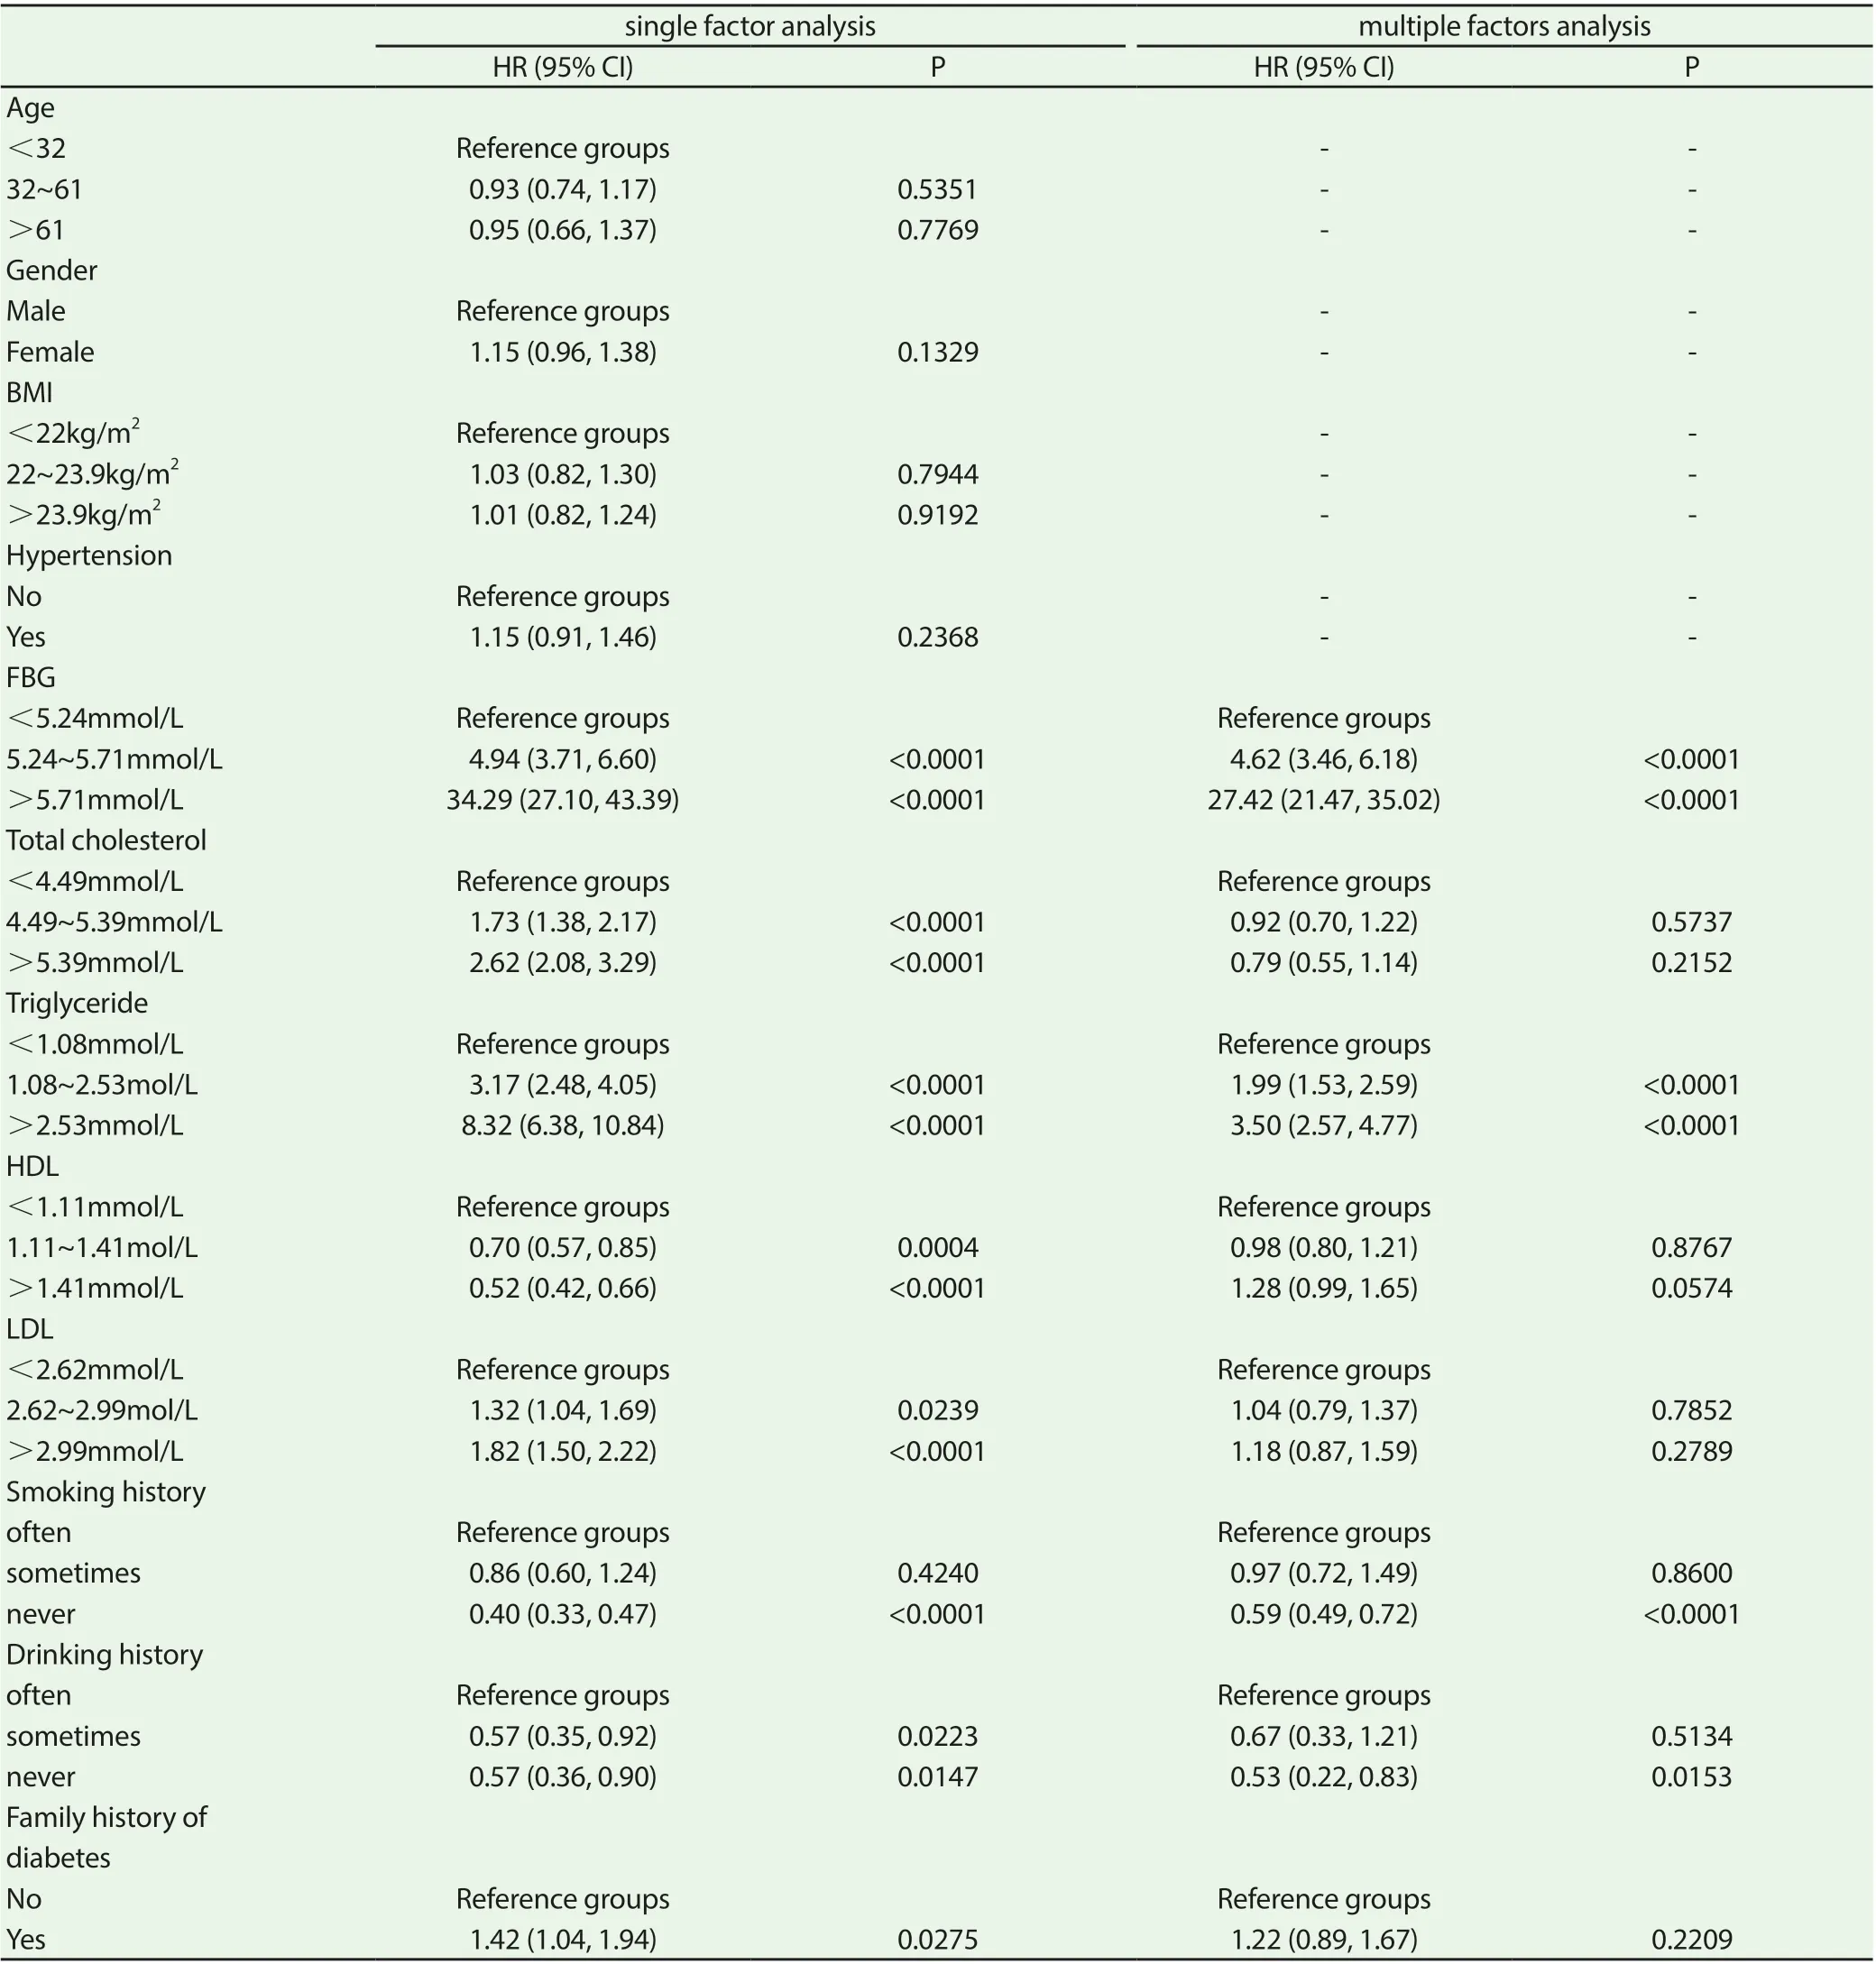
Table 2 T2D risk prediction based on single-factor and multi-factor COX proportional risk regression model
4. Discussion
Diabetes is one of the most common endocrine and metabolic diseases. With the rapid development of social economy and the change of people's lifestyle (energy intake and sports decline) and aging population, the incidence rate of T2DM has been increasing year by year, especially in China's developing countries, China's growth rate is faster than [3]. At present, the increasing incidence rate and mortality rate of T2DM are seriously endangering public health. In 2017, about 5 million people aged 20-99 died of diabetes and its complications, accounting for about 10% of the global all-cause mortality [9]. Diabetes has become the third non infectious disease that threatens human health and life after cardiovascular system diseases and malignant tumors [10]. It is estimated that by 2045, the global health care expenditure of people aged 20-99 due to diabetes will increase to US $958 billion. Primary prevention and early intervention are the key to prevent or delay the occurrence of T2DM [11]. Therefore, it is very important to detect those high-risk groups who are suffering from diabetes and reduce the incidence rate.
At present, a number of diabetes prediction models based on demographic information and clinical measurement indicators have been established in Europe, North America and Asia [6, 12-14]. In view of the differences of genetic background, environment, lifestyle and economic level, the risk factors of T2DM are different in the intensity and distribution of different populations, which means that a single prediction model may not be effective in different ethnic groups. In recent years, several T2DM risk prediction models have also been developed for Chinese population. In 2019, Zhang et al. [15] set up a simple model to predict the incidence rate of diabetes in Urumqi physical examination population, and estimated AUC value was 0.685-0.702. In 2018, Bai et al. [16] constructed a T2DM risk prediction model based on the data of the physical examination population in the physical examination center of Beijing Aerospace general hospital. The AUC value of the model was 0.912 (95% CI: 0.898-0.927). Similarly, Yang et al. [17] constructed a T2DM risk prediction model based on the data of physical examination population in the physical examination center of Affiliated Hospital of Shandong University. The area under ROC curve of the modeling group was 0.742 (95% CI: 0.732-0.752), and the area under ROC curve of the verification group was 0.760 (95% CI: 0.748-0.772). Zhang et al [18] constructed four risk scoring models of non-invasive T2DM for Chinese rural adults based on the data of a township sampling survey in Henan Province. The AUCs of the four models were all close between 0.67-0.70.
All of the above studies in China are single center studies. Considering the huge diversity of China's population, the results of single center research may not reflect the regional characteristics and achieve good applicability in other regions of China. Our multicenter, retrospective cohort study just fills in this gap. In addition, previous studies on T2DM risk prediction in China only used simple regression coefficient to score T2DM risk, and our nomogram model can provide a more simple, quick and personalized risk prediction. In this study, based on the data of rich healthcare group in China, we developed a quantifiable, simple and applicable nomogram model to predict the risk of 5-year T2DM in Chinese population. The internal validation results show that the model has high prediction accuracy in both modeling and validation queues. In addition, this nomogram model has great practical value because of its easy to obtain clinical detection indicators. Although this study has the above advantages, it still has the following shortcomings: 1. This study is a retrospective cohort study, and individual data with incomplete data are excluded, which may lead to selection bias, which needs further verification by prospective research; 2. There are fewer risk factors included in the model in this study. Therefore, it is necessary to further incorporate more recognized risk factors into other validation studies to improve the performance of the model; 3. This study uses internal validation, so it can not guarantee the applicability of external data. Therefore, we need to further complete the verification research of external data.
In conclusion, this study has developed and verified the highly accurate T2DM 5-year risk prediction model nomogram. The nomogram can be used to conveniently evaluate the 5-year risk of T2DM in healthy adults, better guide high-risk personnel to carry out early intervention, prevent or delay the occurrence of T2DM.
 Journal of Hainan Medical College2020年15期
- Journal of Hainan Medical College的其它文章
- Mechanism of Duhuo Jisheng Decoction based on bioinformatics and network pharmacology in treating osteoporosis of kidney Yin deficiency
- Clinical features and prognosis of patients with novel coronavirus pneumonia complicated with diabetes
- Yiqi Huoxue Decoction in the treatment of Qi and yin deficiency and stasis type diabetic nephropathy in stage Ⅲ and its effect on VEGF and TGF-β1
- Relationship between nap and hypertension in adults: An updated meta-analysis
- A meta-analysis of the safety of clopidogrel and tegrarol in patients with non-ST elevation acute coronary syndrome after PCI in China
- Super-minimal incision kidney transplantation: Report of 6 cases