Investigation of turbulence rotation in the SOL and plasma edge of W7-X for different magnetic configurations
A KRÄMER-FLECKEN, X HAN,2, M OTTE, G ANDA, S A BOZHENKOV,D DUNAI,G FUCHERT,J GEIGER,O GRULKE,E PASCH,E R SCOTT,E TRIER, M VÉCSEI, T WINDISCH, S ZOLETNIK and theW7-XTeam
1 Institute for Energy- and Climate Research/Plasma Physics , Forschungszentrum Jülich GmbH, 52425 Jülich, Germany
2 Institute of Plasma Physics, Chinese Academy of Sciences, Hefei 230031, People’s Republic of China
3 Max Planck Institut für Plasmaphysik, 17491 Greifswald, Germany
4 Wigner Research Centre for Physics, 1525 Budapest, Hungary
5 Max Planck Institut für Plasmaphysik, 85748 Garching, Germany
Abstract The W7-X stellarator is optimized with respect to neoclassical transport.Therefore turbulent transport plays an important role.It is equipped with an inertial cooled graphite divertor which intersects the island chain at the plasma edge depending on the magnetic configuration. Additional control coils and the plasma current modify the iota profile at the plasma edge and shift the position of the island chain.To monitor the effects on the poloidal propagation velocity in the scrape-off layer(SOL)and the plasma edge,an O-mode Poloidal Correlation Reflectometer(PCR)is used which simultaneously monitors the propagation of low-k turbulence.Operating in the density range of 0.6×10¹⁹ m-3 to 2×10¹⁹ m-3 it covers a large part of the SOL and the plasma edge and allows for the experimental determination in the last closed flux surface (LCFS) and the associated shear layer in low to middensity discharges.In this paper it is shown that the propagation in the shear layer and its vicinity is determined best,when based on an elliptical model.Different magnetic configurations with magnetic edge topology of five independent islands for ι=1 and six linked islands for ι=0.81 are investigated.Also the effects of the plasma current and additional control coils on the edge magnetic topology are studied. The coherence spectra of antenna pairs for different poloidal separations is investigated.Using a decomposition method for the measured coherence spectra the characterization of turbulence spectra is possible with respect to e.g.broad band turbulence and quasi coherent modes.A strong reduction of the broad band turbulence is observed in the vicinity of the LCFS which is evidence for the suppression of low-k turbulence at the shear layer.
Keywords:stellarator,correlation reflectometer,turbulence rotation,scrape-off layer,island divertor(Some figures may appear in colour only in the online journal)
1. Introduction
The plasma edge and the scrape-off layer(SOL)are important regions in any fusion device. They isolate the well-confined core plasma from the divertor and first wall. Energy, if not radiated, and particles have to pass this region to reach the divertor plates. The last closed flux surface (LCFS) is the interface between the still confined plasma edge with long connection length in the order of kilometer and the SOL where the connection length is in the order of a few 100 m.In this region, the poloidal plasma rotation as well as the radial electric field changes sign generating a strong shear layer at the transition from closed to partly open magnetic field lines.This influences the propagation of small-scale structures which are expected to be torn apart by the shear. In addition,the mean gradients of density and temperature change a lot in this region which influences the properties of microscopic structures[1,2].Furthermore it gives rise to different kinds of modes as ion temperature gradient modes and ballooning modes. For this reason, the knowledge of rotation (v⊥)- andEr-profiles are of interest, because they determine the radial transport.
Regarding the tools used for probing these regions,diagnostics using microwaves are highly appreciated because they can be operated continuously during a discharge and do not perturb the plasma. Reflectometry with a high sampling rate is a suitable choice as long as the density fluctuation level is small enough allowing the assumption of a reflection at plasma cut-off density (rough mirror). However, when the density fluctuations become larger, the effects of small angle scattering will disturb the measurements[3].With a two-point measurement along the poloidal direction the estimation of the plasma rotation is possible. However, every poloidal correlation measurement implies a radial correlation as well due to the radial extension of the structure.In the vicinity of a shear layer, this effect could mask the real estimation of the velocity profile in the shear layer.Therefore two methods are used. One is based on the measurement of the delay time of two-point measurements from the cross correlation,only.The second one is based on the so-called elliptical model based on earlier work by Briggs [4], Phillips [5] and Conway [6].These two different methods are compared in this paper.
The experiments reported here are performed at the superconducting stellarator W7-X [7, 8]. W7-X is optimized for reduced neoclassical transport and has a 5-fold symmetry.In each of the five modules, the plasma cross section varies from bean shape to triangular shape. W7-X is equipped with an inertial cooled divertor. For the standard configuration
(ι=1) the divertor intersects the 5/5 island chain, which is located at the transition from the plasma edge to the SOL. In this configuration the influence of plasma current and additional control coils, which are supposed to change size and position of the edge island chain, is investigated. In the first part of the paper the rotation profiles are estimated for different magnetic configurations (different iota-profiles).
The last part of the paper discusses changes of the coherence spectrum estimated from two antennae in the vicinity of the LCFS looking for the assumed turbulence suppression of low wave number turbulence in the vicinity of a shear layer.
2. Methodology
The used correlation reflectometer [9–11] consists of two antennae columns next to each other, a left one with three antennae where the middle antenna is the launcher. In this column the upper antenna is labeled B and the lower C. This antenna pair has the largest poloidal separation. The right column with two antennae is labeled D (upper) and E (lower).Altogether four receiver antennae are available yielding six different antennae combinations. The system has been installed in the bean-shaped plasma cross section below the mid plane.The line of sight of the launching antenna is crossing the last closed flux surface(R,z) =(6 .203 m, -0.126 m) for the standard configuration.The common focal point of all antenna is located at(R,z) = (6 .0 m, -0.104 m) . For the estimation of the v⊥-profiles from correlation reflectometry two requirements are needed:(i)the measurement of the delay time from antenna combinations and (ii) a knowledge of the radius of the measurement which is determined by the cut-off density (nc) for O-mode polarization. To obtain v⊥from a correlation reflectomter, the delay time (Δt) from different independent antenna combinations (different poloidal separation z) is calculated via the cross correlation. Without a shear layer the propagation is determined from the slope of theΔ -t zdiagram[12].In case a shear layer is crossed the measured v⊥-profile is also influenced by a small radial propagation. A radial propagation of coherent structures in the SOL was reported at ≈10% of the ion sound speed [13]. In figure 1 the evolution ofΔtfor four antennae combinations is shown in the shear layer of W7-X. The mean poloidal distance for each configuration is increasing from combination EC to BC. In this case the reflectometer is in hopping operation and the probing frequency of the reflectometer is increased every20 ms by0.5 GHz. The expected change in the sign ofΔtdue to the shear layer is observed at different times for different antennae combinations. This observation is found in the standard configuration having an edge iota of ι=1 and a 5/5 island chain.As can be seen from the figure the transition happens earlier for larger poloidal distances than for smaller ones.The linear regression method applied for all six antennae combinations yields in this case a too large velocity because becauseΔtvalues for the largest separation are already negative whereas for the smaller ones the delays are still positive. This behavior clearly shows that this method will cause artificial large velocities in the shear layer. A possible explanation for this observation is found when analyzing the widths of the Gaussian functions used to approach the auto- and cross correlation in the delay time estimation.In figure 2 the width of the auto correlation function (σACF) and the cross correlation function(σCCF)are shown as a function of the cut-off density.In addition, the delay time for the combinations EC and DC is shown. In general both widthsσACFandσCCFyield similar values as long as there is no change in the delays.However,in a narrow region theσCCFbecomes nearly twice as large asσACFfor the combinations which probe a large poloidal separation e.g.combination DC. Furthermore, the shape of the CCF is no longer symmetric with respect to the maximum and exhibits an asymmetric shape. However, an asymmetric cross correlation function is evidence that the dominate structure undergoes a significant change in its size [14]. In this case the cross correlation measures two structures, one moving with positive delay whereas the other one has negative delay. The measured time series from the antennae is a combination of both structures and the amplitude of both structures decides on the height in the CCF.As a consequence the measuredσCCFbecomes broader.It is therefore necessary to use a better method than the one by Taylor[15]where the flow is frozen and changes in size of the structure as well as the decay not being taken into account. A model which can be applied in the shear layer is the elliptical model invented by Briggs[4]and Phillips[5]and applied for in the interpretation of plasma or fluid instabilities [6] and for turbulent shear flows by He [16, 17] based on the assumption that iso-correlation surfaces have an elliptical shape.It allows to relate the cross correlation obtained for a certainΔtand a poloidal distance s with the time lag τ, obtained from the ACF for the maximum in the CCF. In this model the propagation velocity is given as:
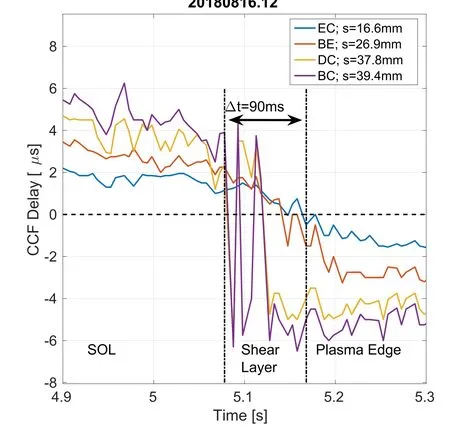
Figure 1. Evolution of the delay times in the vicinity of the shear layer for different antennae combinations as a function of time.Larger poloidal distances show an earlier flip in the delays compared to shorter ones.

Figure 2.Widths of auto- and cross correlation function for two antennae combination and corresponding delay for 3.24 s ≤ t ≤3.98 s. Note the strong increase in the CCF width in the shear layer.

From equation(1)it is seen that the real drift velocity is close to the apparent velocity va= s/Δt when ≪τΔt. The difference between apparent and real drift velocity is that the apparent velocity assumes a propagation in the direction of the two reflection points.In the shear layer and the SOL breaking up of field lines and tearing up of eddies causes a mismatch between the real drift direction and direction of reflection points, which are taken into account by the elliptical model.
For each analyzed time which is the hopping step width equation (1) yields six values for v⊥according to the six antenna combinations. In figure 3 the apparent velocity from the linear regression of the cross correlation delays and the real drift velocity using equation(1)are compared during one frequency scan of the reflectometer. It can be seen that the estimation of v⊥in the shear region is smoother compared to the linear regression analysis.Also away from the shear layer the values of both methods are close to each other again.
To obtain the poloidal distance on a certain flux surface defined by a certain cut-off density ncthe density profile from Thomson scattering (TS) diagnostic [18, 19] is used. In contrast to a tokamak,a stellarator has no toroidal symmetry.PCR and TS are located at different toroidal positions.Therefore, the effective radiusreffis used for mapping inside the LCFS.Outside the LCFS the distance of the outermost TS channels with respect to the last one inside the LCFS is added.This procedure is justified for the position of the TS diagnostic, but, it is not appropriate to map the density profile to the position of the PCR because of the absence of field lines having constant density and connecting both toroidally separated positions of TS and PCR in the SOL.The mapping becomes furthermore difficult due to the fact that the sight lines of the PCR system and the Thomson scattering diagnostic intersect the edge island, differently. Whereas, in the standard configuration the TS line of sight is close to the X-point of the 5/5-island, the PCR line of sight is located closer to the O-point of the 5/5-island. In that sense density profiles outside the LCFS are supposed to be different. Furthermore, variations in the island size by control coil settings will have a larger effect on the PCR measurement location than on the location of the TS measurement.For this reason a mapping of the density profile to the PCR measurement location is not straightforward and the v⊥-profiles are shown as function of the cut-off density (nc), only.

Figure 3.Comparison of apparent and real v⊥during one frequency scan. The transition in the shear layer is no longer fluctuating and real v⊥is quite close to the apparent one.
3. Observations at the shear layer
In this section the response of the shear layer is studied for different actuators. First the effect of internal plasma current and external control coil current is studied for the standard configuration (ι=1). Thereafter different magnetic configurations are studied as well as the effect of the heating power(PECH).In the last part the turbulence suppression at the shear layer for one case is studied in more detail.
3.1. Effect of plasma- and control coil current
The above described method is applied first for the standard configuration of W7-X which is characterized by an edge iota(ι=1) and has a 5/5 island chain in the SOL.

Figure 4.Overview of Icc-scan. (a) PECH and Pr ad; (b) line averaged density; (c) plasma and control coil current. Note the latter has an offset of5 kA for better comparison with Ip.PE CH, Pr ad, ne and Ip are shown for 20180816.18, only for clearness.


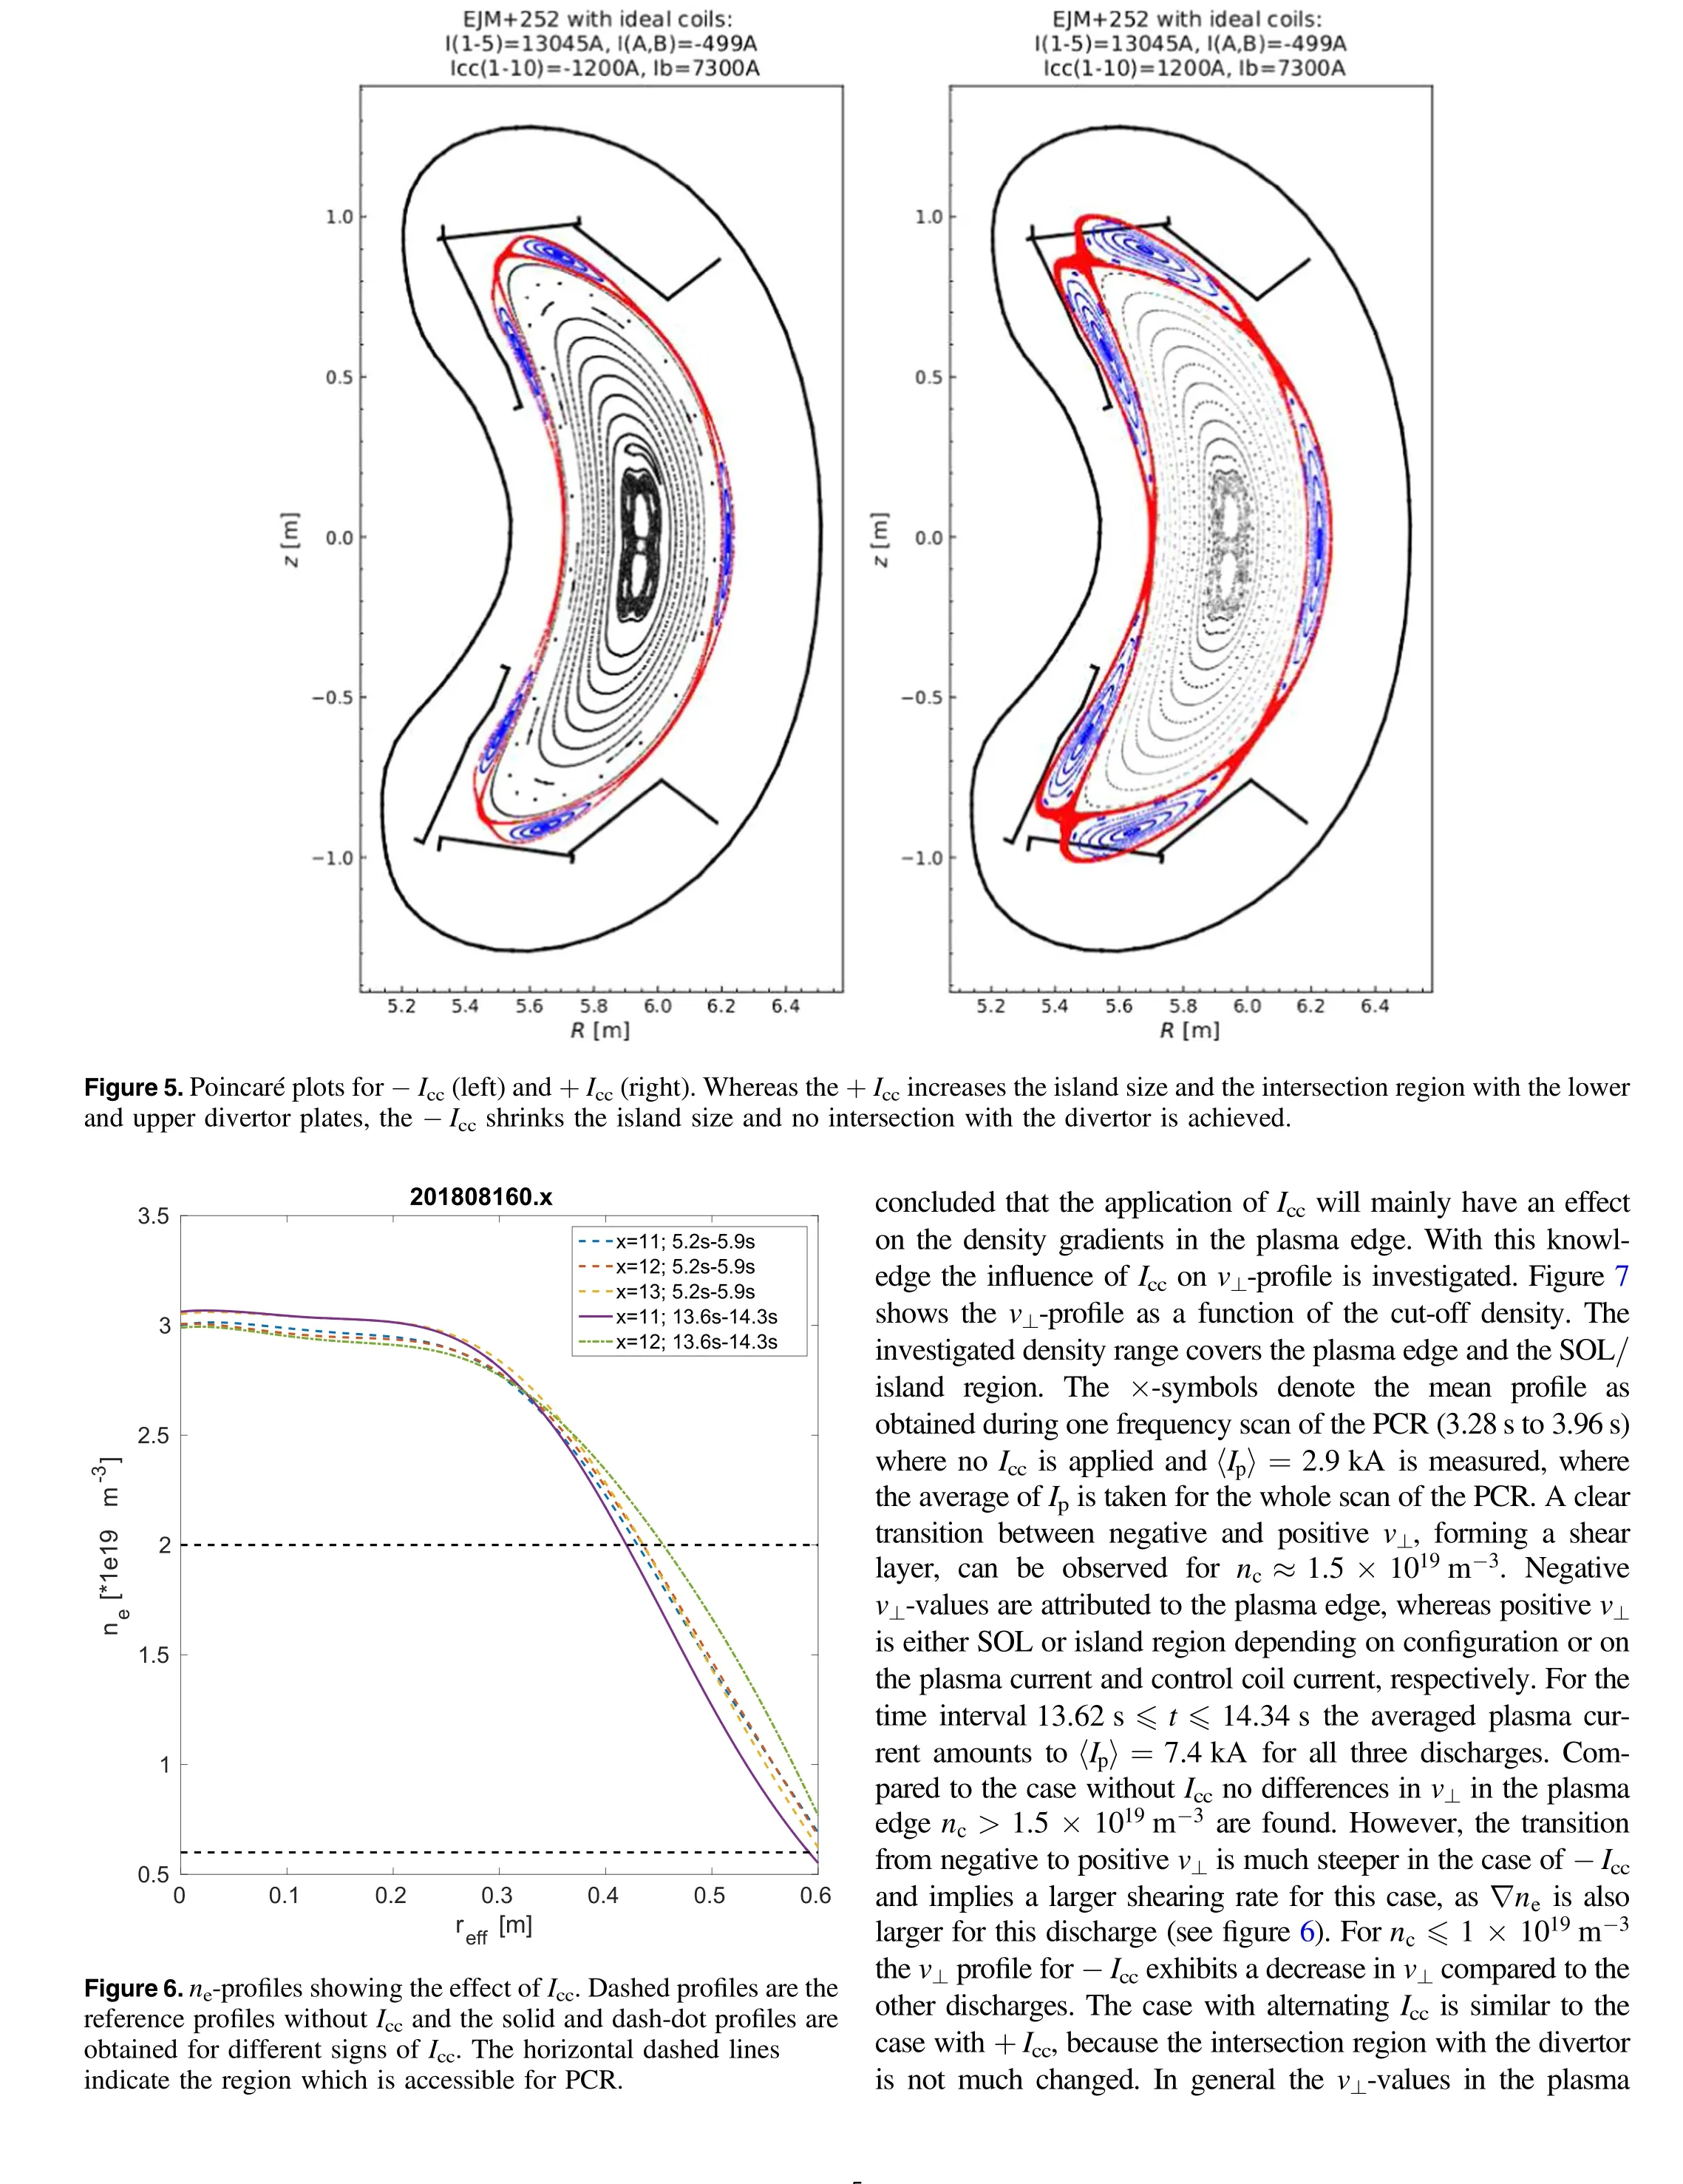

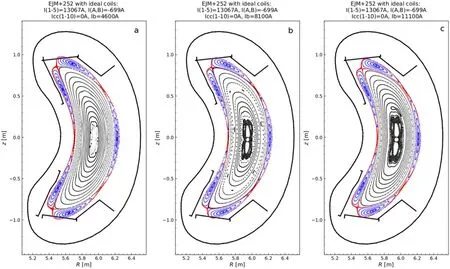
Figure 8.Poincaré plots for (a)4.6 kA, (b)8.1 kA and (c)11.1 kA. Note the inward movement of the island and that for ≥Ip 8.1 kA the island no longer interacts with the divertor.

Figure 9.ne-profiles for different values of Ip.Dashed lines highlight the measurement range. Note that the density gradient in this range does not change much for all profiles.

Figure 10.v⊥-profile for 20180816.19.The different profiles indicate the effect plasma current on v⊥. After a steepening of the transition to the SOL,a further increase in Ip shifts the transition to higher cut off densities.

Figure 11.ne-profiles for Ip-and PECH-levels.Dashed lines show the accessible reflectometry range and the outward shift of the profiles with increased power level.The dotted indicates the change in the ne when the PECH is changed.

Figure 12.v⊥-profile for the standard configuration and different PECH levels.A clear shift of the transition from plasma edge to SOL towards smaller densities is observed with increasing PECH.
The same analysis is done in low iota discharges. Here,the variation in Ipis smaller and does not contribute. The ne-profiles (see figure 13) show an increase of the central density with PECH. Therefore, in the radial range of the observations the density gradient as well as the absolute density are varying. The corresponding v⊥-profiles as a function of ncare shown in figure 14. The shear layer shifts towards lower ncwith increasing PECHin agreement with the decreased density in the profiles and in addition the transition itself becomes more narrow. This is different to the standard configuration. The reason for this observation may be the different sight lines of the reflectometry with respect to the limiting island chain.In the case of the standard configuration the PCR is passing the island0.1 m below the O-point,whereas in the low iota case the PCR is passing more close to the X-point of the island. In the latter case the shear layer is not influenced by the island and can move more outward.Again as in the standard configuration there is no change in v⊥with PECHfound for the SOL and the behavior of the v⊥-profiles in the plasma edge suggests that there is also no change in v⊥as a function of PECHis expected.Furthermore,in this configuration v⊥in the SOL is from 0.4 km s-1to 1.3 km s-1, significantly smaller than in the standard configuration.In the plasma edge v⊥seems to be independent from the configuration and the power level and values in the range of 3 km s-1to -5 km s-1are found.
3.3. Turbulence suppression

Figure 14.v⊥-profile for the low iota configuration and different PECH levels.A clear steepening of the shear layer and a shift towards smaller densities is observed.
In the last part of this section the behavior of the coherence spectra during the transition from the plasma edge to the island divertor is studied.The LCFS is a narrow radial region where(i) the connection length decreases abruptly and the propagation velocity changes sign. The LCFS acts as a barrier for turbulent transport due to the velocity shear.It is assumed that the low wave number (k) turbulence decreases at the shear layer.A measure for the decrease of the low-k turbulence is the shearing rate (ω′ = ∂v⊥∂r). In case the turbulence de-correlation time (τdc) exceeds the inverse shearing rate it will be effectively suppressed. The PCR diagnostic is in general sensitive to low-k turbulence up tok≈ 3 cm-1[22]. The measured coherence spectra of all combinations can be analyzed and frequency regions can be identified where the coherence drops when approaching the shear layer.As a first example the coherence spectra for the discharge 20171109.56 are analyzed for the antenna combination DE. In figure 15 the v⊥-profile is shown as function of the cut-off density.This discharge shows again a remnant island in the density range of 0.8×10¹⁹m-3to 1.0×10¹⁹m-3. Towards lower cut-off densities, in the far SOL, the rotation decreases to 1.2 kms-1. The shear layer is found for a density range of 1.35×10¹⁹m-3to 1.70×10¹⁹m-3. In this range the velocity decreases fromv⊥=3.1 kms-1tov⊥= -4.2 kms-1. For five different positions,marked by colored×-symbols,the coherence spectra for the antenna combination DE are estimated and shown in figure 16 where the same color code is used for the spectra as for the ×-symbols in figure 15. The combination DE is used because the distance between the reflection points is large enough to ensure that only those turbulence contributions living long enough to be affected by the shear are taken into account. It is seen clearly that the coherence spectrum for a position inside the shear layer is broad and shows two quasi coherent modes at = ±f25 kHz [23]. For the other position inside the plasma edge a decrease of the spectral intensity is observed, but the quasi coherent peaks are still visible and change its frequency a bit. The most obvious change in the spectra happens inside the shear layer. The spectra become more narrow and the intensity drops significantly across the whole frequency range.A more quantitative analysis has been done by decomposing the coherence spectra. In general three components can be identified(i)a broad band turbulence(BB)component, (ii) two quasi coherent (QC) modes with quite narrow width and (iii) a dc component. Each component has been approached by a Gaussian shape. The whole spectrum can be described as:

Figure 15.v⊥-profile for 20171109.56 showing the shear layer and the remnant island in the SOL. Colored×symbols denote the position at which the coherence spectra are calculated.

Figure 16.Coherence spectra for positions from figure 15. A clear decrease in the broad band turbulence is seen when passing the shear layer.

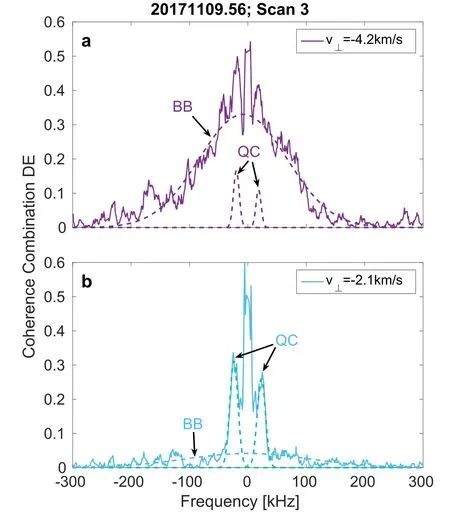
Figure 17.Decomposition of two spectra into quasi coherent and broad band turbulence(dashed lines).Each spectrum has one central broad band turbulence component and two quasi coherent components.In the spectrum which is obtained in the shear layer the broad band turbulence vanishes completely and the quasi coherent mode is left, only.
where Aidenotes the amplitude of the component,fithe center frequency andσithe half width of the component.As shown in figure 17 for the two extreme cases from figure 16 the measured spectra can be nicely described by the sum of Gaussian functions. For each spectra the Gaussian components (dashed lines) are shown, except the dc component. Whereas the spectrum in the plasma edge has a strong broad band component (see figure 17(a)) it is missing completely in the shear layer(figure 17(b)).The quasi coherent modes components are shown as well.
The decrease of the BB-turbulence in the spectra is quantified by calculating ∫FBBdfin the frequency range 300 kHz ≤f≤-300 kHz, whereFBBdenotes the Gaussian describing the BB-turbulence. Summing up the experimental spectrum in the same frequency range allows us to compare the BB-turbulence in different spectra. Whereas the BB-turbulence contributes with ≈75% to the spectra in the plasma edge it reduces to ≈20%in the shear layer. It is clearly seen that in figure 17(b) the width of the BB-component is increased a lot and describes more the background in the spectrum. This has to be considered when comparing the contribution of BB-turbulence in the shear layer.In contrast to the BB-turbulence the quasi coherent modes do not undergo a strong change in amplitude. This decrease of the broadband turbulence can be taken as evidence for the suppression of low-k broad band turbulence in the shear layer.
4. Summary
During the inertial cooled divertor operation campaigns at W7-X a correlation reflectometer has been used to measure v⊥-profiles in the plasma edge and the island divertor.For the correct calculation of v⊥in the region of strong velocity shear at the transition from closed to open field lines an elliptical model has been applied. It takes into account the strongly changing width of the cross correlation function in the shear layer and avoids strong non-physical fluctuations of v⊥. This model has been used during the investigation described in this paper. It could be demonstrated that a correlation reflectometer can clearly identify the transition from the plasma edge to the island divertor/SOL. It is an appropriate tool for the investigation and determination of the shear layer and the last closed flux surface.
A set of discharges with an edge iota of ι=1 is investigated where control coils are used to manipulate the island chain.The application of control coils modifies the island size and position, whereas the toroidal plasma current shifts the island chain towards the magnetic axis. Both effects reduce the interaction of the island with the divertor and the interaction even vanishes for certain conditions. The effect on the v⊥-profiles has been studied.For cases where the island is not intersected by the divertor plates the transition from negative v⊥(plasma edge)to positive(island region)in the v⊥-profiles is steep. It can be well distinguished from cases where the island is intersecting the divertor and is much smoother. In none of the investigated discharges does the v⊥-profile inside the LCFS undergo any change.
The shear layer is also subject to changes of the magnetic configuration (ι=1 and ι=0.81). With the change of the magnetic configuration the island chain at the LCFS will change from 5/5 to 5/6 and causes shift from the island O-to the X-point in the line of sight of the correlation reflectometer.A movement of the shear layer is observed when the line of sight is closer to the X-point. In both configurations, the v⊥-profile yields the same values inside the plasma edge independent from the power level. Also outside in the SOL the values do not change. However, in the low iota configuration the values outside of the LCFS are a factor of ≈4 smaller than in the standard configuration.
The coherence spectra are investigated in the shear layer.A significant narrowing of the spectra is observed. Using a decomposition method based on Gaussian functions the spectra are analyzed. It was found that the broad band turbulence shows a significant decrease in the amplitude in the shear layer.Since the PCR diagnostic is sensitive to low wave number turbulence,the decrease of the broad band turbulence amplitude is consistent with the assumption of a suppression of low-k turbulence in the shear layer.
Acknowledgments
This work has been carried out within the framework of the EUROfusion Consortium and has received funding from the Euratom research and training program 2014–2018 and 2019–2020 under grant agreement no.633053.The views and opinions expressed herein do not necessarily reflect those of the European Commission.
 Plasma Science and Technology2020年6期
- Plasma Science and Technology的其它文章
- First-principles study on the mechanical properties and thermodynamic properties of Mo–Ta alloys
- Formation mechanism of Al2O3/MoS2 nanocomposite coating by plasma electrolytic oxidation (PEO)
- Estimation of the sheath power dissipation induced by ion cyclotron resonance heating
- Influence of toroidal rotation on the tearing mode in tokamak plasmas
- Conversion between Vickers hardness and nanohardness by correcting projected area with sink-in and pile-up effects
- In-port-plug transmission line design of the ITER plasma position reflectometer
