Conversion between Vickers hardness and nanohardness by correcting projected area with sink-in and pile-up effects
Youping LU(鲁又萍),Yue SU(苏悦),Wei GE(葛伟),Tengfei YANG(杨腾飞),Zhanfeng YAN(闫占峰),Yugang WANG(王宇钢) and Songqin XIA(夏松钦),3
1 State Key Laboratory of Nuclear Physics and Technology, Center for Applied Physics and Technology,Peking University, Beijing 100871, People’s Republic of China
2 College of Materials Science and Engineering,Hunan University,Changsha 410082,People’s Republic of China
Abstract The Vickers hardness test has been widely used for neutron-irradiated materials and nanoindentation for ion-irradiated materials. Comparing the Vickers hardness and nanohardness of the same materials quantitatively and establishing a correlation between them is meaningful. In this study, five representative materials—pure titanium (Ti), nickel (Ni),tungsten (W), 304 coarse-grained stainless steel (CG-SS) and 304 nanocrystalline austenitic stainless steel (NG-SS)—are investigated for comparison. The results show that the relationship between Vickers hardness and nanohardness does not conform to a mathematical geometric relationship because of sink-in and pile-up effects confirmed by finite element analysis(FEA)and the results of optical microscopy.Finally,one new method was developed by excluding the effects of sink-in and pile-up in materials. With this improved correction in the projected area of the Vickers hardness and nanohardness, the two kinds of hardness become identical.
Keywords: Vickers hardness, nanohardness, conversion(Some figures may appear in colour only in the online journal)
1. Introduction
In a nuclear reactor, the materials, especially structural materials,suffer strong neutron irradiation,which will induce microstructural damage and degrade performance. For fusion reactor materials (FRM), the irradiation space is very limited in future accelerator-based irradiation facilities, for example,the International Fusion Materials Irradiation Facility(IFMIF). So, small specimens of FRM, which can take advantage of the limited irradiation space and lower the radiological dose from activated materials, will be processed by post-irradiation examination,even when they are irradiated with fission reactors [1]. As part of these examination methods, the Vickers hardness test, which is a test of microhardness, is an efficient way to measure the hardness of neutronirradiated small specimens of fusion structural materials. For example, in the hot cell of Karlsruhe Fusion Materials Laboratory, the Vickers hardness of materials irradiated by neutrons was tested using the commercial machine Zwick Z2.5[2].The load applied to measure the Vickers hardness of a small bulk specimen is usually 100–300 gf.
Due to the long experimental period, as well as limited availability of neutron sources, the high cost and the radioactivity of irradiated specimens, ion irradiation has been widely used to emulate neutron irradiation in order to study the effects of irradiation on materials[3–5].However,the region of ion irradiation-induced damage is usually nonuniform and shallow [6] (several hundred nanometers to several micrometers). Thus, Vickers hardness measurement is not suitable for ion-irradiated specimens in these circumstances. Another hardness testing method is nanoindentation, which has been most widely applied to study the mechanical properties of ion-irradiated materials recently[7–9].Nanoindentation can reflect the mechanical properties of materials at very shallow depths as well as at several micrometers.
As we all know, radiation damage causes changes in microstructures. It can lead to hardening or softening of materials. For both, we can measure hardness to study the behavior.The indentation size effect(ISE)exists in both the Vickers hardness test and nanoindentation. The hardness will get smaller when the depth increases. If we find a correlation between nanohardness and Vickers hardness, we can extrapolate the nanohardness under a small load to a larger load and then get the corresponding Vickers hardness at a specific load. That can enable us to compare the hardness of ion-irradiated and neutron-irradiated materials quantitatively. Naturally, in terms of comparing the mechanical properties of neutron-irradiated specimens and ion-irradiated specimens precisely, one of the intriguing questions is to figure out the relationship between Vickers hardness and nanohardness.
For ion-irradiated materials, many studies on nanoindentation have been reported. Computational methods were established to solve the reverse problem of evaluating material properties, such as yield strength, hardening exponent and elastic modulus [10, 11]. Some studies have focused on extracting a hardness–depth profile [12–14] or the depthdependent yield strength [15] from ion-irradiated materials.Theoretical models were developed to explain the hardness–depth profile of ion-irradiated materials obtained from nanoindentation [16, 17].
Nevertheless,there are few studies on the basic question of the conversion between nanohardness and Vickers hardness. Qian et al reported that nanohardness is 10%–30%larger than microhardness because nanoindentation uses projected area rather than residual area [18]. However, the microhardness obtained below 200 mN by using Berkovich nanoindentations shows an abnormal relationship with nanohardness. A linear relationship was reported by Yang et al and the coefficient was determined to be ±81.0 10.5,i.e.,Hv0= 81.0 ±10.5Hnano_0[19], whereHv0andHnano_0are Vickers hardness and nanohardness calculated by using the Nix–Gao model, respectively. Ding et al studied the nanohardness and Vickers hardness of ion-irradiated oxide dispersed strengthened (ODS) ferritic steels and found that the hardening tested by two methods corresponded well by combining with the Nix–Gao model [20]. However, the hardness derived from the Nix–Gao model depends significantly on the range of data used for fitting, and the standard deviation of the coefficient in Ding’s study is quite large.Moreover,Fischer-Cripps has already pointed out that HV=94.5H,where HV is Vickers hardness and H is Meyer hardness [21]. Then, HV=94.5HN, according to Fischer-Cripps, where HN is nanohardness. Nevertheless, the data from experiments usually do not match this relationship well. The relationship between nanohardness and Vickers hardness still needs further investigation.
In our work, the hardness of five materials—three pure metals and two steels—was measured using the Vickers hardness test and nanoindentation. By converting Vickers hardness to nanohardness with the mathematical geometric relationship,they became comparable and close in magnitude.Furthermore, by investigating the indentations of the two hardness tests more carefully, the projected area of each indentation was corrected,which makes the values of Vickers hardness and nanohardness identical.
2. Materials and methods
2.1. Materials
The materials were chosen according to their yield strengths and hardness, and were polycrystalline tungsten (W), polycrystalline nickel (Ni), polycrystalline titanium (Ti), 304 nanocrystalline austenitic stainless steel (NG-SS) which was synthesized by mechanical alloying(Yanshan University)and 304 coarse-grained stainless steel (CG-SS). To prepare the materials for hardness tests, they were cut to a size of 5 mm×5 mm×1 mm and polished with diamond paste with a particle size down to 0.2 μm.The polished specimens were washed with ethanol and acetone.
2.2. Nanohardness test
Nanohardness tests were carried out using Keysight Nano Indenter G200 at Peking University. The nanohardness was measured by a basic method with a Berkovich tip and with a Vickers tip,and six loads—98 mN,245 mN,490 mN,980 mN,1960 mN and 2940 mN—were applied in the experiments.Average hardness was obtained from six indentations for each load and for both tips.The separation between indentations is 10 times their size.
2.3. Vickers hardness test
Vickers hardness tests were carried out using Leica VMHT 30M at University of Science and Technology Beijing. The applied loads are identical to those for nanohardness.Average hardness was obtained from six indentations for each load.
2.4. Optical microscopy
Photos of indentations produced by nanoindentation and Vickers hardness tests were taken by using the optical microscopy system equipped on VMHT 30M. The sizes of indentations were measured by using the system-provided software.

Figure 1.Indentation parameters for (a) Vickers and (b) Berkovich tips.
2.5. Compression test
To obtain the mechanical parameters of materials for finite element modeling (FEM), compression tests were performed on an electronic universal testing machine CTM-4305. The compression rate was 0.25 mm min−1and the compression lasted until the specimen broke.
2.6. Finite element modeling
A two-dimensional model was established by using Abaqus to simulate the nanoindentation test. The equivalent cone angle of the Berkovich tip is 70.32°. The maximum load is 50 gf.The loading time,holding time and unloading time are 15 s, 10 s and 15 s respectively.
3. Results and discussions
A schematic of Vickers and Berkovich tips is shown in figure 1. In terms of nanohardness, the hardness tested by using a Vickers tip and a Berkovich tip can be described by

whereθvandθbare the angles between the center line and the surfaces of a Vickers tip and a Berkovich tip,respectively.hcis the contact depth, and P is the applied load. HN(BT) and HN(VT) represent the nanohardness measured by using the Berkovich tip and the Vickers tip respectively. Therefore,HN(VT) and HN(BT) are identical.
Comparing Vickers hardness with nanohardness, the hardness can be described as

where d is the diagonal length of an indentation, and we can get


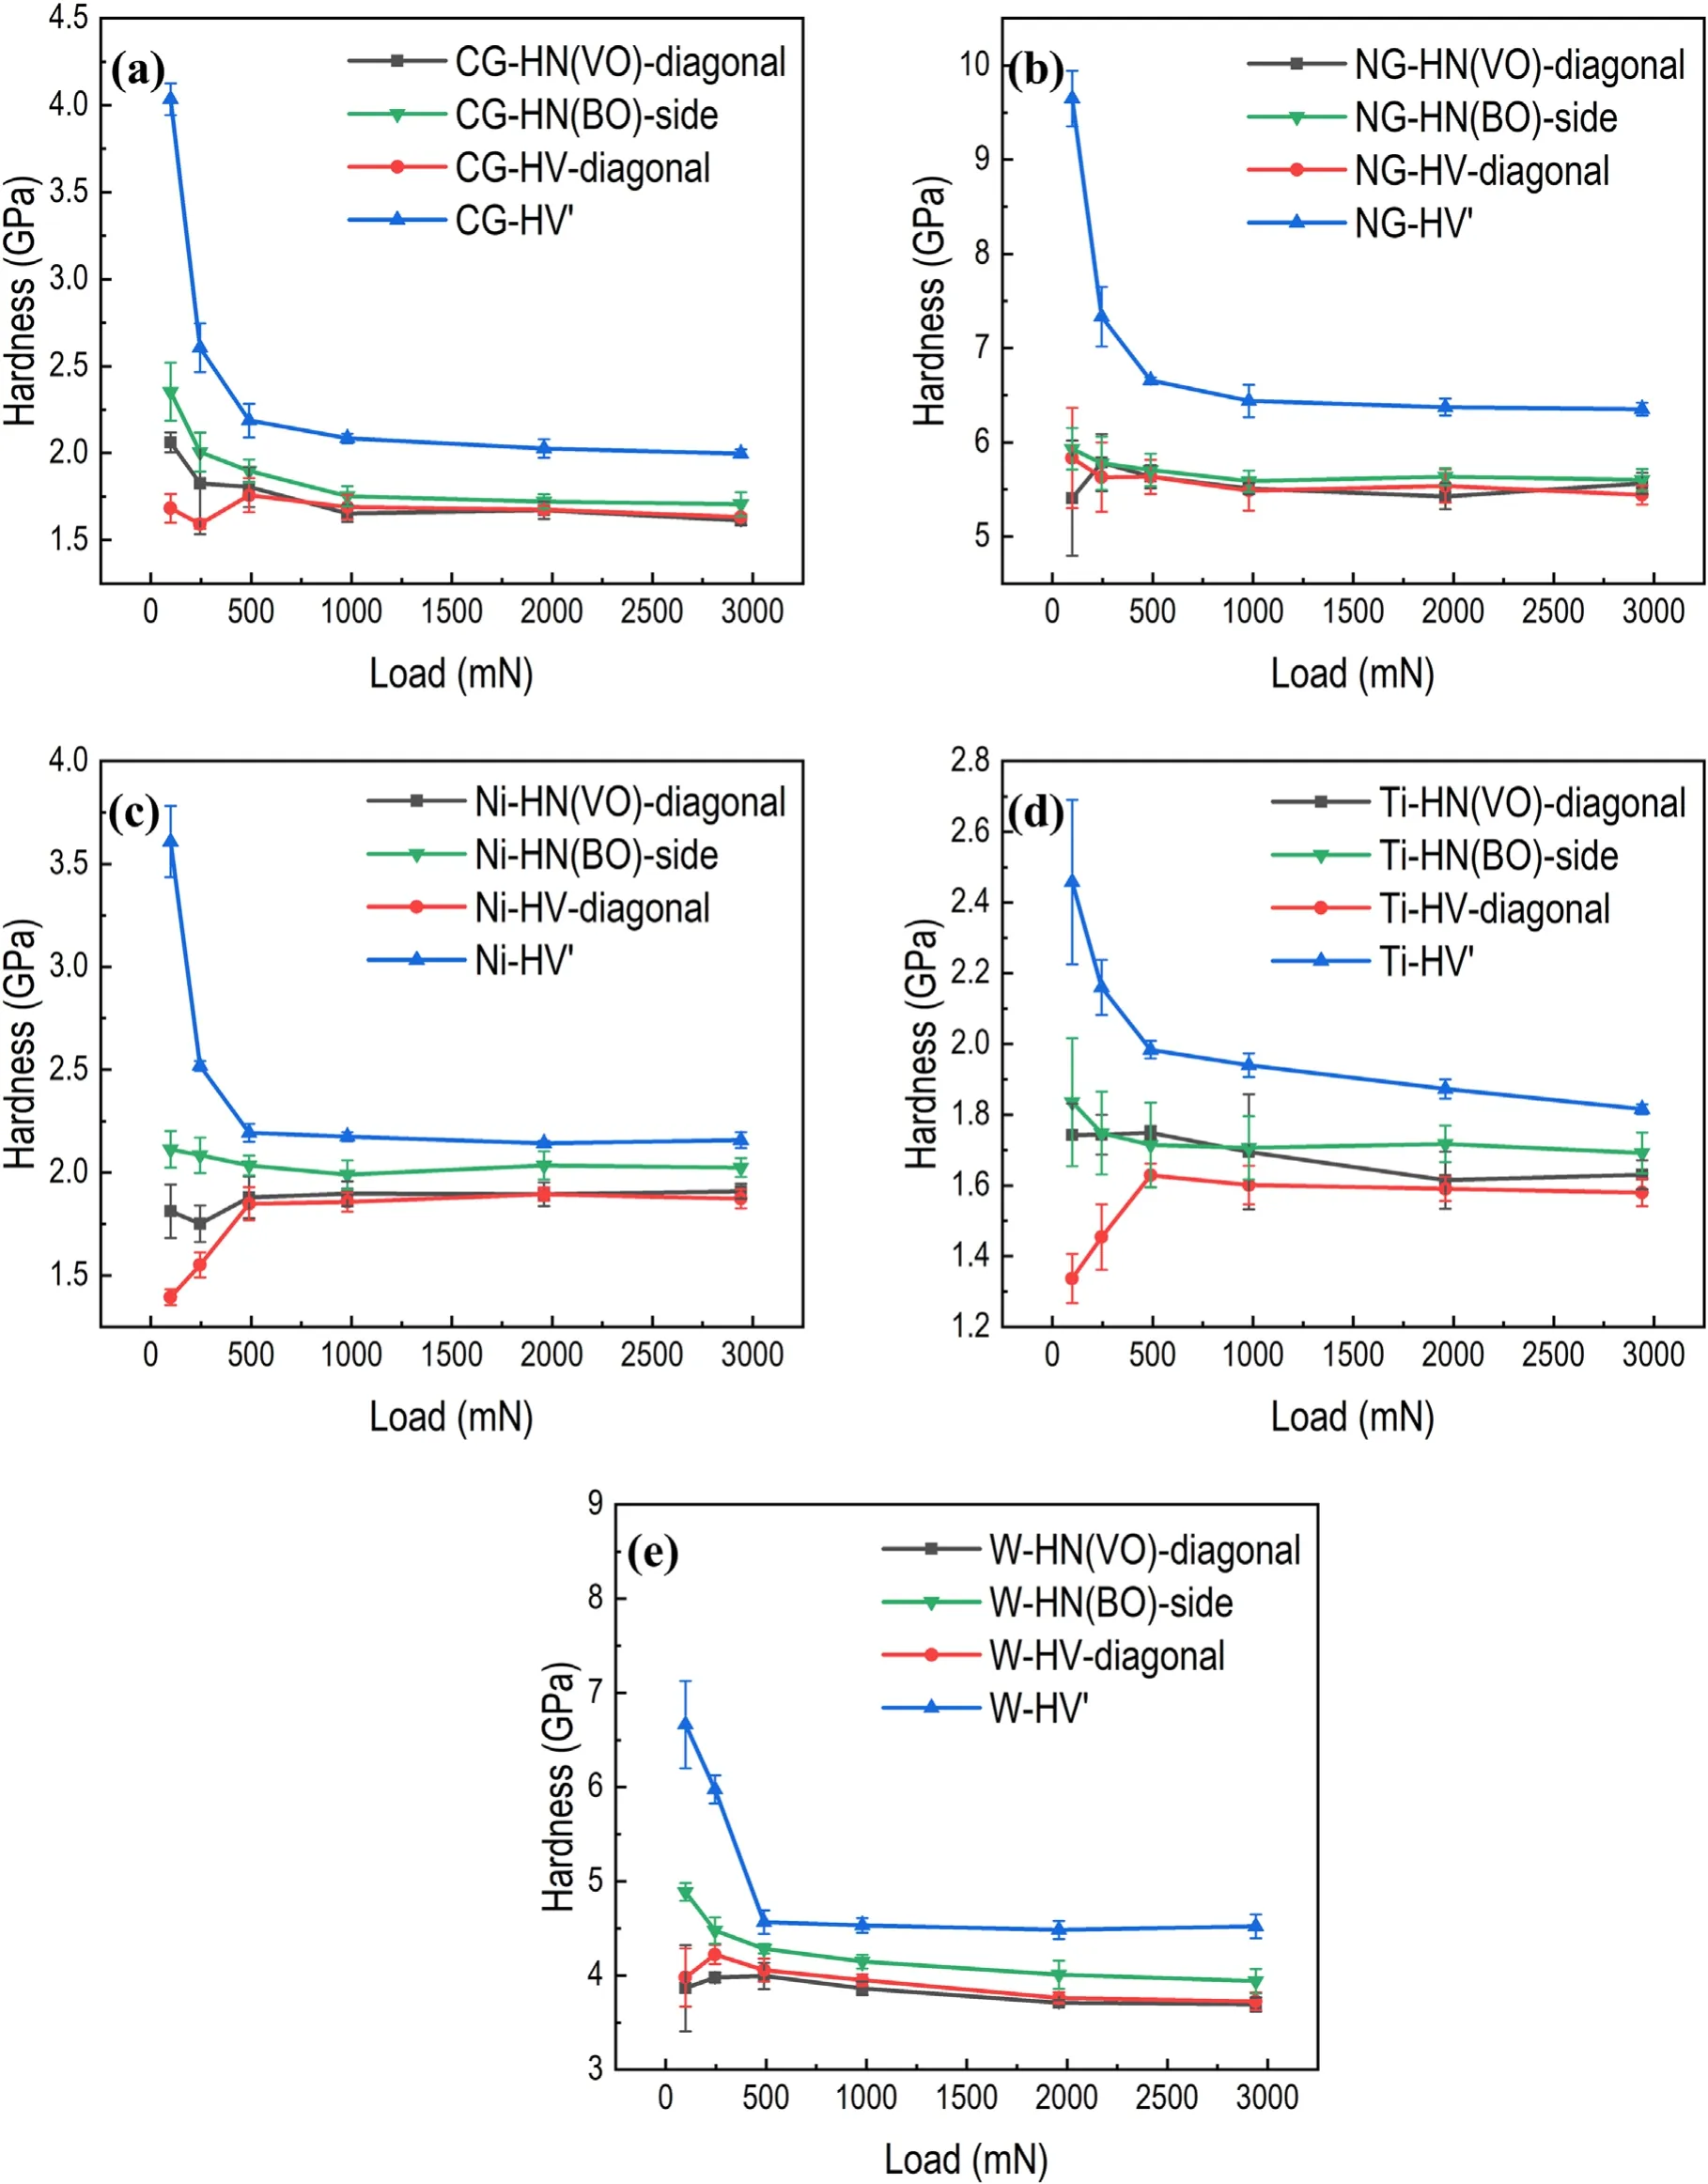
Figure 2. Nanohardness of Berkovich and Vickers tips (HN(BT), HN(VT)) and Vickers hardness converted by using the relationshipHV=94.5HN (HV′) of (a) CG-SS, (b) NG-SS, (c) Ni, (d) Ti and (e) W.
The unit of Vickers hardness HV in the above formula is kgf mm–2, and the unit of nanohardness is MPa. Hence,

in which the unit ofHVis kgf mm–2,and the hardness unit ofHNis GPa.It is worth noting that this equation(4)is derived from the ideal situation.
Nanoindentation (basic method, Berkovich tip and Vickers tip) and Vickers hardness tests were performed on five kinds of materials: W, Ni, Ti, NG-SS and CG-SS. HV

Figure 3. Photographs of indents. CG-SS exhibited a little bit of sink-in and other materials piled up.
was converted to HN using the relationship HV=94.5HN and represented as HV′.The results are shown in figure 2.The ISE is obvious in the data from the Vickers hardness test,while a weak ISE can be seen from nanohardness.The ISE is related to the surface effect, the strain gradient effects, the friction between the indenter and the specimen and so on[22].The preparation of a surface free from mechanical damage[23], the process of analyzing data or an initial dislocation in the crystal can be the reason for the difference of ISE [24].Here, the difference of ISE is mainly ascribed to three reasons. First of all, the methods for obtaining data are quite different. The Vickers hardness was obtained by observing the indents after loading. However, the nanohardness was obtained through a static depth-sensing method. Contact depth was calculated from the Oliver–Pharr method. Once contact depth is known, the projected area and hardness canbe calculated. Secondly, artificial analysis of the image leads to errors when obtaining Vickers hardness, and pile-up or sink-in behavior affects the results of nanoindentation significantly,especially under a low load condition.Thirdly,the crystals indented in the two kinds of tests were different though on the same specimen. Subtle differences in an initial dislocation could influence the ISE.

Table 1. Parameters of materials.

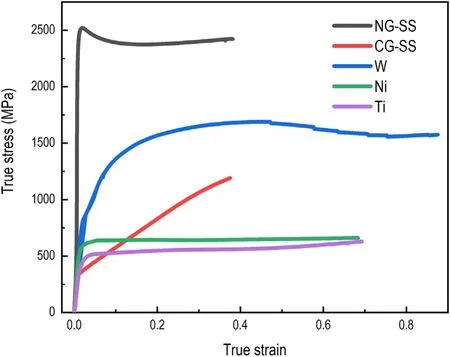
Figure 4. The true stress–true strain curves of five materials.
For all of the five materials mentioned in this paper,nanohardness is larger than HV′and HN(VT)is greater than HN(BT). These results are in line with the report from Qian et al[18].According to that report,microhardness should be equal to nanohardness if no sink-in or pile-up behavior occurs;moreover,under ideal conditions, the nanohardness values measured by Vickers and by Berkovich tips are expected to be the same.However, it was found that sink-in or pile-up occurred in all materials measured in the present experiment. CG-SS exhibited a little bit of sink-in while other materials showed pile-up.Images of representative indentations are shown in figure 3.The more heavily the indentation piles up or sinks in, the larger the error of nanohardness [18]. Pile-up or sink-in can lead to overestimation of nanohardness.So,nanohardness is larger than HV′.Indenters of different geometries can cause various equivalent plastic strain distributions in the indentation process[25].Thus,when sink-in or pile-up occurs, the hardness values obtained from nanoindentation using Berkovich and Vickers tips could be different, and Vickers tips seem to cause heavier pile-up than Berkovich tips.The pile-up behavior of NG-SS is more obvious when indented by a Vickers tip than by a Berkovich tip, as shown in figure 3. Correspondingly for NG-SS, the hardness value and error bars of HN(VT)are larger than those of HN(BT),as shown in figure 2(b).A lot of factors,such as yield strength,Young’s modulus, strain hardening exponent and friction coefficient, can influence the results of pile-up and sink-in [26–28].Xu et al reported that caution should be exercised when using the Oliver–Pharr method to estimate the area of an indentation on elastic–plastic materials[27].Kim et al carried out 140 finite element simulations of nanoindentation with different combinations of Young’s modulus,yield strength and strain hardening exponent n and found that the residual indentation profile divided into scenarios of pile-up and sink-in at approximately n=0.3 [29].
The true stress–true strain curves of five materials in compression tests are shown in figure 4. Table 1 shows the parameters derived from the data of the compression tests,which imply that CG-SS sinks in and others pile up according to the strain hardening exponent n. R is the correlation coefficient when fitting n. These parameters obtained from the tests were used in FEM. A two-dimensional FEM model was established and its size was 100 μm×100 μm. The FEM model and the von Mises stress distribution after unloading are shown in figure 5. In the simulation, obvious pile-up behavior occurred in Ni, Ti and NG-SS.A little pile-up occurred in W and a little sink-in occurred in CG-SS. These results corresponded with the experimental phenomena observed by using optical microscopy. The profiles of indentations in simulation are shown in figure 6.
In order to make nanohardness and Vickers hardness comparable,a correction of projected area was made by using an optical microscope. The lengths of each side of indentations produced by the nanoindenter were also measured by the optical system equipped on the Vickers hardness tester,and the data were processed by using the software provided by the system. Then, the hardness is calculated according to the equation

where A is the projected area of an indentation.

Figure 5. The 2D FEM model and simulation results after unloading: (a) the partition of the model, (b) FEM mesh, (c) the von Mises distribution of CG-SS, (d) the von Mises distribution of NG-SS.

Figure 6. The profiles of indents on five materials after unloading.
There were two shapes of indentations produced during the indentation process. The indentation produced by a Berkovich tip is a triangle and that produced by a Vickers tip is a rectangle if there is no sink-in or pile-up in materials.
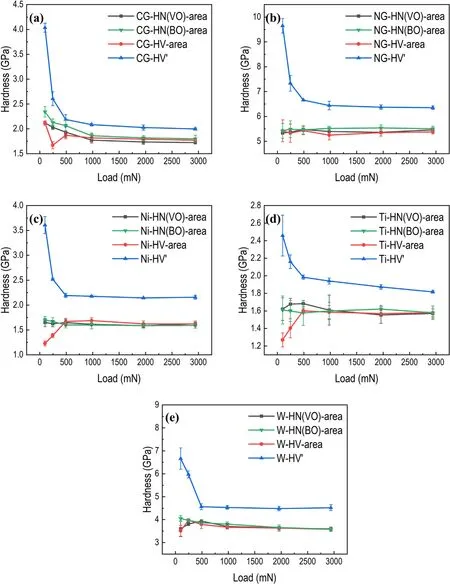
Figure 7 shows the recalculated results where HN(BO)and HN(VO) represent HN(BT) and HN(VT) examined by using the optical microscope. There is a trend that HV′ is greater than HN(BO) and HN(BO) is greater than HN(VO),but for CG-SS HN(BO) is approximated to HN(VO). For nickel, HN(BO) is approximated to HV′ when the load is larger than 490 mN.
It does not make sense that HV′is not equal to HN(VO)if hardness is measured by applying the same load and a tip with the same geometry.So careful examinations were carried out by calculating the projected area of each indentation. Two methods were used to calculate the projected area, as shown in figure 8. One is to measure the lengths of sides of Berkovich indentations or the diagonals of Vickers indentations,and the other is to measure the real projected area directly.Photographs of indentations were taken on the optical microscope and the lengths of the sides or diagonals could be measured by the system-provided software of the optical microscope. Then other software was used to obtain the lengths of the sides or diagonals in the form of the number of pixels. By comparing the number of pixels with the lengths given by the system-provided software, we could get a coefficient. In these experiments, the coefficient is 7.5. After examining all the photographs of indentations and transforming the pixels into lengths of sides and diagonals by using the coefficient,we could get the new projected area and hardness. The results of the two methods are exhibited in figures 9 and 10.

Figure 7.Nanohardness of Berkovich and Vickers tips corrected by using microscopy(HN(BO),HN(VO))and Vickers hardness converted by using the relationship HV=94.5HN (HV′) of (a) CG-SS, (b) NG-SS, (c) Ni, (d) Ti and (e) W.

Figure 8.Two methods of measuring pixels to measure the projected area of an indent of Ni under a load of 100 gf:(a)and(c)measuring the area, (b) and (d) measuring the lengths of sides or diagonals.
Basically, HN(i)-area, HN(BO)-area and HV′-area of five kinds of materials are identical when the load is larger than 490 mN,as shown in figure 10.When the load is small,surface effects and the heterogeneous distribution of grains would contribute to the variation in hardness. By measuring the projected area directly, measuring pixels seems to be a reliable way to get the hardness from nanoindentation and the Vickers hardness test, which unifies nanohardness and Vickers hardness eventually regardless of the shape of tips when the load is high enough. According to figure 10(b), we can see that the Vickers hardness corresponds well to the nanohardness of NG-SS under low load condition. Because the average grain size of NG-SS is less than 50 nm, the heterogeneous distribution of grains is not at the scale of the contact dimension.According to figure 9,HN(VO)-diagonal,HN(BO)-side and HV′-diagonal also correspond well when the load is greater than 490 mN, except for Ni and W, for which HN(BO)-side is slightly larger than HV′-diagonal. HN(VO)-diagonal and HV′-diagonal are the same in all aspects,such as the load and the geometry of indenter.It is natural that they correspond with each other well.The possible reason for the difference between HN(BO)-side and HV′-diagonal may be that the sink-in or pile-up behavior is different when different tips are applied.Sakharova et al reported that the region of maximum plastic strain in Berkovich indentation is just at the surface in the edge regions of the indentation, and that in Vickers indentation is located beneath the indentation surface as well as at the surface in the edge region of the indentation[25]. By measuring the size of indentations using lengths of sides or diagonals, the projected area of a Berkovich or Vickers indentation can be underestimated compared with measuring the area of indentations when pile-up occurs. So,measuring the area of indentations in pixels is the more reliable and direct test method.
The essence of nanoindentation and the Vickers hardness test is the same, and if the same definition and calculation method are used, the hardness values obtained from the nanoindentation and Vickers hardness test under the same conditions will be the same. Usually, Vickers hardness is obtained by observing the projected area using an optical microscope and nanohardness is obtained by calculating the projected area using a depth sensor. This leads to the difference in hardness values from the Vickers hardness test and nanoindentation. From the results above, it can be seen that the precision of the lengths measured with the optical microscope is not enough and the indentation is not a perfect triangle or rectangle because of sink-in or pile-up, which makes the correction by using an optical microscope or measuring the size of indentations using lengths or diagonals less accurate. Only by measuring the pixels to examine the real area of each indentation carefully can the Vickers hardness and nanohardness be in good agreement.

Figure 9.Results of measuring the projected area through lengths of sides or diagonals: (a) CG-SS, (b) NG-SS, (c) Ni, (d) Ti and (e) W.
4. Conclusion

Figure 10.Results of measuring the projected area directly: (a) CG-SS, (b) NG-SS, (c) Ni, (d) Ti and (e) W.
Hardness testing is an effective method for acquiring the mechanical properties of materials.To compare the hardness of neutron- and ion-irradiated materials, the correlation between Vickers hardness and nanohardness has been further studied.Five representative materials were chosen for comparison.We found that after converting HV into a value comparable to HN by HV=94.5HN, the relationship was not strictly followed.The sink-in and pile-up behaviors of the material influence the values of HN and HV′.Using an optical microscope to correct the projected area of indentations, HN and HV′ still differed from each other because of the precision of the system itself and the irregular shape of each indentation. To measure the projected area directly rather than the lengths of its diagonals and sides,a new correction method is established in this work,and results indicate that combining optical microscopy with measuring pixels is a good way to make HN and HV′identical,which can exclude the influence of sink-in and pile-up.
Acknowledgment
This work was financially supported by the National Magnetic Confinement Fusion Energy Research Project of China(No. 2015GB113000), National Natural Science Foundation of China (Nos. 11675005, 11935004), China Postdoctoral Science Foundation (No. 2018M641093) and the National Defense Nuclear Material Technology Innovation Center.The authors thank H Liu in Shanghai Jiao Tong University for helpful discussion.
 Plasma Science and Technology2020年6期
- Plasma Science and Technology的其它文章
- First-principles study on the mechanical properties and thermodynamic properties of Mo–Ta alloys
- Formation mechanism of Al2O3/MoS2 nanocomposite coating by plasma electrolytic oxidation (PEO)
- Estimation of the sheath power dissipation induced by ion cyclotron resonance heating
- Influence of toroidal rotation on the tearing mode in tokamak plasmas
- In-port-plug transmission line design of the ITER plasma position reflectometer
- Effects of the critical breakdown path on the ignition performance in heaterless hollow cathodes
