In-port-plug transmission line design of the ITER plasma position reflectometer
J MARTÍNEZ-FERNÁNDEZ , Á CAPPA, A SIMONETTO, T ESTRADA ,E DE LA LUNA and E J BLANCO
1 Laboratorio Nacional de Fusión. CIEMAT, Avda Complutense 40. Madrid 28040, Spain
2 CNR-ISTP, via Cozzi 53, 20125 Milano, Italy
Abstract This work describes the microwave design of the transmission line housed in the in-port-plug region of the ITER plasma position reflectometer(PPR).The design of the components of the inport-plug reflectometers (located in equatorial port-plug 10 (EPP10) and in upper-port-plug 01(UPP01))is presented.Using a 3D ray tracing code,the spatial position and optimum orientation angles of each set of emission and detection antennas were determined.A feasible path was then created from the obtained antenna positions and orientations to the primary vacuum window.Oversized tall waveguides were chosen to reduce ohmic losses. Due to space constraints in the ITER crowded environment, bends in oversized waveguides were unavoidable, and thus mode conversion was produced. To keep mode conversion losses at bay, hyperbolic secant curvature bends had to be used whenever possible. However, E-plane bends in tall waveguides proved to be especially critical, making it necessary to employ other approaches when higher bending angles were needed. Mode conversion results were obtained by evaluating the mode coupling equations. Ohmic losses have also been computed and their results compared with commercial simulators, obtaining a perfect agreement.
Keywords: reflectometry, microwave technology, ITER diagnostic(Some figures may appear in colour only in the online journal)
1. Introduction
The ITER plasma position reflectometer (PPR) diagnostic system is designed to provide information related to the edge electron density profile, at four defined locations distributed both poloidally and toroidally in the ITER vacuum vessel,known as gap 3, gap 4, gap 5 and gap 6, operating in the 15–75 GHz frequency range in O-mode.The antennas of gaps 4 and 6 are installed in-vessel,viewing the plasma through cutouts in the blanket modules, while those of gaps 3 and 5 are installed inside the port plugs EPP10 and UPP01,respectively,viewing the plasma through apertures in the diagnostic first wall. This document describes the work leading to the design of the waveguides connecting the gap 3 and 5 antennas to their correspondent interfaces in the primary vacuum window.Design and analysis of the transmission lines from the primary window (ex-vessel) are already presented in [1], while their structural analysis can be found in [2].
2. Antenna placement and orientation
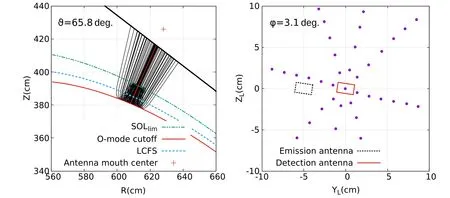
Starting from two selected ITER baseline scenarios(15 MA/5.3 T/ D-T and 7.5 /2.65 T/4He), the TRUBA code [3] has been used to perform ray tracing simulations for each frequency,which allows us to determine the optimum launching direction angles (ϑ, φ) for which the wave radiated by the emission antenna is reflected towards the center of the detection antenna,thus maximizing the wave coupling.As an example, figure 1 shows a projection of the simulated rays in the poloidal plane of the device(left panel)for gap 5 antennas with optimum launching angles at 75 GHz for the 15 MA scenario. For each frequency and scenario, the beam orientation is such that the rays reflected by the O-mode cut-off layer (red solid curve) are traced back until they reach the center of the detection antenna. In the right panel, the intersection of the reflected rays with the plane perpendicular to the launching direction and containing the center of both antenna mouths is shown together with a representation of the antennas’ apertures. The launching antenna direction angles are given in each panel’s upper left corner.

Figure 1.Side view (left) of ray tracing results at 75 GHz and for the 15 MA scenario and intersection of reflected rays with the detection antenna plane(right).The calculation has been performed using 8×8=64 rays.Frequency dependent optimum launching angles(ϑ and φ)ensure that the central part of the reflected beam reaches the detection antenna.

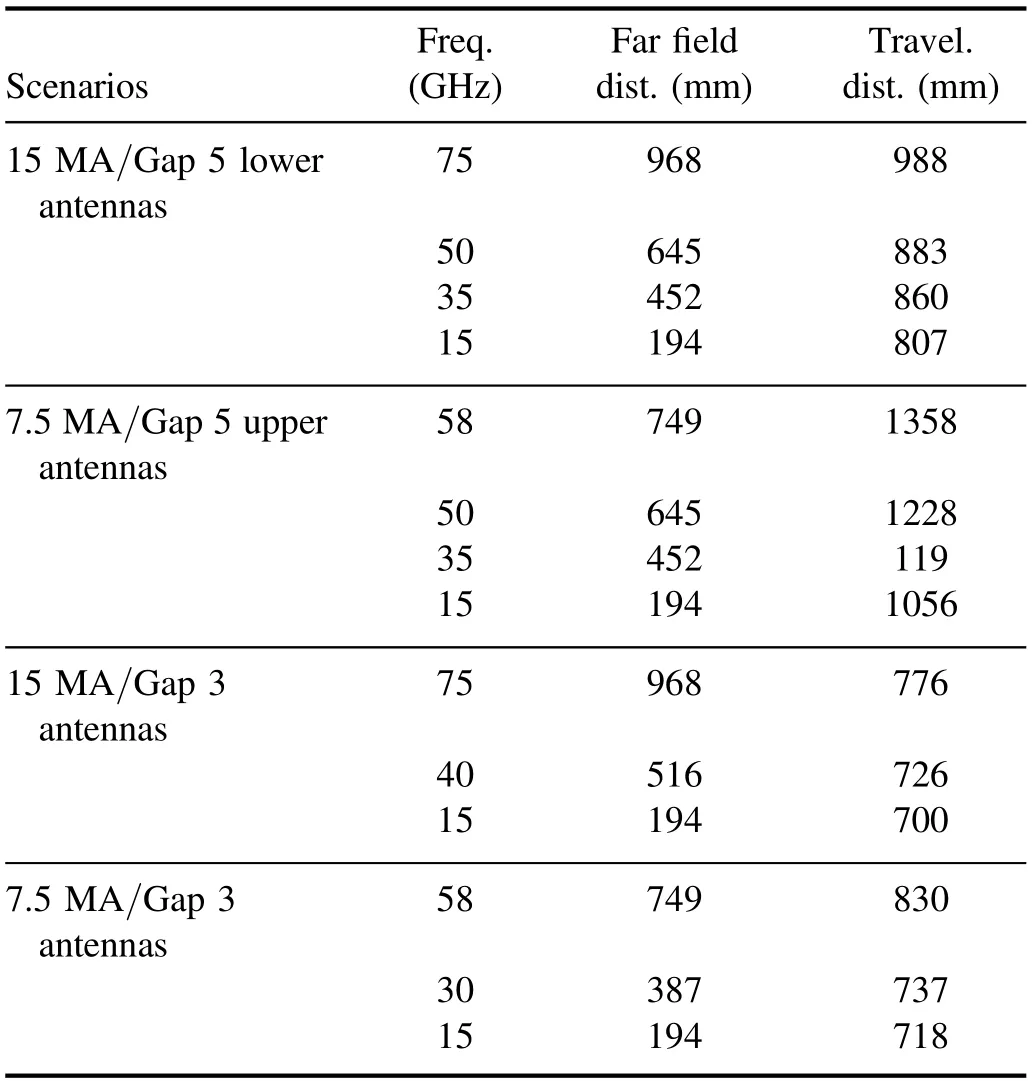
Table 1.Far field distances in the principal planes of a 44 mm×44 mm horn compared with traveling distances provided by ray tracing.

Figure 2.Power coupling(system gain)for the 15 MA scenario with gap 5 antennas.Low frequencies always show worse power coupling due to stronger beam diffraction.
As a result of these simulations, a matching set of optimum launching angles were found,depending on the scenario,the frequency and the antenna pair. Taking into account that the antennas would be fixed, the computed angles which produce direct reflection would move from the antennas’physical launching angles.Therefore,a global optimization was carried out to get the best physical orientation angles (ϑoptand φopt)and antenna dimensions. The objective of this optimization is to maximize the detected power in the worst case, namely the frequency and scenario combination with the worst coupling.In order to compute this coupling, radiation patterns of the antennas should be considered to account for the power drop out of the antenna maximum radiation direction. To alleviate the computational effort and make the global optimization possible, analytical expressions for the radiation pattern of symmetrical horns have been used together with the Friis transmission equation to get the power coupling [4] when the plasma is not present. These expressions require that the far field conditions are met [4], namely that the wave travelling distance is higher than the one at which the fields from an antenna are considered at far field. Table 1 compares the far field distances in the principal planes of the chosen 44 mm×44 mm horns with the wave traveling distances obtained by the ray tracing simulations for each angle and scenario.For these chosen antennas,only the gap 3 antennas in the 15 MA scenario at high frequency do not fulfill the far field condition(and even then maximum error can be delimited and taken into account). For all the remaining cases, the condition is fulfilled, and the analytical approximation is therefore valid for obtaining the power coupling between antennas. After the final optimum orientation angles are obtained,power coupling can be obtained for each scenario. As an example, figure 2 presents the power coupling of the system for the 15 MA scenario in the gap 5 antennas.

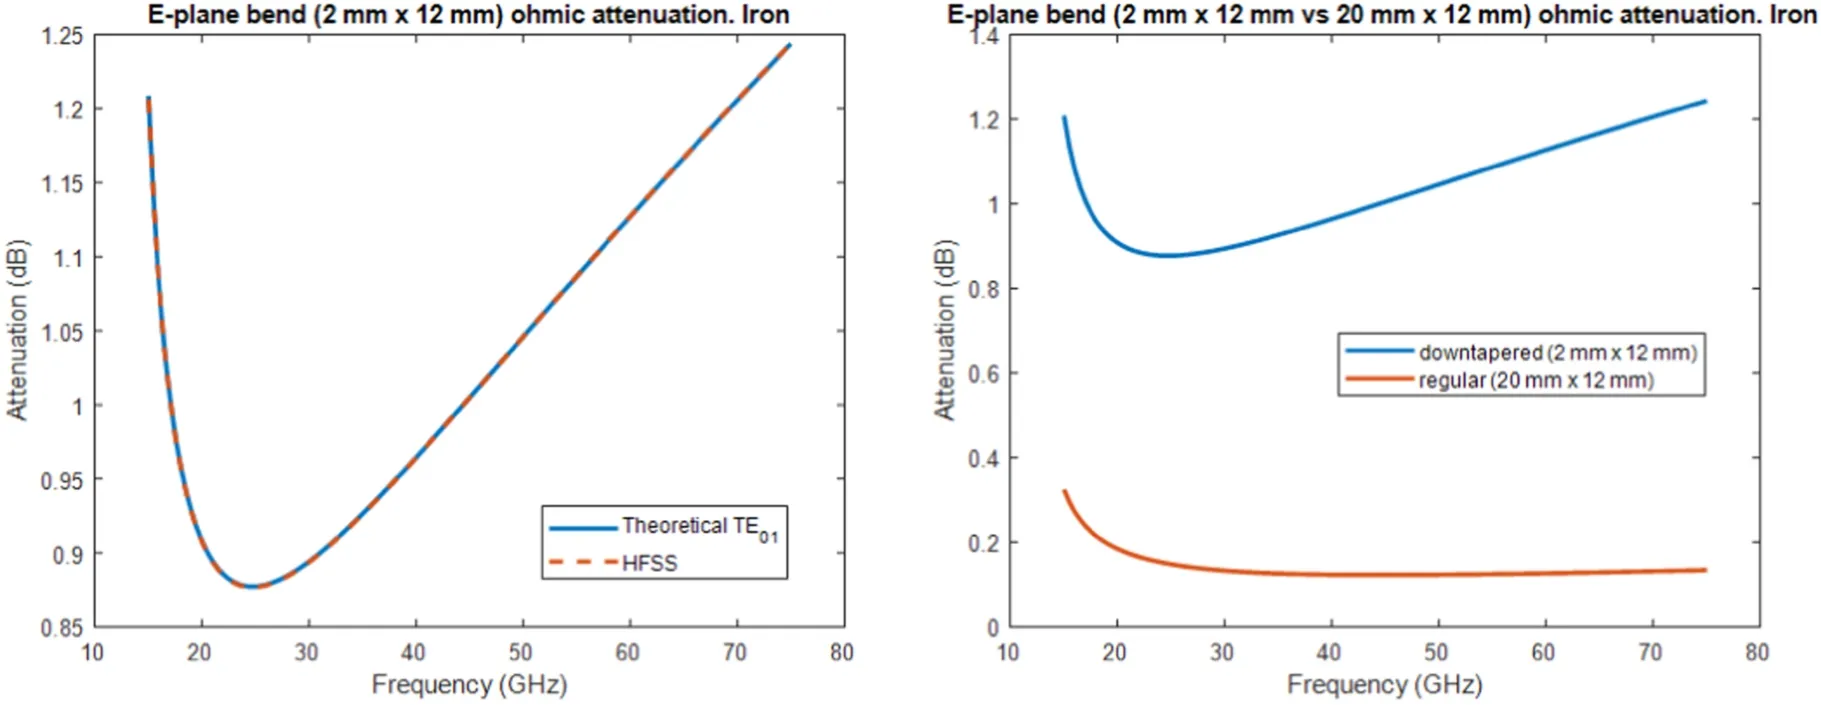
Figure 3.Ohmic losses in a 0.62 m long 2 mm×12 mm E-plane bend.The left panel shows the theoretical results compared with a full wave simulation (HFSS), while the right panel compares the downtapered (2 mm×12 mm) bend with the regular one (20 mm×12 mm) using canonical theory.
Two-dimensional full wave simulations using a finite difference time domain (FDTD) code were performed afterwards to obtain the complex wave amplitudes and phases at the detection antenna end. Performing the spectrogram of these data allows us then to obtain the time delay of the signal, which is then used to reconstruct the plasma density profile. This sort of synthetic diagnostic is used to get an estimation of the error in the determination of the position of the last closed flux surface in both static and turbulent plasmas [5].
3. Transmission line
Once the launching/receiving antennas have been designed and their positions and orientations have been decided, the waveguides carrying the signal must be specified. Rectangular oversized 20 mm×12 mm waveguides have been used for the transmission of the signal.In addition to the oversized dimensions of the waveguide, the TE01mode is chosen in what is called a ‘tall’ waveguide configuration in order to reduce ohmic losses. It is important to note that due to this mode choice, the cut-off frequency depends on the narrow wall dimension instead of the broad one as in the case of the fundamental TE10mode.

One possibility that allows us to get rid of mode coupling at the bends at the cost of additional ohmic losses is downtapering of the waveguide.In particular,wherever the E-plane bends’ performance is unacceptable, the 20 mm×12 mm waveguide can be downtapered into a 2 mm ×12 mm waveguide.In an E-plane bend,power from the TE01mode can be coupled to any of the TEn1/TMn1degenerate mode pairs with n odd,being the TE11/TM11the one with the largest coupling coefficient. By performing a downtaper in the broad dimension of the waveguide, the TE11and TM11modes (degenerate) are at cut-off, and are therefore not degrading performance due to mode conversion. As the narrow dimension is not altered, the cut-off frequency of the operating(TE01) mode is the same, hence allowing normal operation,albeit the reduced dimensions provoke an increase in ohmic losses. Figure 3 shows in the left panel the ohmic losses of a 0.62 m long 2 mm×12 mm downtapered E-plane bend with a 13.17° bending angle and a minimum radius of curvature of 310.88 mm, both calculated analytically using perturbation theory, assuming a straight waveguide of the same length propagating a canonical TE01mode[9],and simulated with a full wave simulation (high frequency structure simulator(HFSS)). For illustrative purposes, it is convenient to highlight that this bend is the S-bend from the downtapered branch of gap 3 routing,which will be described in section 5.Additionally, in the right panel, a comparison using perturbation theory between the same bend using the original 20 mm×12 mm waveguide and the 2 mm ×12 mm one is presented. As the figure shows, despite not being completely rigorous, calculations using the straight waveguide approximation present negligible differences with full wave simulations.Moreover,the comparison between both downtapered and regular waveguides shows that approximately 1 dB loss difference can be obtained in a 0.62 m long bend.

Figure 4.Transmission due to mode conversion in a 200 mm long 2 mm×12 mm to 20 mm×12 mm parabolic uptaper. High frequency spikes may be artefacts of the finite element calculation.
Additionally, an uptaper should be added to the system in order to regain the correct 20 mm×12 mm dimensions. Mode conversion does occur both in the down and uptapers, although it is easier to cope with that in the case of E-plane bends. For instance, figure 4 depicts the mode conversion of a 200 mm length 2 mm×12 mm to 20 mm×12 mm parabolic taper [10]. Although no special optimization was performed on it, very low mode conversion is obtained, therefore making this solution a feasible one.
4. Gap 5 routing
The gap 5 reflectometer involves the use of two pairs of antennas with slightly different launching angles in order to cover different scenarios. Both routings (upper/lower antennas)are very similar,and only the upper antenna pair routing will be shown here. Due to the large distances involved, the whole routing of this gap can be carried out using hyperbolic secant curvature bends, even in the case of E-plane turns.Bending angles could be kept low enough with sufficiently large radii of curvature for acceptable mode conversion losses. Figure 5 shows an image of the final routing from the antennas (from the left) to the primary window (in the lower right corner of the figure) in the upper left image. Additionally,the integrated losses due to mode coupling are shown in the upper right image and the ohmic losses in the lower left one,leading to the total integrated losses that are shown in the lower right panel.
5. Gap 3 routing
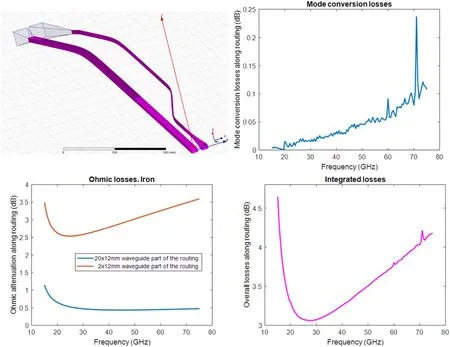
In the case of gap 3, available space for the antennas is not on the axis of the port, thus making it necessary to perform some bending to run parallel to the axis. This fact, added to the reduced distance from the antennas to the primary window and the angle between the antennas,made it impossible to design E-plane bends with an acceptable performance.To minimize mode coupling,it was decided to make the design so that one of the branches was straight (in terms of horizontal bending),therefore increasing the horizontal bending in the other one, thus provoking even more mode coupling.To overcome this hindrance, it was decided to perform a downtaper to a 2 mm×12 mm waveguide (just adjusting the final dimensions of the antenna mouth) and then an uptaper to regain 20 mm×12 mm, as described before.Figure 6 shows in the upper left image the computer aided design representation of this solution and the mode conversion losses in the upper right image. It is important to highlight that as there is no noticeable mode conversion in the 2 mm×12 mm E-plane bends and it is negligible in the H-plane bends, these integrated mode conversion losses are dominated by mode conversion in the 200 mm length uptaper from 2 mm ×12 mm to 20 mm×12 mm, as a comparison with figure 4 reveals. Ohmic losses have also been depicted in the lower left image, splitting results into the losses due to the 2 mm×12 mm waveguide branch and the ones from the 20 mm×12 mm branch for comparison purposes. Finally, the lower right panel shows the total integrated losses when considering ohmic and mode conversion altogether.
6. Conclusions

Figure 5.Gap 5 final routing(upper left)and its mode conversion losses along routing(upper right),ohmic losses along routing considering iron’s resistivity (lower left) and overall integrated losses (lower right).

Figure 6.Gap 3 final routing(upper left)and its mode conversion losses along routing(upper right),ohmic losses along routing considering iron’s resistivity (lower left) and overall integrated losses (lower right).
Both the routings and their performance results for gap 5 and gap 3 of the ITER PPR reflectometer have been presented. In both cases 20 mm×12 mm rectangular oversized waveguides have been used to carry the signal using the TE01mode in order to minimize ohmic losses. Hyperbolic secant curvature bends have been used for the bending needs of the routing and have proven the best solution for H-plane bends. In case of E-plane bends, the degradation of performance has forced us to keep bending angles low, and whenever this was not possible, downtapering to a 2 mm×12 mm waveguide has proven to be a valid solution to get rid of mode conversion at the cost of extra ohmic loses. Nevertheless, ohmic losses have also been calculated and simulated, and acceptable results have been obtained.
Acknowledgments
This work has been partially funded by the Ministerio de Ciencia, Innovacion y Universidades of Spain under project FIS2017-88892-P, and by Fusion for Energy under Specific Grant Agreement F4E-FPA-375-SG05. This publication reflects only the views of the author, and Fusion for Energy cannot be held responsible for any use which may be made of the information contained therein.
ORCID iDs
J MARTÍNEZ-FERNÁNDEZ https://orcid.org/0000-0002-5583-8420
T ESTRADA https://orcid.org/0000-0001-6205-2656
 Plasma Science and Technology2020年6期
- Plasma Science and Technology的其它文章
- First-principles study on the mechanical properties and thermodynamic properties of Mo–Ta alloys
- Formation mechanism of Al2O3/MoS2 nanocomposite coating by plasma electrolytic oxidation (PEO)
- Estimation of the sheath power dissipation induced by ion cyclotron resonance heating
- Influence of toroidal rotation on the tearing mode in tokamak plasmas
- Conversion between Vickers hardness and nanohardness by correcting projected area with sink-in and pile-up effects
- Effects of the critical breakdown path on the ignition performance in heaterless hollow cathodes
