Viscous flow simulations through multi‑lobe progressive cavity pumps
F. M. El‑Abd · E. M. Wahba · I. G. Adam
Abstract Computational fluid dynamics (CFD) simulations of multi-lobe progressive cavity (PC) pumps are limited in the literature due to the geometric complexity of the pump, which places numerous restrictions on the grid generation process. The present study attempts to alleviate such restrictions by developing a detailed numerical procedure for the numerical simulations of multi-lobe progressive cavity pumps. The pro file equations for the multi-lobe con figuration at any section at each instant of rotation are presented. A structured grid generation method is developed to generate mesh files required for CFD simulations of multi-lobe PC pumps. Results from the present procedure are validated against single-lobe PC pump numerical results available in the literature. Finally, a numerical parametric study is carried out to investigate the effect of the number of lobes,the stator pitch, the circular fillet and clearance on the volumetric efficiency of PC pumps with viscous oils.
Keywords Progressive cavity pump · Structured grid generation · Computational fluid dynamics
1 Introduction
Progressive cavity pumps (PCP) are commonly used as an arti ficial lift device in low pressure wells to enhance oil productivity. PC pumps use mechanical power from electric motors or sucker rods to lift crude oil from the downhole to the surface. PCP stators are either made of an elastomer or a metallic material. Elastomer PCP stators are made of rubber,Te flon, silicon or plastic. Internal slip flow of elastomer PCP stators is low compared to metallic PCP stators. Slippage flow rate is a function of pump geometry, differential pressure and fluid viscosity (Karthikeshwaran 2014).
Several studies attempted to investigate the performance of PC pumps. A theoretical and experimental investigation was carried out by Vetter and Wirth (1995) on the performance of single-lobe PC pumps operating with water, which showed that overlapping pumps had more mechanical friction and better volumetric efficiency than pumps with clearance. Martin et al. (1999) evaluated the pressure and temperature distribution along elastomer single-lobe PC pumps,operating under single-phase and two-phase flow conditions using water and air. At low pressure differences, the maximum pressure was located at an intermediate point along the pump, with this point moving further downstream toward the outlet as the pressure difference increased. They also noticed that the maximum temperature was located at an intermediate location along the pump. Olivet et al. (2002) performed an experimental study on single-phase and two-phase flow within a single-lobe PC pump with a metallic stator, where they found that internal slip was constant along the pump.Gamboa et al. (2003b) proposed a simplified hydraulic model for single-lobe PC pumps, considering internal deformation due to stator material and differential pressure. They obtained the slippage flow across the pump and predicted the volumetric efficiency with different operational speeds and pressures. The model showed good agreement with highly viscous oils but failed to predict pump slippage with lower viscosity fluids such as water.
Numerical simulations of PC pumps were carried out by a number of researchers. Gamboa et al. (2003a) presented three simpli fied models of a PC pump using computational fluid dynamics (CFD). However, they concluded that finite element techniques were not suitable for simulating the hydrodynamics of PC pumps because of extensive grid requirements and the huge number of elements needed to perform such a simulation. Andrade et al. (2010)also reached a similar conclusion, where he stated that the geometric complexity of PC pumps makes the use of CFD as an engineering tool almost impossible. (Paladino et al.2008, 2011, 2009; Pessoa et al. 2009) presented a threedimensional CFD model for transient flow in a single-lobe PC pump. The numerical simulations were carried out using ANSYS-CFX. and mesh generation and mesh motion were developed through FORTRAN user-speci fic routines. The developed model was capable of precisely predicting the volumetric efficiency and viscous losses. Mrinal et al. (2016)developed a three-dimensional CFD model using ANSYS Fluent to predict the flow variables at different operating conditions for PC pumps. The dynamic mesh model in ANSYS Fluent was used for the rotor mesh movement, and the hypocycloid path of the rotor was de fined using a userde fined function written in C language. The mesh deformation was carried out with spring-based smoothing and local remeshing technique. Numerical simulations for multiphase flow in PC pumps were also reported by de Azevedo et al. (2016). Moreover, Nguyen et al. (2014) used a vector approach and the hypocycloid theory to derive a modi fied hypocycloid curve which is capable of constructing the profile of the PC pump and predicting the flow area between the rotor and stator for any number of lobes. Nguyen et al.(2016) developed a model for predicting an actual multi-lobe PCP performance. The proposed model is a combination of two existing models in the literature, namely an analytical model to predict the theoretical pump performance and a slippage model. Al-Safran et al. (2017) developed a set of theoretical operational, fluid property and pump geometry dimensionless groups that govern fluid flow behavior in a PC pump. Zheng et al. (2018) developed an analytical model for the flow in the metallic stator PCP. Based on the analysis of the meshing movement and the geometry clearance, the slippage through the transversal and longitudinal sealing regions is calculated considering different slippage mechanisms.
As can be seen from the above literature, CFD simulations in PC pumps are fairly limited due to the geometric complexity of the pump. Such complexity results in numerous problems in the grid generation process. Moreover, CFD simulations were also limited to single-lobe PC pumps, with few attempts made to simulate the flow through multi-lobe PC pumps. The present study attempts to address these restrictions in the CFD simulations of PC pumps. In this paper, the PC pump pro file equations for any number of lobes are detailed taking into consideration twisting, eccentricity, rotational velocity and clearance effects. A structured grid generation method is developed to generate mesh files required for CFD simulations of multi-lobe PC pumps.Results from the present procedure are validated against the single-lobe PC pump results of (Paladino et al. 2008, 2011;Pessoa et al. 2009) and then are extended to the numerical simulation of multi-lobe PC pumps. Finally, a numerical parametric study is carried out to investigate the effect of the number of lobes, the stator pitch, the circular fillet and clearance effects on the volumetric efficiency of PC pumps with viscous oils.
2 PC pump geometry and structured grid generation
A hypocycloid is a two-dimensional (2D) curve which results from tracing a point on a rolling circle of radiusrthat rolls inside another circle of radiusRb. When the ratioRb/ris an integer, a closed hypocycloid curve is generated.A modi fied hypocycloid curve is an offset of the original hypocycloid by a valuerf, whererfis the fillet circular curve radius at each cusp, as shown in Fig. 1.

Fig. 1 Original hypocycloid versus modi fied hypocycloid
Nguyen et al. (2014) discussed the development of the hypocycloid and modi fied hypocycloid equations in detail,but they did not consider twisting, eccentricity, rotation and clearance effects on their equations. The development of the hypocycloid equation proceeds as follows: In Fig. 2, the arc length, in red, on the base circle equals the arc length, in blue, on the rolling circle; hence,
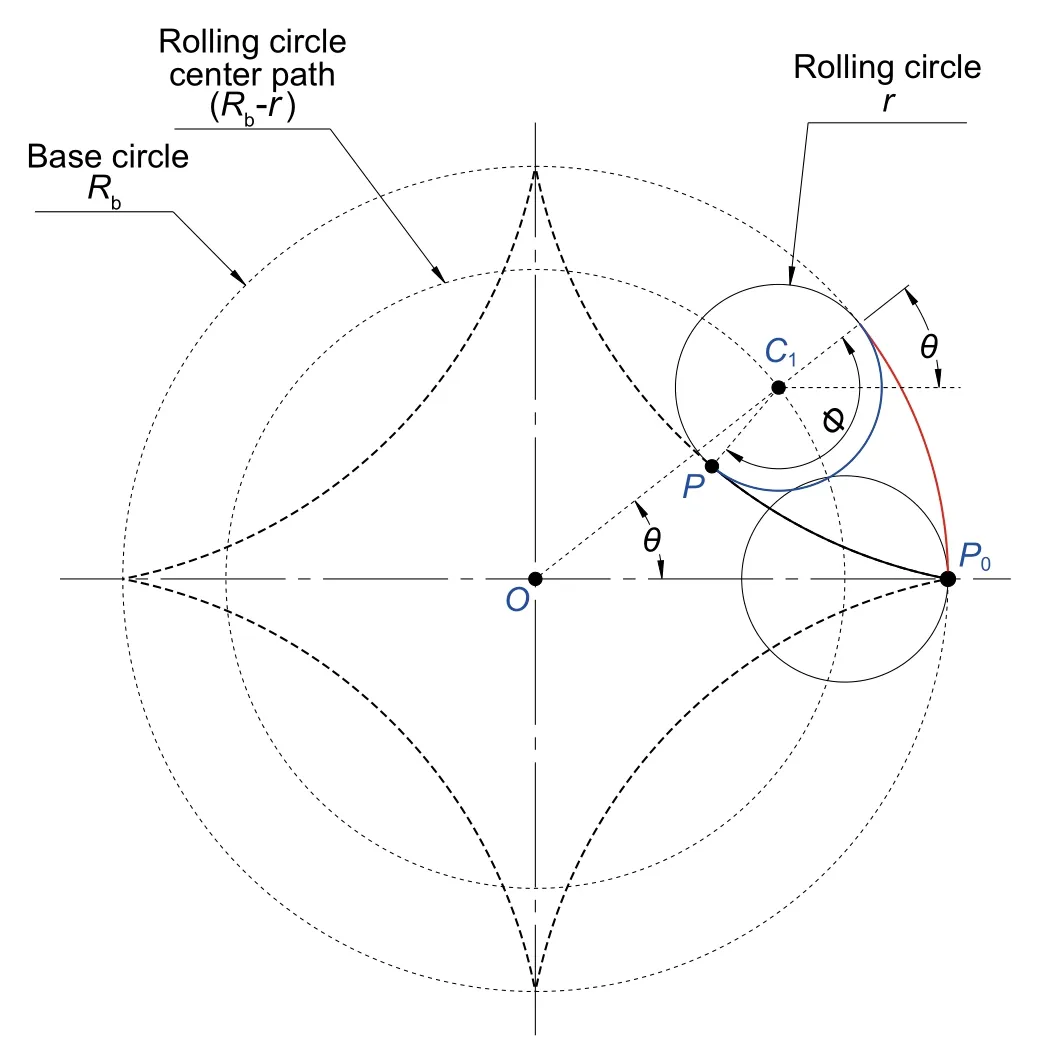
Fig. 2 Hypocycloid curve derivation

Fig. 3 Twisting effect on pro file equations

whereθis the rolling angle of small circle inside the base circle,Nis the ratio between the radius of the base circle and the radius of the rolling circle,N=Rb/r, and ∅ =Nθ.The locus of the tracing pointpgives the hypocycloid curve equations as follows:

On the other hand, the modi fied hypocycloid equations were given by Nguyen et al. (2014) as follows:

where


In the modi fied hypocycloid equations, the normal hypocycloid curve is shifted outward in the direction of the unit normal vector with an offset valuerf. The fillet curve,as shown in Fig. 1, is part of a circle which has its center located at the cusp point. The fillet curve equation can be expressed as

2.1 Effect of twist
For PC pumps, the rotor and stator geometries are twisted in the three-dimensional (3D) domain. Figure 2 shows the position of the tracing pointpin the axial plane,z= 0. At another axial planez, Fig. 3 shows that pointpis shifted by a twisting angleθz. The value ofθzdepends on the axial positionzand the twisting pitchP:

Figure 3 also shows that the radial position of the rolling circle centerC1with respect to base circle centerOis r(N-1) and its angle isθ+θz. Moreover, the radial position of pointpwith respect to the rolling circle centerC1isrwith an angle 2π− ∅ +θ+θz. Hence, taking into consideration the effect of twist, the coordinates of pointpfor the normal hypocycloid equations become

2.2 Effect of eccentricity
The previous equations describe the stator only, but cannot be directly applied to the rotor due to its eccentric motion with respect to the stator. The eccentricity effect is shown in Fig. 4, where the rotor centerC1is shifted from the stator centerOby the distanceE. The radial position of rolling circle centerC2with respect to the rotor centerC1isr(Nr− 1)with an angleθz+θ. Moreover, the radial position of pointpwith respect to the rolling circle centerC2isrand its angle is 2π− ∅ +θ+θz. It is important to note here that the eccentricity has the same value of the rolling circle radius:

2.3 Effect of rotation
The rotor base circle rolls on the stator base circle. Similar to internal gears, the rolling action causes it to rotate around its center and also around the stator’s center. To analyze the effect of rotation, the motion is divided into two steps:rotation around the stator’s center, as shown in Fig. 5, and rolling on the stator’s perimeter, as shown in Fig. 6. After timetand with the rotor rotating with an angular speedωin the positive counterclockwise direction, the new position of the rotor center will be at an angleωt.

Fig. 4 Eccentricity effect on rotor base circle
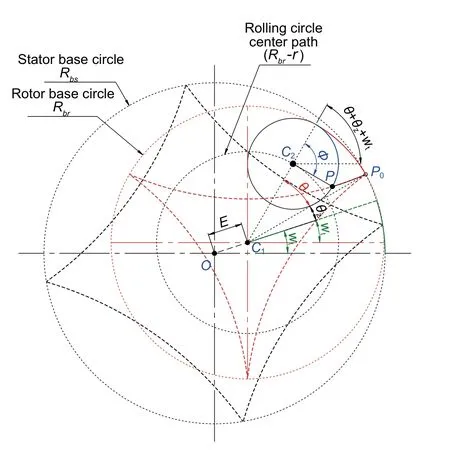
Fig. 5 Rotational effect on rotor base circle

Fig. 6 Rolling effect on rotor base circle
2.4 Effect of rolling
The rolling direction of the rotor is in the clockwise direction. In Fig. 6, the rotor base circle rolls with an angle ∅2around the rotor center, such thatRbsωt=Rbr∅2. By simplifying, we obtain

A summary of the radii and angles of all points is given in Table 1, taking into consideration the combined effects of twist, eccentricity, rotation and rolling. As such, the normal hypocycloid equations after taking all such effects into consideration are expressed as follows:

2.5 Effect of clearance
Industrial PC pumps with a metallic stator maintain a clearance between the rotor and the stator (Karthikeshwaran 2014). This clearance could be added to the stator pro file or subtracted from the rotor pro file. In the modi fied hypocycloid equations, the clearancecis subtracted from the offset valuerf.
2.6 PC pump pro file equations
Taking into consideration the effects of twist, eccentricity,rotation, rolling and clearance, the modi fied hypocycloid equations are expressed as follows:

Table 1 Radii and angles including the effects of twist, eccentricity,rotation and rolling

Moreover, the fillet circular curve center is located at the cusp points, where the equations at each cusp are given as

It should be noted here that the fillet circular curve is not an exact half-circle. The intersection points could be obtained by simultaneously solving the hypocycloid curve equations with the fillet circular curve equations, which is carried out using a trial-and-error approach in the present study. Equations (17, 18, 21, 22) are also used to describe the stator pro file by substitutingE= 0 andω= 0.
2.7 Structured grid generation
Dynamic meshing and structured grid generation for PC pumps are a very difficult and complex process, with the degree of complexity increasing with the increase in the number of lobes. In the present section, we attempt to develop a detailed procedure for generating structured grids for multi-lobe PC pumps.
Equations (17, 18, 21, 22) are used to plot the rotor and stator pro files at each angle of rotation for all longitudinal sections of the PC pump. Radial gridlines are constructed as lines representing angular divisions passing through the stator’s origin and extending from the rotor surface to the stator surface, as shown in Fig. 7. Each radial gridline is then divided to a number of divisions which may be equally or unequally spaced as shown in Figs. 8 and 9, respectively,for a 5:6 PC pump con figuration. Unequally spaced divisions would help to accurately resolve the boundary layers at the rotor and stator surfaces. For equal spacing, the point coordinates are computed as follows:

whereJNrepresents the number of grid points along each radial gridline, andi, j, krepresent the indices for the angular, radial and axial divisions, respectively. For unequal spacing, the hyperbolic tangent stretching approach reported by Paladino et al. (2011) is implemented. After computing the radial and angular divisions for the first axial section (k= 1),the same procedure is repeated for the following longitudinal section. The present structured grid generation procedure is repeated at each time step through one complete revolution of the rotor and for all longitudinal sections of the PC pump. Speci fication of mesh topology and connectivity and imposition of mesh motion followed the same procedure of Paladino et al. (2011). Generation of a single mesh frame required 9 min on an Intel Core i7 machine with 32-GB RAM. A mesh with 201 radial gridlines is divided into 11 unequally spaced divisions and consists of 101 longitudinal sections.

Fig. 7 Radial gridlines for 3:4 PC pump
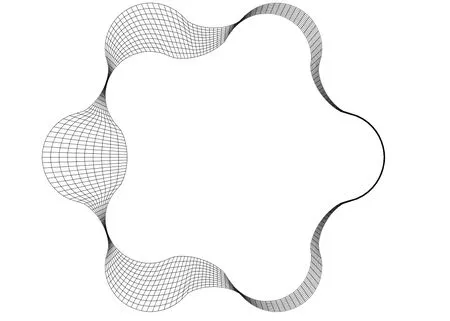
Fig. 8 Equally spaced radial gridline divisions for 5:6 PC pump
2.8 Governing equations and numerical methods
Fluid flow through multi-lobe progressive cavity pumps is governed by the unsteady form of the Navier–Stokes equations which could be expressed, in standard notation, as follows:


Fig. 9 Unequally spaced radial gridline divisions for 5:6 PC pump
The commercial software package ANSYS-CFX (Ansys 2016) is used to numerically solve the Navier–Stokes equations. ANSYS-CFX applies a hybrid finite element/ finite volume approach for the discretization of the governing equations, where the finite volume method enforces local conservation over each control volume, and the finite element method is implemented to describe the solution variation within each element to allow for the computation of the required surface fluxes for this element. The high-resolution advection scheme (Nguyen et al. 2016) is applied for the discretization of the convection terms, where it is the secondorder accuracy in regions of low gradients and reverts to the first-order accuracy in regions where the gradients sharply change. Implicit second-order accurate time integration is applied in the present study. Fixed time steps are de fined to interrupt the solver and continuously replace the mesh frames obtained from the present structured grid generation procedure. Interpolation is carried out to transfer the results from the old mesh frame to the new one at each time instant.
Moreover, the implemented boundary conditions are shown in Fig. 10. Pressure opening boundary conditions are de fined at the inlet and outlet, where the inlet pressure is kept at zero pressure and the outlet pressure is varied in order to obtain the pump performance curve.
3 Veri fication and validation of the numerical procedure
To validate the developed numerical procedure, present results are compared against the CFD results of Paladino et al. (2011) for single-phase flow through a single-lobe PC pump with a rigid stator. The single-lobe PC pump geometric parameters are given in Table 2. Two types of oils were used in Paladino et al. (2011); the first type has a dynamic viscosity of 0.042 Pa s and a density of 868 kg/m3, while the second type has a dynamic viscosity of 0.481 Pa s and a density of 885 kg/m3. For both types of oils, the flow through the PC pump is laminar. The developed structured grid consists of 201 radial gridlines divided into 11 unequally spaced divisions to provide better resolution of the boundary layers.In the axial direction, the structured grid consists of 101 longitudinal sections.

Table 2 Single-lobe PC pump used for validation

Fig. 10 Boundary conditions of single-lobe PCP
Figures 11 and 12 show the performance curve of the single-lobe PC pump using the two types of oils. The performance curve is given in terms of the volumetric flow rate versus the pressure difference at various rotational speeds. As can be seen from both figures, present results are in good agreement with the numerical results of Paladino et al. (2011) and the experimental data of Gamboa et al.(2003a). It is interesting to note here that the slight increase in discrepancy between the experimental and numerical results at higher rotational speeds is due to the need for a finer time step in the numerical procedure to better resolve such higher rotational speeds.
Veri fication of the numerical procedure is carried out next for the multi-lobe con figurations. Eight different multi-lobe con figurations, as shown in Figs. 13 and 14, are considered in the present numerical parametric study, and their geometric parameters are summarized in Table 3. To ensure that the present results are mesh independent, a mesh sensitivity study is carried out on the most complicated con figuration,which is the 5:6 lobe con figuration. Numerical simulations are performed using four different grids, as shown in Fig. 15,and compared with the theoretical flow rate predicted from Nguyen et al. (2014). Figure 15 shows that doubling the number of elements of the (201 × 11 × 101) grid results in a discrepancy in the predicted flow rate of less than 4%.Moreover, Fig. 15 shows that present numerical predictions are in good agreement with the theoretical flow rate, with a discrepancy of about 11%. Similar mesh sensitivity studies were carried out for the other con figurations, providing con fidence that the numerical results of the (201 × 11 × 101)grid are mesh independent.

Fig. 11 Volumetric flow rate versus differential pressure μ=0.481Pa s

Fig. 12 Volumetric flow rate versus differential pressure μ = 0.042 Pa s
4 Results and discussion
With increasing the number of lobes, it is found that the flow is repeated within a single revolution where the number of cycles is equal to the number of stator lobes as shown in Fig. 16. Therefore, there is no need to perform the simulation for a full revolution, only half a revolution would suffice for a 1:2 con figuration and a one-third revolution for a 2:3 con figuration and so on. It should be noted here that such a procedure would not be valid for low-viscosity fluids where inertial terms are important, as for such fluids there is a time for the flow establishment to reach the periodic transient condition. Moreover, Fig. 16 shows that increasing the number of lobes results in reduced fluctuations in the flow rate and hence a lower pulsating action in the PC pump performance.

Fig. 13 Multi-lobes mesh cross section

Fig. 14 Cavity shape of different number of lobes

Table 3 Multi-lobe PC pump models

Fig. 15 Mesh sensitivity study for the 5:6 lobe con figuration (model 5)

Fig. 16 Flow rate at each degree of revolution for different lobes at 200 rpm and 40 psi with viscous oil 0.481 Pa s

Fig. 17 Flow rate versus differential pressure for different lobe configurations at 200 rpm

Fig. 18 Flow rate versus differential pressure for different lobe conif gurations at 300 rpm

Fig. 19 Effect of decreasing clearance on the multi-lobe pump performance

Fig. 20 Effect of increasing stator pitch on the multi-lobe pump performance
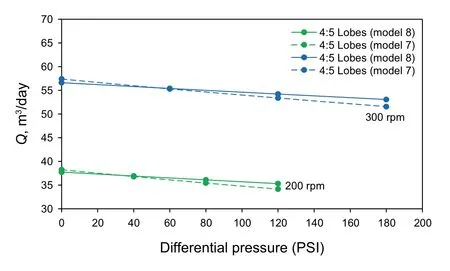
Fig. 21 Effect of increasing fillet diameter on the multi-lobe pump performance

Fig. 22 Volumetric efficiency of multi-lobe PC pump models at 200 rpm

Fig. 23 Volumetric efficiency of multi-lobe PC pump models at 300 rpm
For the same stator major diameter and same pitch,Figs. 17 and 18 show that increasing the number of lobes would decrease the flow area which, in turn, would reduce the flow rate at the same rotating speed and differential pressure. Volumetric efficiency also drops with increasing the number of lobes as they would increase the number of cavities and hence increase the number of sealing lines as shown in Fig. 14, which allows more fluid to escape.
Figure 19 shows that PC pumps with smaller gap have less slip flow, as can be seen from the comparison between models 4 and 6. Moreover, Fig. 20 shows that doubling the stator pitch not only doubles the flow rate but also enhances the volumetric efficiency, as can be seen from the comparison between models 6 and 7. An interesting geometric parameter is the radius of the fillet curve. Although it slightly reduced the flow area, however, it delivered more flow, as shown in Fig. 21, because of the increased sealing line width which improves sealing and enhances the volumetric efficiency. Figures 22 and 23 show a comparison of the volumetric efficiency of the different models at 200 rpm and 300 rpm, respectively.

Fig. 24 Point distribution in an internal plane of the 2:3 lobe con figuration (model 2)
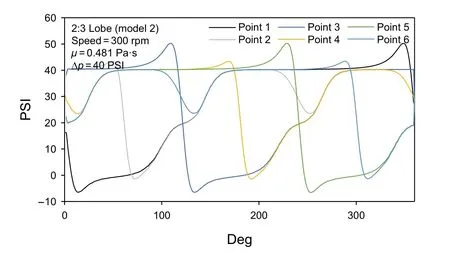
Fig. 25 Local pressure versus angle of rotor rotation for the 2:3 lobe con figuration (model 2)
Finally, more physical insight could be gained by considering local flow solutions within the PC pump. As such,Fig. 24 shows the 2:3 lobe con figuration (model 2), where six points are selected to monitor flow pressure. The six points are distributed over the stator wall at the major and minor diameters and are located at an axial plane shifted from the inlet by 40 mm, which represents one-third of the stator pitch. Figure 25 shows the pressure at each of the six points as a function of the angle of rotor rotation. All points located on the major diameter show consistent values of pressure with a shifting angle. A similar behavior is also encountered with all points located on the minor diameter.It is interesting to note here the high pressure drop that is encountered when the angle of rotor rotation corresponds to a small gap between the stator and the rotor. Finally, Fig. 26 shows detailed stator pressure contours at different degrees of rotation for the 2:3 lobe con figuration (model 2). The pressure contours are provided for every 30° of rotation to clearly demonstrate the progress of the cavity and the liquid pressurization process.
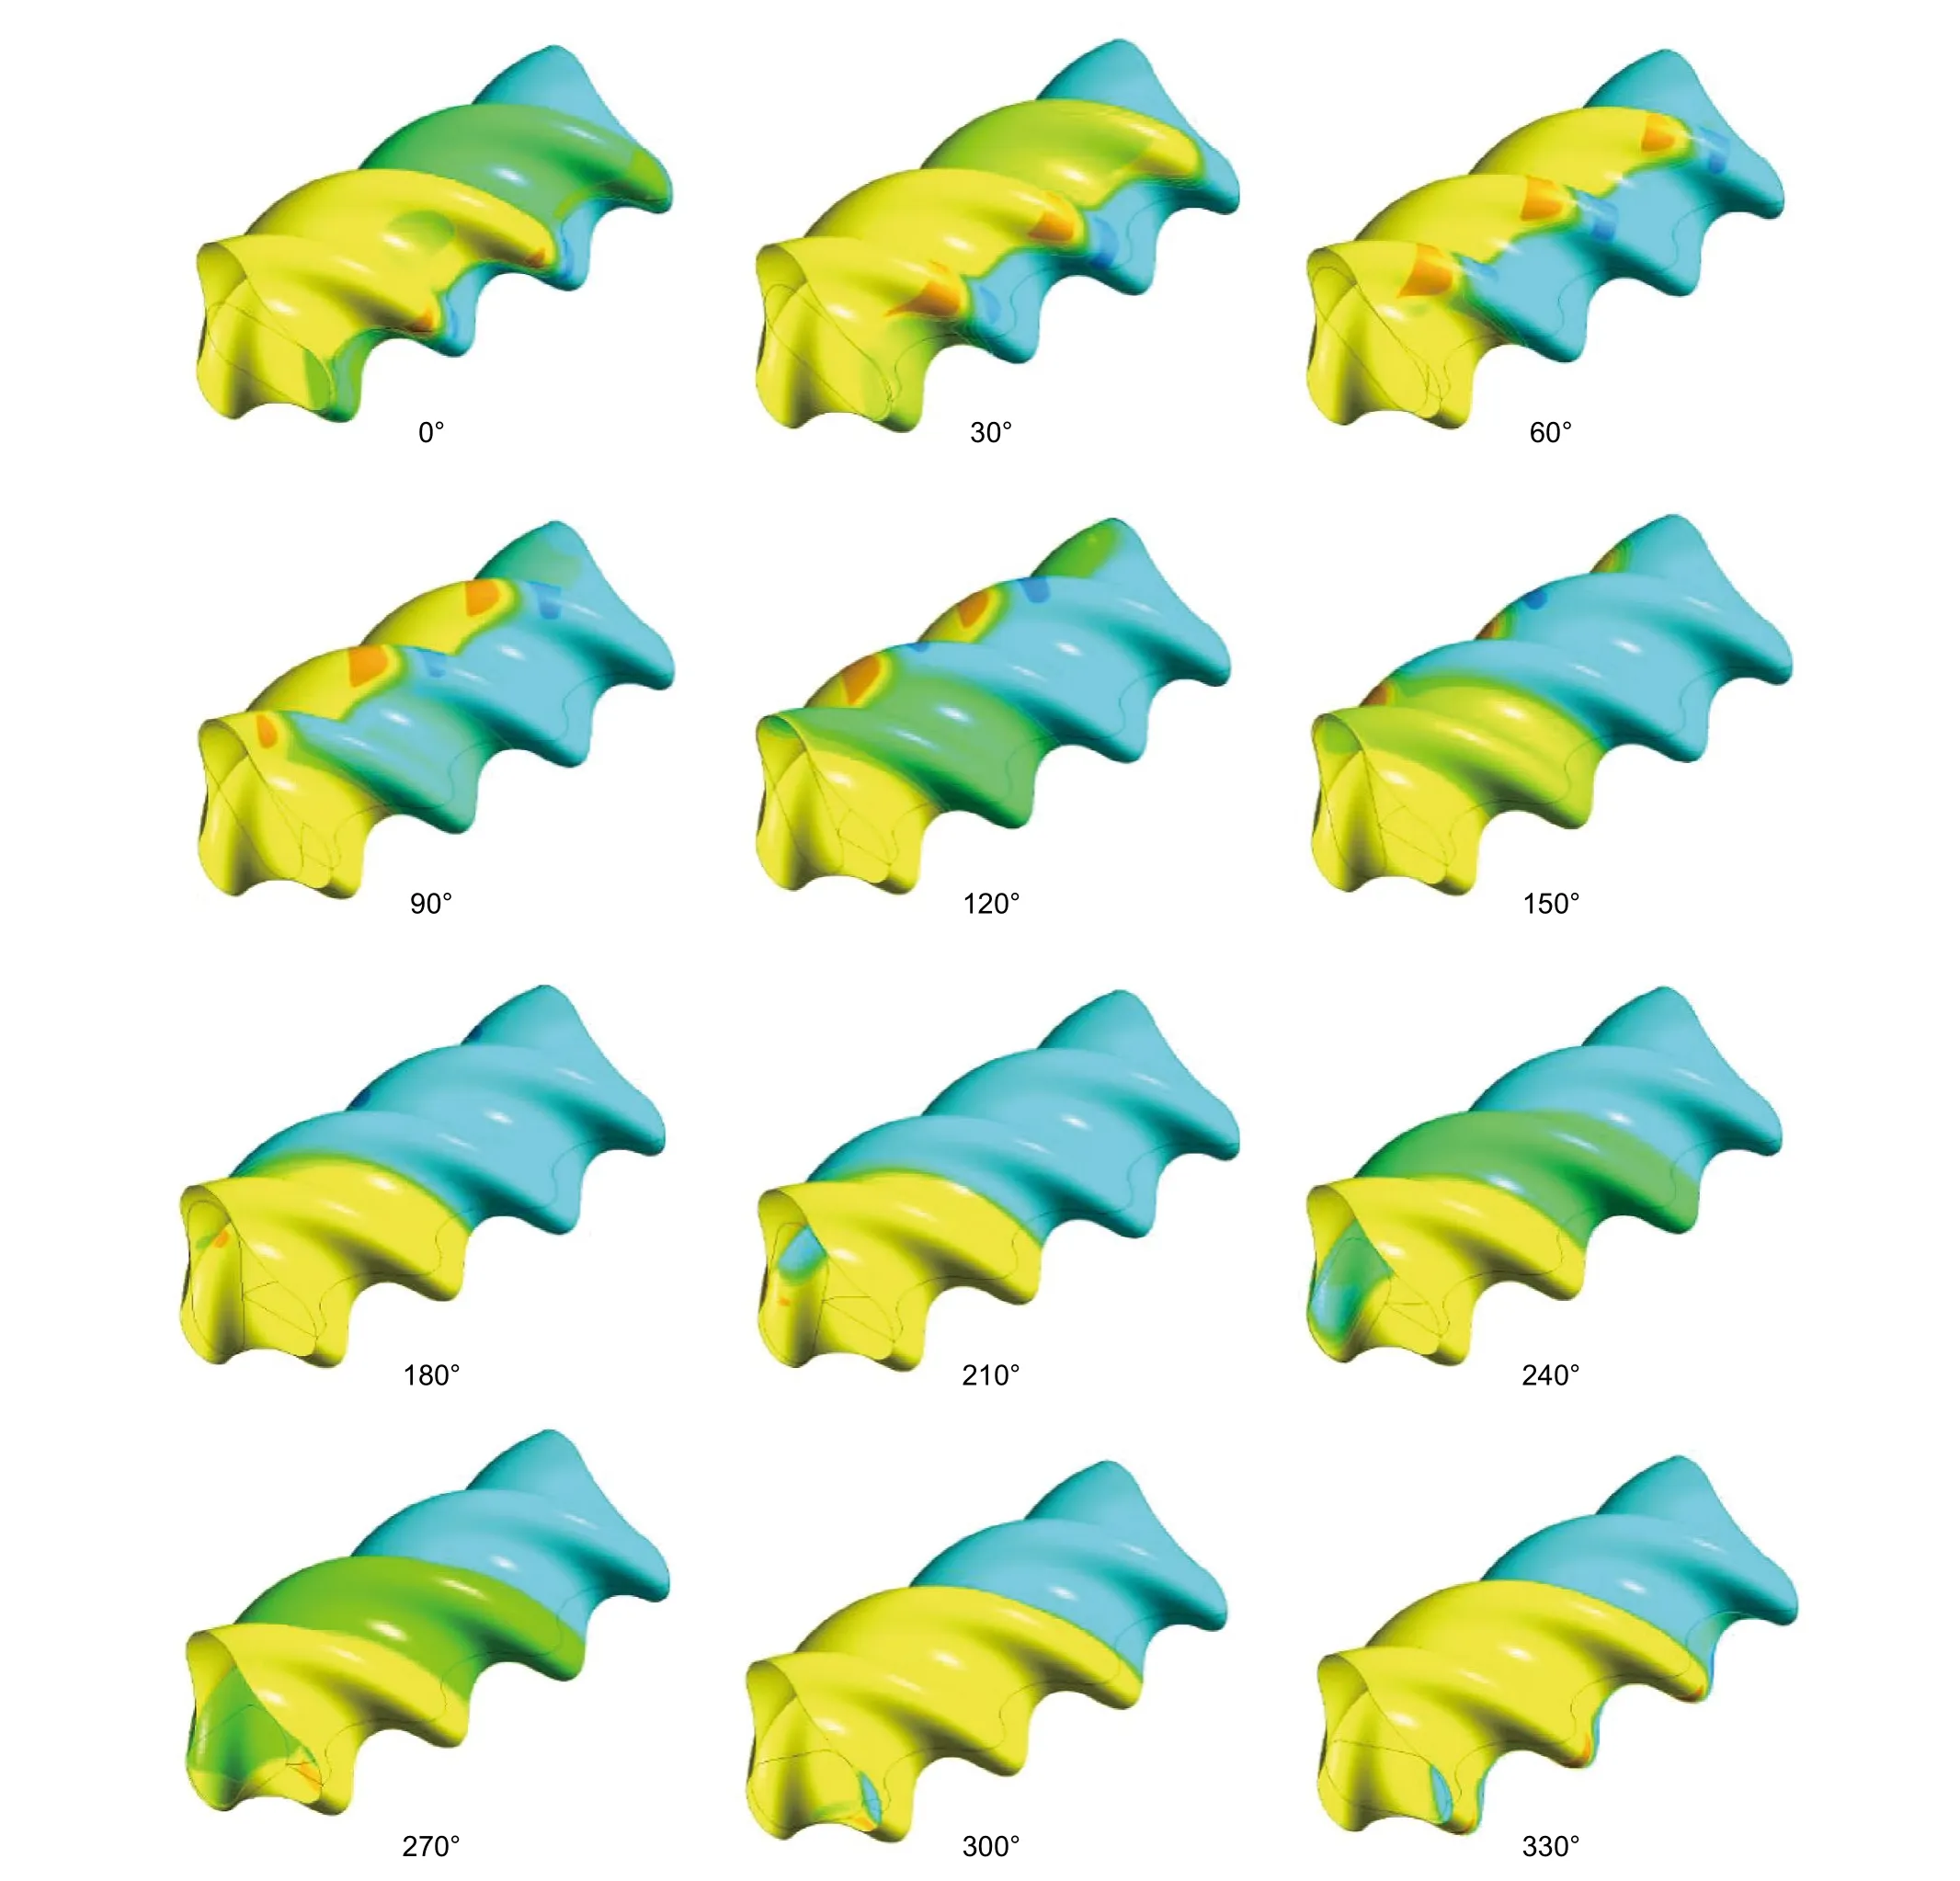
Fig. 26 Pressure contours for the 2:3 lobe con figuration at different degrees of rotation
5 Conclusions
A detailed structured grid generation procedure is developed in the present study to allow efficient numerical simulations of viscous flow through multi-lobe progressive cavity pumps. Effects of twist, eccentricity, rotation and clearance are taken into consideration through the modi fied hypocycloid equations. Present numerical results show that increasing the number of lobes results in reduced fluctuations in the flow rate and hence a lower pulsating action in the PC pump performance. However, volumetric efficiency for multi-lobe PC pumps is shown to drop with increasing the number of lobes, as this would increase the number of cavities and hence increase the number of sealing lines, which allows more fluid to escape.
Open AccessThis article is licensed under a Creative Commons Attribution 4.0 International License, which permits use, sharing, adaptation, distribution and reproduction in any medium or format, as long as you give appropriate credit to the original author(s) and the source,provide a link to the Creative Commons licence, and indicate if changes were made. The images or other third party material in this article are included in the article’s Creative Commons licence, unless indicated otherwise in a credit line to the material. If material is not included in the article’s Creative Commons licence and your intended use is not permitted by statutory regulation or exceeds the permitted use, you will need to obtain permission directly from the copyright holder. To view a copy of this licence, visit http://creat iveco mmons.org/licen ses/by/4.0/.
- 石油科学通报的其它文章
- Thermal maturity evaluation using Raman spectroscopy for oil shale samples of USA: comparisons with vitrinite re flectance and pyrolysis methods
- Light hydrocarbon geochemistry: insight into oils/condensatesfamilies and inferred source rocks of the Woodford–Mississippian tight oil play in North‑Central Oklahoma, USA
- Deep‑water depositional architecture and sedimentary evolution in the Rakhine Basin, northeast Bay of Bengal
- A two‑step method to apply Xu–Payne multi‑porosity model to estimate pore type from seismic data for carbonate reservoirs
- Nonlinear amplitude versus angle inversion for transversely isotropic media with vertical symmetry axis using new weak anisotropy approximation equations
- Numerical simulation and dimension reduction analysis of electromagnetic logging while drilling of horizontal wells in complex structures

