CFD analysis and field observation of tool erosion caused by abrasive waterjet fracturing
Mao Sheng · Zhong‑Wei Huang · Shou‑Ceng Tian · Yi Zhang · Shi‑Wang Gao · Yun‑Peng Jia
Abstract Abrasive waterjet (AWJ) fracturing has become an accepted horizontal multistage stimulation technique due to its flexibility and high efficiency of extensive fracture placement. The downhole tool failure of AWJ fracturing becomes an issue in the massive hydraulic fracturing because of high velocity and proppant erosion. This paper proposed a 3D computational fluid dynamics (CFD)-based erosion model by considering high-velocity waterjet impact, proppant shear erosion, and speci fic inner structure of hydra-jet tool body. The discrete phase approach was used to track the proppant transport and its concentration distribution. Field observation provides strong evidence of erosion patterns and mechanisms obtained from CFD simulation.The results show that the erosion rate has a space dependence in the inner wall of the tool body. The severe erosion areas are primarily located at the entries of the nozzle. Evident erosion patterns are found including a ‘Rabbit’s ear’ erosion at the upper-layer nozzles and a half bottom loop erosion at the lower-layer nozzles. Erosion mechanisms attribute to high flow velocity at the entry of nozzles and the inertia force of proppant. Sensitivity analysis demonstrates that the pumping rate is a primary factor contributing to erosion intensity.
Keywords Hydraulic fracturing · Erosion · Computational fluid dynamics (CFD) · Waterjet
1 Introduction
Abrasive waterjet (AWJ) fracturing stimulation, also called hydra-jet fracturing, has been accepted as an effective and efficient for horizontal multistage well completion (Huang et al. 2017). Major technical advantages include the integration of AWJ perforation and fracturing, hydraulic isolation capacity, pinpoint fracture initiation, unlimited stages, and high efficiency (Surjaatmadja et al. 1998; Li et al. 2004;Huang et al. 2008). Abrasive waterjet downhole tool is one of the key components that consist of a tool body, nozzles, a guide shoe, centralizers, and multi-hole tube. As illustrated in Fig. 1, fracturing sands or ceramic proppant was accelerated through waterjet nozzles to a high velocity, hundreds of meters per seconds, and to complete perforation and fracturing jobs. Since that, the velocity of solid proppant inside the tool, especially around the nozzle area, can be high enough to remove material from the tool body that is called erosion.Thus, one of the challenges we face is the erosion failure of the downhole tool that may happen after the massive hydraulic fracturing.
The failure cases of AWJ downhole tools have been reported from field observations and laboratory tests (Surjaatmadja et al. 2008; Li et al. 2010). Only limited literature discussed the characteristics and failure mechanics of AWJ fracturing tools. McDaniel et al. (2008) first proposed a conceptual model that illustrates two types of primary erosion behavior involving splash-back erosion outside the tool body and internal erosion. Internal erosion resulted from‘overshot’ or from the fluid following a circular turbulent path to generate the Coriolis effect. Surjaatmadja et al.(1998) designed a new structure of the AWJ tool to resist serious erosion under downhole by adjusting the nozzle axial direction. Huang et al. (2014) explained the reasons of the splash-back erosion outside and inside severe erosion area at the entry of nozzles from field observations and a 2D solid– fluid CFD simulation. However, previous works mainly described the erosion phenomena and potential explanation. A comprehensive numerical simulation of flow field and erosion identi fication is still required.
Erosive damage and even tool failure caused by proppant impinging are of great importance in the oil and gas industry, such as sand production, pipeline transportation, and hydraulic fracturing. A variety of models and approaches were previously proposed and can be classi fied into empirical, mechanistic, and CFD-based approach (Arabnejad et al.2015). Particularly, the CFD-based erosion modeling has been accepted as a reliable tool to predict the maximum erosion rate and find susceptible erosion regions, even in complex geometries (Parsi et al. 2014). Many successful CFD modeling and prediction of tool erosion have been reported in frac-pack stimulation (Lee et al. 2013), multiphase flow(Bozzini et al. 2003; Parsi et al. 2017), and high-velocity waterjet impinging (Mabrouki et al. 2000; Ma et al. 2008).
The scope of this particular study is the simulation of the proppant erosion inside the downhole tool caused by abrasive waterjet fracturing. A three-dimensional (3D)CFD-based erosion model was built to account for field-scale conditions including high-velocity waterjet, particle-laden slurry flow, and the structure of double-layer nozzles distributed on AWJ tool body. The erosion mechanisms extracted from CFD simulation attribute to the high-velocity fields at the entry of nozzles and the inertia force of proppant.

Fig. 1 Schematic diagram of a hydra-jet tool
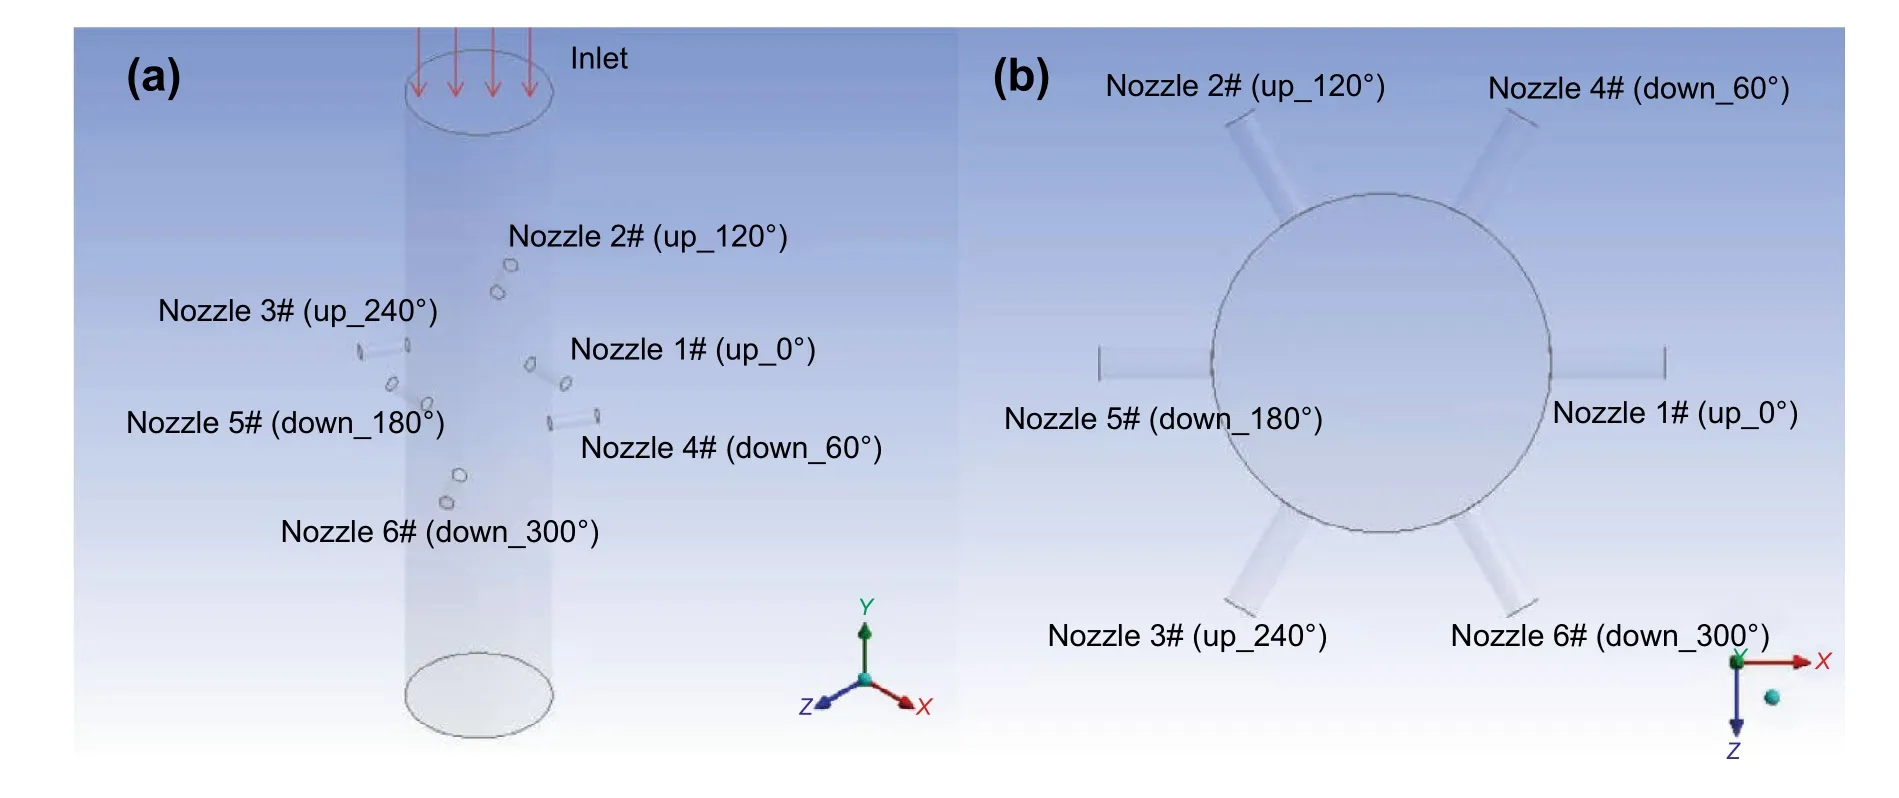
Fig. 2 Model geometry: six nozzles are assigned at two layers with a phase angle of 60° that are labeled from 1# to 6#
2 CFD‑based erosion modeling
2.1 Model geometry and mesh
A 3D physical model of the inner flow channel in the hydrajet tool body was built on ANSYS-Fluent platform by retaining the nozzle structure and assignment. In order to catch the real erosion situations from field application, the major characteristics of hydra-jet fracturing is consistent with the field scale, including the geometry and materials of the hydra-jet tool, the pumping rate, the proppant types, and fracturing fluid properties. In details, AISI 1045 steel and cemented carbide were selected as material of the tool body and nozzles, respectively. As illustrated in Fig. 2, the inner diameter and length of the hydra-jet body were 60 mm and 300 mm,respectively. The thickness of the tool body is 12 mm. There are two layers of the nozzles, and three nozzles are distributed in each single layer. Their phase angle is 60 degrees from the top view (Fig. 2b). We named those nozzles by a combination of the layer and phase angle. In details, nozzles 1# (up_0°), 2# (up_120°), and 3# (up_240°) are the upper nozzles; nozzles 4# (down_60°), 5# (down_180°),and 6# (down_300°) are the lower nozzles. The proppant slurry enters from the inlet and flow out through ∅6.0-mm nozzles with a pumping rate ranging from 1.8 to 3.3 m3/min.The ceramic proppant was studied, and its mass concentration ranged from 100 to 160 kg/m3. The fracturing fluid is considered as a shear thinning fluid with the apparent viscosity of 150 mPa s at 170 s−1and 40 °C. The rheological behavior can be quanti fied by the power-law rheology with the flow consistency index of 325 Pa snand the flow behavior indexnof 0.85. The flow condition should be a typical turbulent flow (estimated Reynolds number: 4200-7854)mixing with solid particles, especially at/around the inlets of nozzles. Furthermore, the proppant particles in fluence the walls of the flow domain, and their impact velocity and impact angles are important input parameters to evaluate the total erosive effects of particles on a surface. Particularly, the only difference between numerical model and field application is the proppant size distribution. In the field application,the proppant size is a range value from 0.425 to 0.850 mm(20/40 mesh). However, the numerical model is not capable to account for the various sizes thus the uniform size of proppant is assumed.
In this study, a tetrahedral grid was used to mesh the geometry model (Fig. 3). Field observation indicated that the nearby regions of nozzles appeared to be a much more serious erosion area. Thus, we re fined their local mesh grid to capture the diverse gradient of fluid flow and proppant transport. The total number of grids is 416,772 and their nodes are 130,502. The maximum mesh size is only 3 mm length that is adequate to capture the details of flow field.
2.2 CFD model of fluid flow and particle trajectory
The erosion model incorporated into a CFD framework by using a commercial software ANSYS CFX-12. The fluid dynamics was studied for a steady, turbulent, and solid– fluid two-phase flow. The rheology of the fracturing fluid was characterized by a power-law rheological model. Thus,the discrete phase model (DPM) combining with a standard Eulerian–Lagrangian CFD approach was selected for the simulation of the flow field and for the simulation of the particle trajectories and their impacts on the tool walls.Particularly, a coupled DPM was applied to account for the particle–particle and particle–wall collisions, and hence the calculation alternated between Eulerian solutions of the fluid flow followed by Lagrangian tracking of the proppant.Herein, we only regarded the steady flow inside the hydrajet tool. The in fluence of erosion on flow field was not taken account since the amount of erosion was too small to change the flow field in this case.

Fig. 3 Mesh grid structure: The local mesh at nearby regions of nozzles is re fined. The total number of grids is 416,772, and their nodes are 130,502
The Eulerian simulation solves the continuity and Reynolds-averaged Navier–Stokes equations. In conjunction with this, the realizedk– turbulence model was used to decouple Reynolds-averaged Navier–Stokes equations. The Lagrangian tracking of the particles was obtained from the solution of particle momentum equations by considering gravity, drag force, and interaction force between particles and fluid. The detailed formula has already been presented in the reference(Wong et al. 2012). Moreover, the in fluence of turbulence on the particle dispersion cannot be ignored in this study due to high turbulence intensity of waterjet. A stochastic model,also called the discrete random walk model, was adopted to predict the turbulent dispersion of particles by integrating
the trajectory equations for each particle with the instantaneous fluid velocity along the particle path.
2.3 Boundary conditions
As shown in Fig. 2, the velocity inlet boundary condition,which was calculated from the pumping rate, was imposed at the entry of the hydra-jet tool. The outlet pressure boundary was positioned at the outlet cross section of nozzles in order to simulate ambient static pressure environment. So,the CFD model can be used to compute the outlet flow rate of each nozzle. Herein, the outlet pressure was given as 10 MPa. Standard wall functions were selected for the nearwall zone treatment.
Particle stream was injected from a plane source at the inlet boundary and released into the flow with the same inlet flow velocity. The impact of particle stream on the tool wall was treated as an elastic re flection, with fixed momentum restitution coefficients in both normal and tangent directions with respect to the hitting direction on the wall.
2.4 Erosion model
The impact velocity and impact angle of each particle on the walls were predicated from the CFD model and then used to calculate the erosion rate based on an erosion model. An existing erosion model by Finnie (1960) within ANSYSFluent was implemented in this study since it was applicable to the ductile erosion. The formula can be written as (Finnie 1960):

whereis the mass flow rate of the impact stream;f(α) is an impact angle function;αdenotes the impact angle and it is computed from the velocity field distribution of solid particles;vpis the impact velocity of the solid particle;Afaceis the impact area;Nis the number of the particles;Kandnare constants assumed to depend on the physical characteristics of the materials involved (Haugen et al. 1995). Herein, we referred the experimental value ofKandnas 2 × 10⁻⁹and 2.6 for steel material. Thef(α) formula was given by Finnie(1960) for metal material:

3 Results and discussion
According to the case matrix in Table 1, 14 simulations were conducted to take account of the effects of pumping rate,proppant size, and particle concentration. The case values aligned with field-scale situations. The fracturing fluid rheology is controlled as the viscosity of 150 mPa s at 170 s−1and 40 °C and the density of 1050 kg/m3.
3.1 Comparison of field observation and CFD simulation
Figure 4 shows the distribution of erosion rate on the inner walls for the base case. The value of erosion rate ranges from 0 to 0.1496 kg/(m2s). The results demonstrate that only nozzle entry zones hold severe erosion above 0.05982 kg/(m2s).Other locations only presented little erosion below the erosion rate of 0.01496 kg/(m2s). A circular area of diameter 10 mm at nozzle entries was selected as our study targets as shown in Fig. 4. It should be stated that the selected circular area/circle covers the erosion areas and is capable of being an indicator to evaluate the erosion intensity.
Figure 5 shows the filed distribution of erosion rate at our target areas for different pumping rates. There exists a strong space dependence of erosion rate. In details, a severe erosion occurs in the locations with phasing of 45°and 135° for upper-layer nozzles just like ‘Rabbit’s ears,’but for lower-layer nozzles the half bottom loop exhibits a relatively uniform erosion. Furthermore, the location of the maximum erosion (red in color bar) varies with the pumping rate. While the flow rate exceeds 3.0 m3/min, the location of the maximum erosion changes from the upper-layer nozzle to the lower-layer nozzle.

Table 1 Numerical simulation scheme
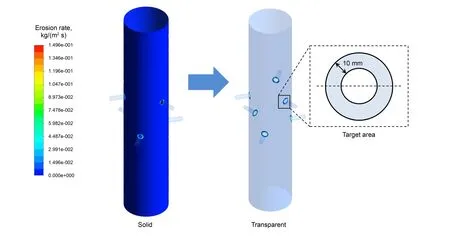
Fig. 4 Erosion rate distribution at inner tool walls: Both solid and transparent rendering methods are used to clarify the strong erosion around the entry of nozzles

Fig. 5 Erosion rate distribution at nozzle entries for different flow rates. a Q = 1.8 m3/min. b Q = 2.4 m3/min. c Q = 3.0 m3/min. d Q = 3.3 m3/min
The values of erosion rate at each mesh grid within the target circular area were averaged as the average erosion rate indicator, to quantify the erosion intensity. We compared three fundamental erosion parameters including maximum erosion rate, average erosion rate, and phasing of maximum erosion rate between two layers of nozzles as summarized in Table 2. The results indicated that the maximum erosion rate for each nozzle is almost 5–7 times values of average erosion rate. The upper-layer nozzles showed a severe erosion from the view of maximum erosion rate, but the lower-layer nozzles exhibited larger values of average erosion rate. It can be concluded that two possible failure points exist involving the‘Rabbit ear’ at upper-layer nozzle and the half bottom loop at lower-layer nozzle.
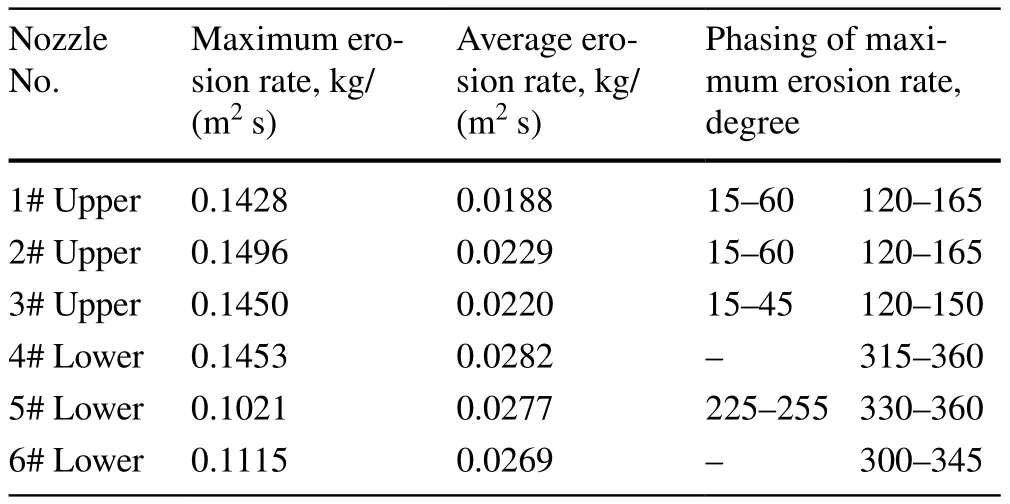
Table 2 Summary of maximum and average values of erosion rate and their phasing for base case group
Three field cases of hydra-jet fracturing were selected to be comparable with numerical simulation. As shown in Fig. 6, their pumping rates ranging from 1.8 to 2.3 m3/min have been taken account in the numerical cases. The proppant volumes injected through the downhole tool are 16.5, 18.0, and 21.6 m3, respectively. The tool bodies were cut open by the oxyacetylene flame in order to observe the final erosion behavior. It can be seen that ‘Rabbit’s ears’erosion obviously existed at the upper nozzles and a half bottom loop erosion occurred at the lower nozzles. Besides,the maximum erosion depth for upper nozzles was in the range of 8 to 10 mm, in which the value was bigger than the value of lower nozzles with erosion depth of 3–6 mm. Those phenomena were successfully captured and explained by numerical simulation. However, there still exist strong challenges to reach a perfect match between simulation and field results, which causes from the complexity and uncertainty of field operation such as the variable pump rate history and proppant size distribution. In this study, we try to make a consistency on the geometry and material of downhole tool, the fracturing fluid viscosity, and the type of proppant between simulation and field application.
Two erosion pro files from Case I were selected in comparison with the numerical results where their pumping rates and geometry scale are the same. As shown in Fig. 7, The‘Rabbit’s ears’ erosion and a half bottom loop erosion occurring at the lower nozzles were observed from both numerical simulation and field observation, which provides strong evidence of the erosion patterns and mechanisms obtained from the proposed 3D CFD-based erosion model.

Fig. 6 Photographs of inner wall erosion around nozzle entries. a Case I: Q = 1.8 m3/min, 16.5 m3 sand. b Case II: Q = 2.2 m3/min, 18.0 m3 sand.c Case III: Q = 2.3 m3/min, 21.6 m3 sand
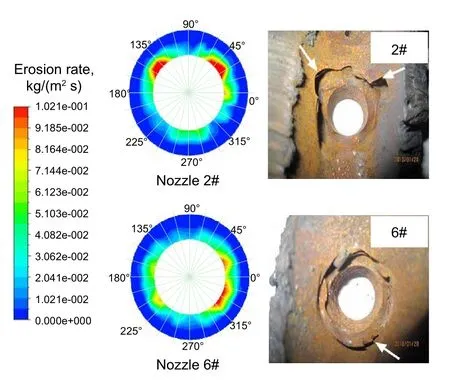
Fig. 7 Photographs of inner wall erosion around nozzle entries
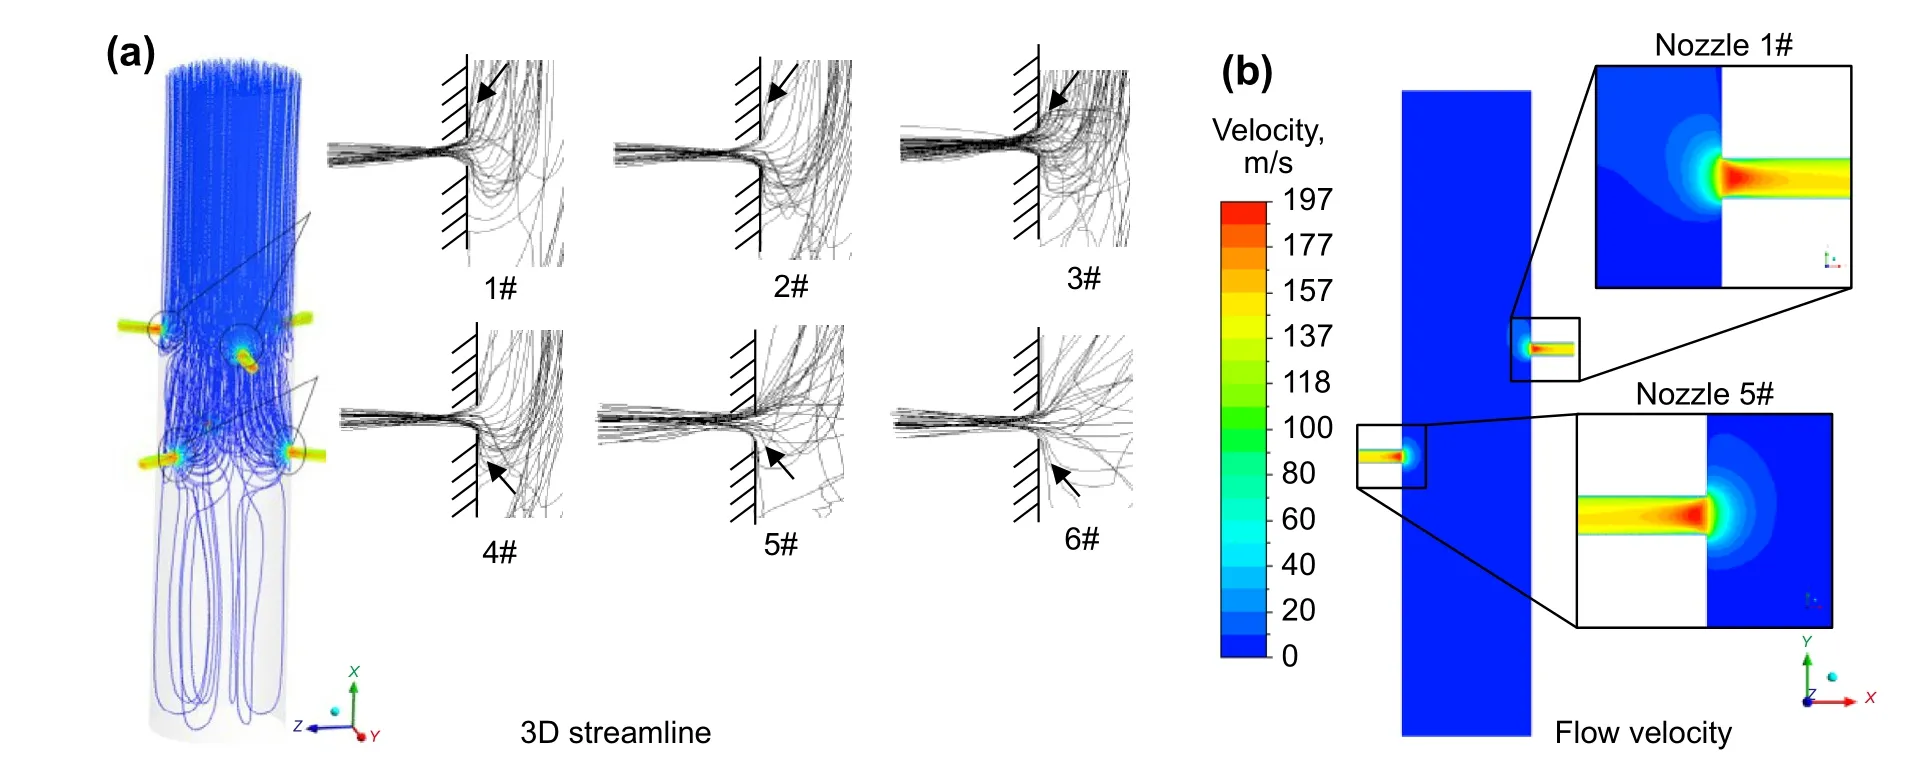
Fig. 8 a Streamline distribution of flow field: streamline curves at top of upper nozzles but uniform for down nozzles. b Fluid velocity distribution
3.2 Flow field characteristics
Flow filed determines proppant trajectory and impact velocity. Figure 8 shows the streamline and flow velocity mapping at nozzle entries. The fluid velocity at nozzle entries is extremely big ranging from 20 to 80 m/s, which indirectly indicates a high impact velocity of proppant on the inner wall of tool body. Furthermore, a high streamline density and streamline curve centralize at either top of upper-layer nozzle or bottom of lower-layer nozzle.
Figure 9 indicates the variety of mass flow rate and concentration of proppant pass through each nozzle.An asymmetrical amount of proppant at each nozzle was observed. In details, more than 10% proppant flow through the lower-layer nozzles than the upper-layer nozzles.
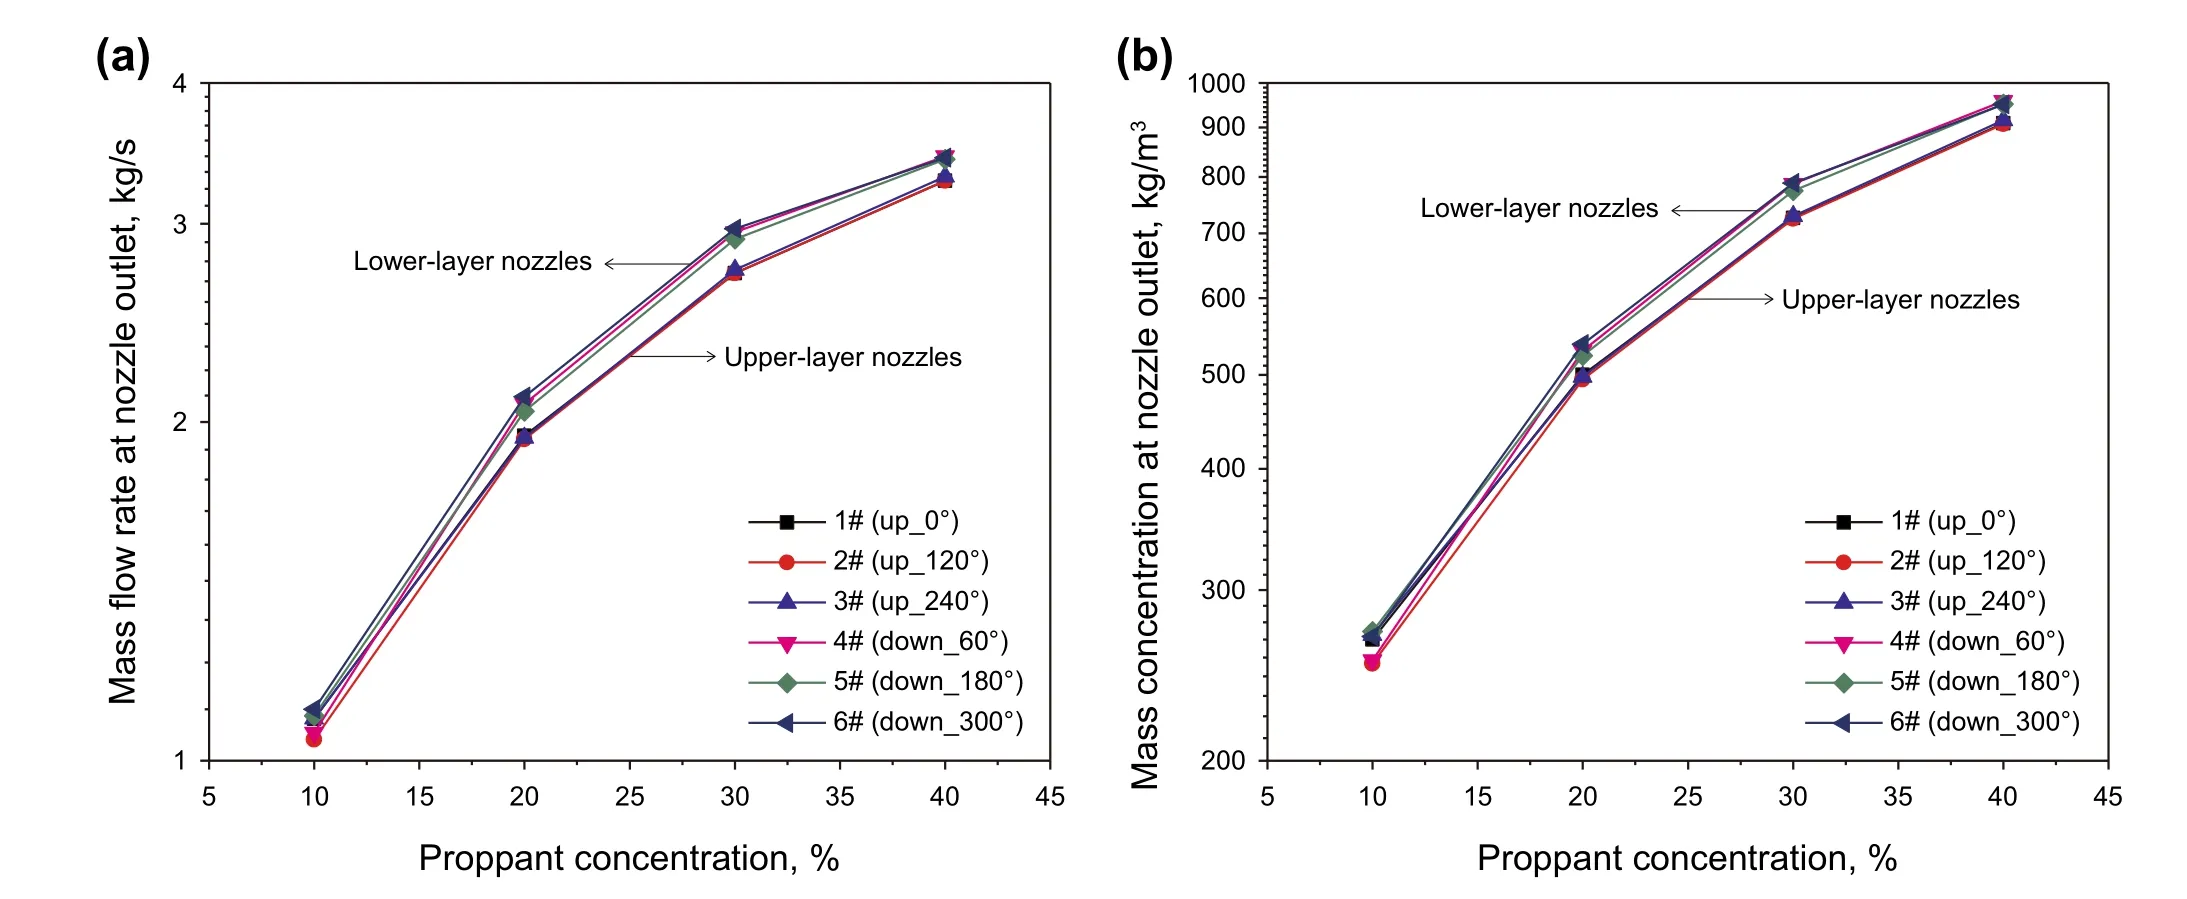
Fig. 9 a Mass flow rate of proppant at each nozzle outlet. b Mass concentration at each nozzle outlet
3.3 Sensitivity analysis
In order to find the dominant in fluence factors, a sensitivity analysis was designed on three controllable parameters including pumping rate, proppant size, and proppant concentration.
3.3.1 In fluence of pumping rate
As shown in Fig. 10, the erosion rates increase with pumping rate increasing that is caused by increasing impact velocity of proppant. Particularly, there seems to be a critical value of flow rate. Either average erosion rate or maximum erosion rate of lower nozzles rises to be almost a double value of upper nozzles if the flow rate exceeds the critical value(= 2.7 m3/min in this study). As mentioned before, more proppant flow through the lower-layer nozzles because of the inertia force. The inertia force increases with the increase in pumping rate. Thus, the lower-layer nozzles receive much more volume of proppant that results in a severe erosion.
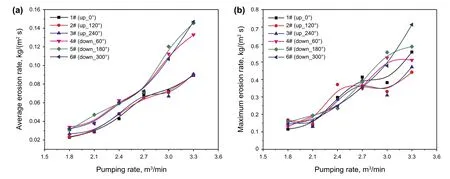
Fig. 10 In fluence of pumping rate on average erosion rate
3.3.2 In fluence of proppant size
Figure 11 shows that the erosion rate decreases with an increase in proppant size. Furthermore, the erosion difference between two-layer nozzles decreases with an increase in the proppant size. According to the Finnie erosion model,two reasons can be obtained: (1) The number of particles(N) becomes less with the increase in the proppant size for the given proppant concentration, which contributes to the reduction in the erosion rate. (2) The impact velocity of solid particles decreases with the increase in the individual size of the proppant due to the strong velocity-slip effect.

Fig. 11 In fluence of proppant size on average erosion rate
3.3.3 In fluence of proppant concentration
As shown in Fig. 12, the average erosion rate increases with the increase in the proppant concentration. It can be noted that there is no obvious difference in the average erosion rate between upper and lower nozzles. However, the maximum erosion rate performs quit differently between two-layer nozzles. For the base case, the maximum erosion of the upper-layer nozzle exceeds that of the lower-layer nozzle.
Tornado plots were made for two layers of nozzles to summarize the relative significance of various factors on the average erosion rate, as shown in Fig. 13. The tornado plots give a measure of the influence (in terms of the average erosion rate) with respect to the variation in one parameter while keeping the remaining parameters fixed.For instance, the pumping rate has the greatest influence on the erosion rate locating at either upper-layer nozzles or lower-layer nozzles. However, the second important factor is different for two layers of nozzles. The proppant concentration becomes the second important factor for the upper-layer nozzles. The proppant size is the second important factor for the lower-layer nozzles.

Fig. 13 Tornado plots of average erosion rate at a upper-layer nozzles and b lower-layer nozzles
3.4 Discussion
Our results con firm that severe erosion areas are located at the entry of nozzles. A ‘Rabbit’s ear’ erosion at the upperlayer nozzles and a half bottom loop erosion at the lowerlayer nozzles were found from inner erosion characteristics.Furthermore, there is a critical value of flow rate where the location of the maximum erosion rate changes from the upper-layer nozzles to the lower-layer nozzles. That means the lower-layer nozzles tend to fail before the upper-layer nozzles while the flow rate exceeds a critical value.
According to the Finnie erosion model, the erosion intensity is positively correlated with the impact angle and impact velocity of proppant. The erosion phenomenon can be explained by the special characteristics of flow field of abrasive waterjet. A schematic of tool erosion caused by abrasive waterjet fracturing is illustrated in Fig. 14. For the upper-layer nozzles, the streamline directly curves at the top of the nozzle. However, the lower-layer nozzles are extensively in fluenced by the bottom vortex where the streamline behaves as a U-turn from bottom to top. The special flow rate causes two severe erosion areas involving the half bottom loop at the lower-layer nozzle and the ‘Rabbit ear’ at the upper-layer nozzle. Particularly, the ‘Rabbit ear’ erosion may be cause from a preferred impact angle for erosion.
Particularly, the sand volume flowing through the lowerlayer nozzles is slightly bigger than that of the upper-layer nozzles. Moreover, the erosion distribution of the lowerlayer nozzles is more even than that of the upper-layer nozzles. Those may be one of reasons that the average erosion rate is maximum at the lower nozzles.
Another erosion mechanism is due to the inertia force of proppant. The inertia force makes proppant tend to flow through the lower-layer nozzles that is con firmed by the results as shown in Fig. 9. Thus, while the flow rate exceeds a critical value, a big enough momentum of proppant makes extra proppant pass through the lower-layer nozzles and causes the maximum erosion rate to locate at the half bottom of the lower-layer nozzles (Fig. 5c, d). This phenomenon is also explained as Coriolis effect (Surjaatmadja et al. 2008).Sensitivity analysis demonstrates that the pumping rate is a primary factor to in fluence the erosion rate.
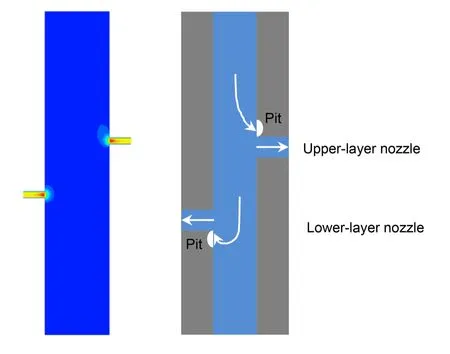
Fig. 14 Schematic of tool erosion caused by abrasive waterjet fracturing
4 Conclusions
A 3D CFD-based erosion model was proposed base on the Finnie erosion model to understand the tool erosion characteristics caused by abrasive waterjet fracturing. Field observations provide strong evidence of the erosion patterns and mechanisms interpreted by CFD simulation. The results indicate that severe erosion areas are located at the entry of nozzles. Evident erosion patterns are found including a ‘Rabbit’s ear’ erosion at the upper-layer nozzles and a half bottom loop erosion at the lower-layer nozzles. Erosion mechanisms attribute to the high-velocity fields at the entry of nozzles and the inertia force of proppant. Sensitivity analysis indicates that the pumping rate should be a primary factor in fluencing the erosion rate. This work provides more understanding of tool erosion behavior during hydrajet fracturing.
AcknowledgementsThis work was financially supported by the National Science and Technology Major Project (Nos. 2017 ZX05009-003 & 2016 ZX05028) and PetroChina Innovation Foundation (No.2018D-5007-0308). Authors thank Mr. Waleed Ali Khan for his assistance of text editing.
Open AccessThis article is licensed under a Creative Commons Attribution 4.0 International License, which permits use, sharing, adaptation, distribution and reproduction in any medium or format, as long as you give appropriate credit to the original author(s) and the source,provide a link to the Creative Commons licence, and indicate if changes were made. The images or other third party material in this article are included in the article’s Creative Commons licence, unless indicated otherwise in a credit line to the material. If material is not included in the article’s Creative Commons licence and your intended use is not permitted by statutory regulation or exceeds the permitted use, you will need to obtain permission directly from the copyright holder. To view a copy of this licence, visit http://creat iveco mmons.org/licen ses/by/4.0/.
- 石油科学通报的其它文章
- Thermal maturity evaluation using Raman spectroscopy for oil shale samples of USA: comparisons with vitrinite re flectance and pyrolysis methods
- Light hydrocarbon geochemistry: insight into oils/condensatesfamilies and inferred source rocks of the Woodford–Mississippian tight oil play in North‑Central Oklahoma, USA
- Deep‑water depositional architecture and sedimentary evolution in the Rakhine Basin, northeast Bay of Bengal
- A two‑step method to apply Xu–Payne multi‑porosity model to estimate pore type from seismic data for carbonate reservoirs
- Nonlinear amplitude versus angle inversion for transversely isotropic media with vertical symmetry axis using new weak anisotropy approximation equations
- Numerical simulation and dimension reduction analysis of electromagnetic logging while drilling of horizontal wells in complex structures

