Optimizing the ratio of the spike to sample for isotope dilution analysis: a case study with selenium isotopes
· · · · ·
Abstract Isotope dilution (ID) method has been widely applied to studies of elemental speciation and certification of the concentrations of geological reference materials.One of the key factors restricting the application of the ID method is the difficulty in identifying the optimal ratios of the isotope tracer(spike)to sample(S/N)and in estimating the error propagation.Here,using Se isotope as an example and employing a Monte Carlo method, we found that the optimal choice of spike and S/N are 77Sespike and 0.7,respectively. The S/N in the range from 0.1 to 4 can produce sufficiently low errors (<0.4 %). Extending this method to other elements such as Cr, Fe, Ni, Sr, Cd and etc., their optimal spike and S/N were also presented.According to the optimized parameters of Se, we determined the Se concentrations of geological reference materials (GRMs) by thiol cotton fiber (TCF)-hydride generation ID-MC-ICP-MS. The relative standard deviation is <5 %, and the detection limit is reduced to 0.1 ng/g. Most of the measured concentrations are consistent with those recommended by IGGE or reported previously. For some GRMs, discrepancies (e.g. 6.90 % for GSS-5) exist between our measurements and previous ones, which can be explained by the inhomogeneity of GRMs and/or the different digestion, purification and measurement methods among laboratories.
Keywords Isotope dilution method · Error propagation ·Mento Carlo · Se concentration · Geological reference materials
1 Introduction
Isotope dilution (ID) has become a common method for determining concentrations of elements by measuring isotope ratios in spiked samples(Harte et al.2004;Inagaki et al.2006). It is suitable for elements with two or more stable isotopes (Stracke et al. 2014) and has also been extended to other areas, such as determination of organic matter complex and elemental speciation analysis(Huo et al.2000;Reyes et al.2006;Renedo et al.2017).Currently,ID method is predominantly employed in three research fields:(1)speciation analysis of organic(e.g.organic selenium)and inorganic(e.g.Cr,Sb,and Hg)pollutants in the environment(Huo et al. 2000; Amereih et al. 2013; Unceta et al. 2016;Renedo et al. 2017); (2) determination of elemental concentrations in geological and environmental samples with low content(e.g. ≤ppt level)(Obata et al.2006;Lam et al. 2010; Lee et al. 2011; Rapp et al. 2017; Garcı´a-Ruiz et al. 2011; Kleckner et al. 2017); (3) certification of elemental concentrations and isotope ratios in geological/environmental reference materials(Cotta and Enzweiler 2013;Wang and Becker 2014; Stracke et al. 2014; Kirchenbaur et al.2018;Beranoaguirre et al.2019).
Compared with other methods(conventional internal and external standardization methods)of determining elemental concentrations,the ID method has several advantages.First,it can provide high-precision and high-accuracy data even for samples with concentrations down to ppt levels (e.g. the analytical precision of87Rb/87Sr and147Sm/144Nd were less than 0.2 % (RSD, relative standard deviation) and 0.09 %(RSD),respectively)(Waight et al.2002;Le Fe`vre and Pin 2005; Obata et al. 2006). Second, it can lower the errors introduced by signal drift, matrix and memory effects, and isobaric interferences. Additionally, it is tolerant of incomplete recovery during sample digestion and purification(Fassett and Paulsen 1989).However,ID method still faces some difficulties. Although the development of inductively coupled plasma—mass spectrometry(ICP-MS)allows easy calibration of the concentration and isotope composition of spikes(sample-standard-sample bracketing,or SSB,by Zhu et al.2000 and Liu et al. 2017; inverse isotope dilution, by Henrion 1994),the error propagation in ID method is difficult to estimate because it changes with the spike to sample ratio(Long 1966).Thus,an optimized S/N is critical for obtaining high-quality data,especially for low-content samples.
At present, the estimation of error propagation can be achieved in two ways. One is to calculate directly the relative standard deviation(RSD)of measured data.The other is to find the optimal S/N by simulating the propagated errors through theoretical models with different S/N. Comparing with the first one, the theoretical simulation is simple and fast, with no need to consume a lot of spikes.Hence,it has been widely employed in many studies to optimize the ratio of spike to sample(Long 1966;de Jong et al.2008).Hoelzl et al. (1998) and Sun et al. (2001) used a linear error propagation method to optimize the S/N for Cd and Os isotope dilution analysis. However, a linear error propagation method is relatively complex (Hoelzl et al. 1998; Huo et al. 2000),requiring multi-step derivations. Thus,we here use a simple Monte Carlo method to obtain the optimized S/N for Se concentration measurement with ID method.Meanwhile, the optimal S/N for other elements such as Cr,Fe, Ni, Sr, Cd, Sn and etc. were also given.
Selenium(Se)is an essential nutrient for human health,but some Se species are potentially toxic.With increasingly wide applications of Se in geology, geochemistry and environmental sciences(Zhu et al.2008a,2012,2014;Kleckner et al.2017), reliable Se concentration data are critical. Selenium has six stable isotopes:74Se (0.89 %),76Se (9.37 %),77Se(7.64 %),78Se(23.77 %),80Se(49.61 %)and82Se(8.73 %),respectively. Therefore, the ID method can be applied to determining Se concentrations. Here we use a Monte Carlo method to obtain the optimized S/N, and then determine the Se concentrations of various geological reference materials(GRMs). These data provide new constraints on the concentrations and homogeneity of Se in these GRMs.
2 The principle of isotope dilution analysis
During isotope dilution analysis,a spike(an isotope tracer)with known isotope composition and concentration is mixed with the sample. The exact concentrations of a sample can be calculated with measured isotope compositions of the spike-sample mixture.The calculation formula(derivation in Stracke et al. 2014) is shown in Eq. (1):

where a,b represents two isotopes(e.g.77Se and78Se).If b(77Se)is selected as a spike isotope,then a is the reference isotope(78Se)(i.e.the denominator in isotope ratios);RMis a/b in the mixture, and AaS, AbS, AaN, AbNare the abundances of isotopes a and b in spike and sample,respectively.N and S are molar masses of sample and spike, respectively,defined as:

where MSand MNare the relative atomic masses in the spike and sample, respectively. msand mN, and CNand CSrefer to the weight and concentration of sample and spike,respectively. To obtain the sample mass N, RMis required(Eq. 1) and can be measured on a mass spectrometer.Isotope measurement on a mass spectrometer is subject to mass discrimination(Albare`de and Beard 2004),which can be corrected for by measuring standard solutions(Zhu et al.2000)or doping samples with another element(e.g.doping Tl for Pb isotope measurement) with known isotopic compositions (White et al. 2000).
3 Optimizing the spike sample ratio
3.1 Establishing error model
Systematic errors during isotope measurement are mainly Johnson noise and shot noise (Dodson 1963). These systematic errors account for 78%,85%and 96 %of total errors during δ57Fe, δ66Zn and δ114Cd measurement on an MC-ICP-MS, respectively (John 2012). Hence, when optimizing the spike sample ratio, it is necessary to establish an error model to predict the error generated during mass spectrometry (Rudge et al. 2009; John 2012).Johnson noise (J) and shot noise (d) are described by Eqs. (4) and (5) (Dodson 1963; Rudge et al. 2009):

In Eq. (4), k is the Boltzmann constant(1.3806504 × 10⁻²³JK-1); b is the bandwidth (i.e. the transport number of ions per second); R represents the resistance of an amplifier(1011Ω);T is the temperature of the instrument when it is operated and here it is set to T = 300 K. In Eq. (5), e is the elementary charge(1.602176487 × 10⁻¹⁹C);b is the inverse of transmission time, with a default value of 1/8 s (1/5 s to 1/20 s in Nu Plasma II). The errors caused by Johnson and shot noises can be obtained (John 2012):

where μ is the beam intensity of a certain isotope. The ultimate analytical uncertainty will have components derived from isobaric and polyatomic interferences,matrix and memory effects. However, these errors are not included here because they do not influence optimizing S/N.Therefore, the error model can be written as:

3.2 Error propagation calculation
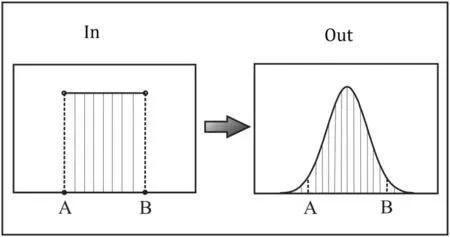
Long (1966) first demonstrated that the error propagation could occur in calculating elemental concentrations using the ID method, and it could be simulated by linear error propagation. Using this model, the optimal S/N can be obtained(Hoelzl et al.1998;de Jong et al.2008).However,the linear error propagation model is difficult to implement because it involves extremely complicated mathematical computation, including a large number of differentials and matrix calculations, especially in speciation ID analysis(Adriaens et al.1993).Here we introduce a simple Monte-Carlo method to calculate error propagation.First,counting errors are calculated through Eq. (8). Second, these errors are introduced into a set of ion beam intensities.Third,for each simulation, ion beam intensities are randomly picked to calculate Rm (corresponding to the measured value by instrument, without mass discrimination corrections), and this simulation is repeated 1000 times, resulting in a set of normally distributed N values according to Eq. (1), where the RSD for N can be calculated (Fig. 1). The distribution of measured concentrations by MC-ICPMS was confirmed to be consistent with those data simulated by Monte Carlo model (Belshaw et al. 1998).
3.3 The selection of spike and reference isotopes
According to previous studies (Huo et al. 2000; Siebert et al. 2001; Reyes et al. 2006; Kleckner et al. 2017,Table 1), the criteria for selecting the spike isotope include:(1)it should have a low abundance in nature;(2)it should have less or no isobaric and polyatomic interferences; and (3) it can be easily purified. For the reference isotope, isotopes with high abundances and fewer interferences are more likely to be selected (Table 1).
For Se isotopes,80Se and78Se are the most abundant,and80Se is susceptible to40Ar40Ar+interferences on MCICP-MS;thus,they should not be used as an isotope spike.74Se has lower abundance and prone to74Ge+interference(35.95 %);it is also more difficult to be enriched than other Se isotopes. Hence,76Se,77Se and82Se are better candidates for spikes, and78Se is a good candidate for the reference isotope.
3.4 Optimizing the ratios of spike to sample
As more than one spike isotopes can be identified in Table 1 for a certain element,exactly which one to choose needs to be optimized. In this paper, we used the Monte Carlo method to find the single spike isotope that leads to the smallest error (Fig. 2). If78Se is used as the reference isotope, the error propagation in N caused by82Sespikeis the largest, followed by76Sespikeand77Sespike. Thus,77Sespikeis recommended as the best spike isotope, followed by76Sespikeand82Sespike.

Fig. 1 A simple schematic diagram showing the Monte Carlo method: using a set of uniformly distributed data (beam intensity +error) as input to generate a set of normally distributed data(Rm) as output

Table 1 Common spike isotopes and isotope pairs used for isotope dilution analysis

Fig. 2 The best choice for the spike isotope base on the Monte Carlo optimization method
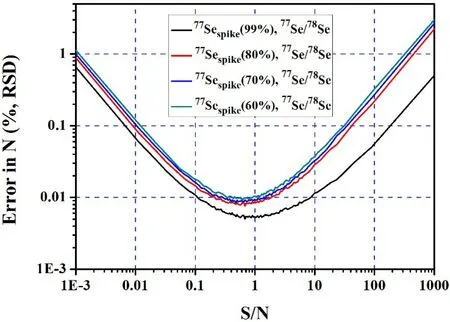
Optimizing S/N can effectively reduce the errors introduced in the calculation of Se concentration during ID analysis. Previous studies found that the propagated error is a function of S/N(Long 1966;Hoelzl et al.1998).When the S/N value changes from - ∞to +∞, propagated error exhibit a U-shaped curve (Fig. 3). Hence, the best S/N is located at the bottom of the curve.The specific steps for optimizing S/N are: (1) for each S/N, Monte Carlo simulation was performed 1000 times;(2)one RSD of N is calculated from these 1000 simulations; (3) identify the best S/N with the smallest RSD. The S/N for Se is optimized to be 0.7(Fig. 3).For the error of N to be<0.01 %(RSD),the range of S/N 0.1–4 is sufficient.In addition,the error and optimal S/N were insensitive to the purity of the77Se spike (Fig. 4).

Fig. 3 Comparison between simulated and measured errors at different S/N

Fig. 4 The error and optimized S/N at different purity of 77Se spike
In order to cross-check our simulation, we spiked NIST 3149 (Table 2) with different S/N ratios and measured the isotope ratios of each mixture several times(more than 4 at each S/N ratio) to obtain the error (%, RSD) of N. The optimal S/N identified by Monte Carlo method is consistent with the measured data(Fig. 3),confirming that the Monte Carlo optimization method is reliable.
3.5 Identify spike isotopes and optimizing the S/N for other elements
For other 62 elements in the periodic table with two or more stable isotopes, we selected 10 common elements(Cr, Fe, Ni, Zn, Sr, Cd, Pt, Hg, Sn, and Pb) to identify the optimized spike isotope and S/N using the Monte Carlo error propagation method (Fig. 1).For Cr,Ni, Sn,and Hg,the propagated error is independent of the choice of the spike and reference isotopes (Fig. 5). In contrast, for Fe,Zn, Sr, Cd, Pt, Pb, the propagated error varies drastically with different spike and reference isotopes (Fig. 5). However, when the best spike and reference isotope was selected, the introduced error is smallest (Fig. 5). For example,as shown in Table 3,we suggest that53Crspikeand53Cr/52Cr,57Fespikeand57Fe/56Fe (medium/high-resolution mode), and61Nispikeand61Ni/60Ni, etc. can be used as the best spike and isotope pair, respectively. The corresponding to optimal of S/N was listed in Table 3.Since the purity of spike is generally higher than 90 % (Table 3), and the effect of spike purity on optimized S/N is small (Fig. 4).The results of optimization in this paper can be extended to different spike purities.
4 Applying the optimized parameters to determine Se concentration in GRMs
4.1 Materials and procedures
All acids, including HNO3, HCl, and HF, were purchased from the Beijing Institute of Chemical Reagents, China.HNO3and HCl were purified twice by sub-boiling distillation (SavillexTMDST-1500) while HF was distilled only once. The analytical grade H2O2(30 %), NaOH, and NaBH4(98 %, pellets) were obtained from Thermo Fisher Scientific.77Se-enriched spike (20 mg) and NIST SRM 3149 (10000 μg/mL) standard solutions were purchased from ISOFLEX, the USA and the National Institute of Standards and Technology (NIST) (Table 2), respectively.All reagents were prepared using ultra-pure Milli-Q water prepared by a Milli-Q Element system (Millipore, USA).15 mL SavillexTMPFA beakers and PTFE vessels were cleaned with HNO3(1:1), HCl (1:1) and MQ water.
The reference materials, GSH-1(Human hair), GSS-5 and GSS-6(Soil),GSD-5a, GSD-10,GSD-21 and GSD-23(stream sediment), and SGR-1b (Shale) were selected for Se concentration determination.Among them,SGR-1b was purchased from the United States Geological Survey(USGS). GSH-1, GSD-5a, GSD-21, GSD-23 and GSS-5,GSS-6 were obtained from the Institute of Geophysical Geochemistry Research (IGGE) of the Chinese Academy of Geological Sciences (CAGS).

Table 2 The isotope composition of NIST 3149 and 77Se spike


Table 3 Optimized S/N ratios for 10 common elements

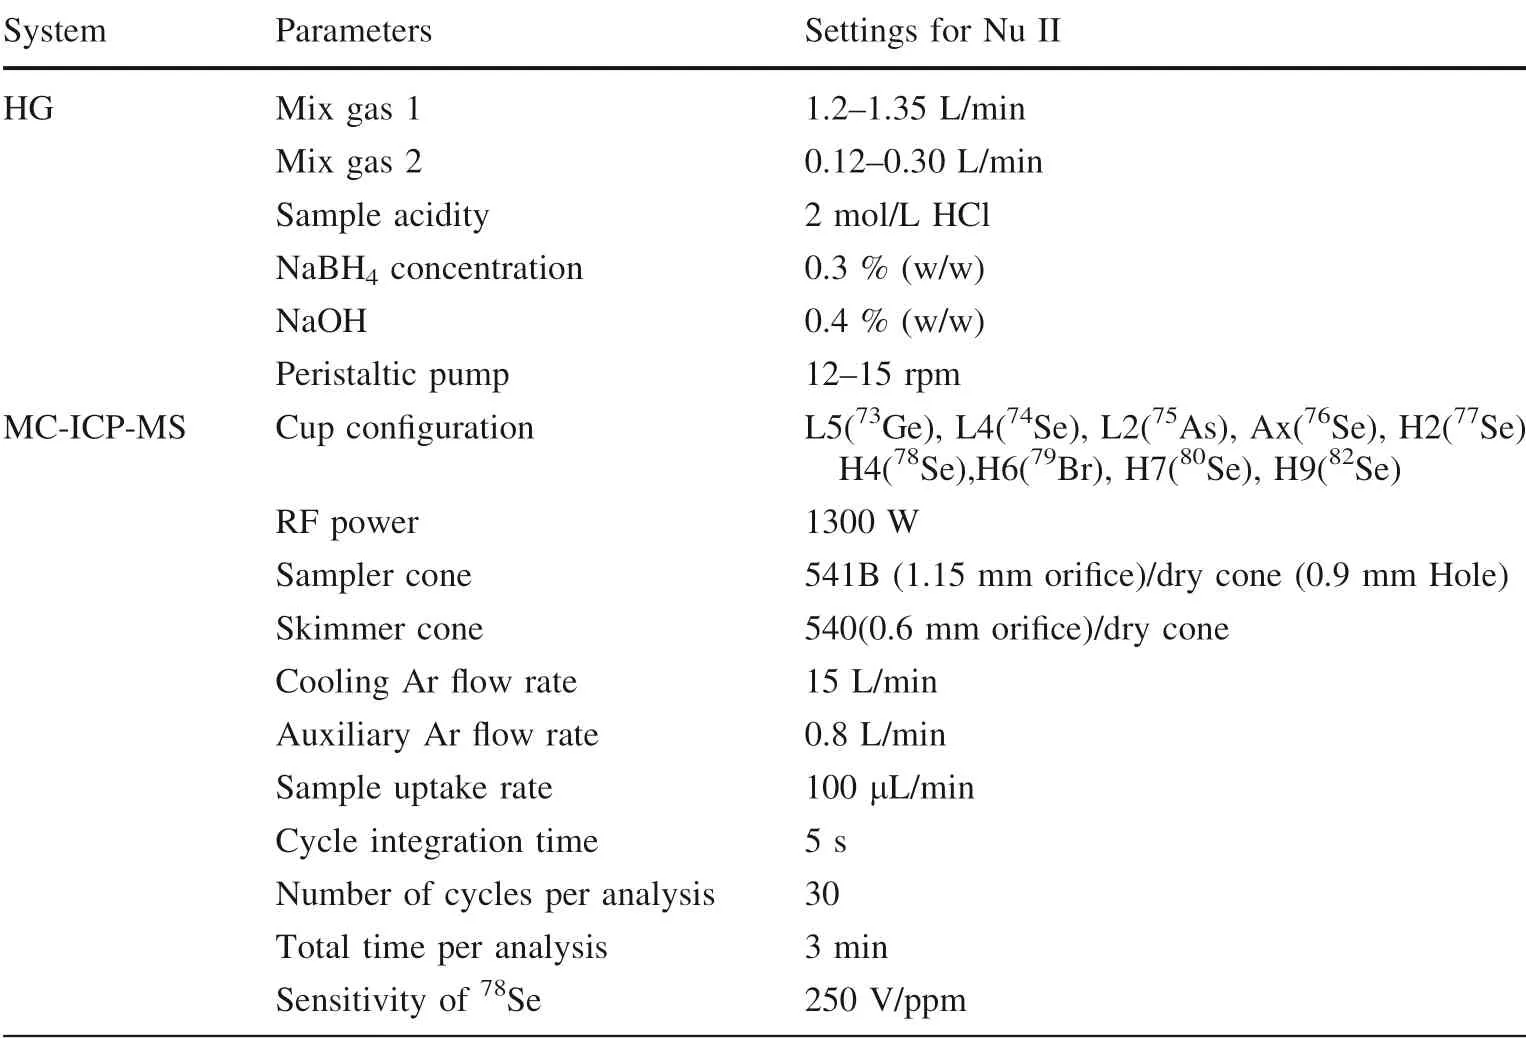
Table 4 Measurement parameters for MC-ICP-MS,hydride generation (HG)systems
Sample digestion procedures were similar to those described in Zhu et al. (2014). 100 ± 1 mg powders were accurately weighed into 30 mL PTFE bomb liner vials.HNO3–HF–H2O2mixed acids were used to digest the samples at 185 ± 5 °C for 36–48 h.After cooling,1 mL of 30 %H2O2was added into the PTFE liner vials,and heated on a hot plate at 90 °C to evaporate the solution to incipient dryness. Finally, 1 mL of 7.8 M HNO3was added to dissolve the residue, and the solution was diluted with 4 mL Milli-Q water. Before sample purification, an appropriate amount of the77Se spike was mixed with completely digested samples in PFA beakers to maintain S/N ≈0.7(the range from 0.1 to 4). However, due to errors of Se concentration estimation, the S/N sometimes varied from 0.32 to 0.93, which was within the optimal range of 0.1–4(see Sect. 3.4). 0.14 g TCF was weighed and loaded into polypropylene columns, and then 30 mL samples with 0.8 M HCl were loaded onto the TCF.Detailed procedures can be found in Zhu et al. (2008a, b, 2014).
4.2 Se concentration measurement
The concentration and isotope ratios of the77Se spike were calibrated by the inverse isotope dilution method(Table 2)[i.e. calculating the Se concentration and isotopic ratio of the spike by measuring a mixture of this spike and a standard such as NIST SRM 3149 that has a known concentration and isotopic composition (Table 2)]. Selenium isotope ratios of spiked GRMs were measured on Nu Plasma II MC-ICP-MS(Nu II)at the State Key Laboratory of Environmental Geochemistry,Institute of Geochemistry,Chinese Academy of Sciences(IGCAS).The MC-ICP-MS is equipped with 16 Faraday cups connected to 1011Ω resistor amplifiers. The cup configuration and other parameters are listed in Table 4. The measurement of77Se/78Se was prone to polyatomic interferences(40Ar37Cl+and76SeH+on77Se,40Ar38Ar+and77SeH+on78Se). Thus, an on-peak-zero method and a formula of77or78Seture=77or78Semeasure–76or77Se × f, where f = SeH+/Se, were used to deduct interferences caused by40Ar37Cl+and40Ar38Ar+, and76SeH+and77SeH+,respectively. Mass bias occurring during determining Rmwas also corrected for by a standard-sample-bracketing method (Zhu et al. 2000). The samples were introduced into the plasma as SeH2by an on-line continuous-flow hydride generator. A detailed description can be found in previous studies (Rouxel et al. 2002; Ellis et al. 2003).
4.3 Blank and detection limits
The total Se blank from sample digestion to the purified Se solution is generally less than 0.003 ng. This value is only 0.009%of the minimum amount of Se(38 ng).Hence,the blank contribution to the samples can be considered negligible.If the detection limit is defined as 3 times the blank,with77Se is added in a certain quantity, then it was estimated to be ≤0.010 ng/g.
4.4 Selenium concentrations in geological reference materials
Eight geological reference materials(GRMs)were selected to determine Se concentrations (Table 5). The Se concentrations in GSH-1 (0.65 ± 0.01 μg/g), GSD-5a(0.38 ± 0.04 μg/g) and GSD-23 (0.74 ± 0.01 μg/g) were consistent with the recommended values (0.60, 0.37 and 0.69 μg/g, respectively) (Fig. 6c, Table 5). Seconcentration in GSD-10 was 0.43 ± 0.04 μg/g, slightly higher than the certified value of 0.28 μg/g by IGGE and reported the value of 0.33 ± 0.01 μg/g by Sanzolone and Chao (1987). In contrast, Se concentration in GSD-21 was 0.96 ± 0.04 μg/g, lower than the recommended concentration (Fig. 6b, Table 5). Se concentrations for soil samples GSS-5 (1.35 ± 0.02 μg/g) and GSS-6(1.12 ± 0.04 μg/g) were lower than the recommended values obtained from IGGE.The measured result of GSS-6 was identical to the average value of 1.12 μg/g reported by Zhang et al. (2007). Reported Se concentrations for SGR-1b varies significantly in published literatures, from 2.7 to 4.0 μg/g (Savard et al. 2009; Balaba and Smart 2012), and our measured result (2.77 μg/g) was close to that reported by Savard et al. (2009) using TCF- instrumental neutron activation analysis (INAA) (Table 5).

Table 5 Selenium concentrations in geological reference materials measured by ID-HG-MC-ICPMS

Fig. 6 The results obtained by ID-HG-MC-ICPMS versus the recommended mass fractions from previous studies
Several explanations can be offered to account for these discrepancies. First, different batches of GSD-10 are inhomogeneous. Second, Se is easy to be lost during evaporation. The ID method used in this paper can effectively correct for the loss while previous measurements did not use the isotope dilution method.Third,Previous studies mainly used traditional methods (e.g. AAS, AFS, Table 5)to determine the concentration of Se. Compared with ID method, these methods have some defects, such as large uncertainties and vulnerability to instrument instability.Fourth, previous studies did not separate Se from sample matrices (Table 5), leading to interferences by other elements. For instance, Cu2+can reduce the Se signal while Pb2+can increase it when using HG-Atomic fluorescence spectrometer(AFS)(Zhao et al.2019).The Pb/Se ratios in GRMs GSS-5 and GSS-6 were 414 and 341, respectively.Therefore, the higher Se reported by previous studies for these two GRMS may be due to interferences.In brief,the discrepancies between different studies (Fig. 6) may be caused by either sample inhomogeneity and/or different digestion, purification and measurement methods adopted by different laboratories. Therefore, a unified reliable method for Se concentration determination should be established.
5 Conclusions
Se spike isotope and S/N were optimized using a Monte Carlo method. We suggest77Sespikeand77Se-78Se as the best spike isotope and isotope pair. Optimal S/N and acceptable range were calculated to be 0.7 and 0.1–4,respectively. 10 other elements with two or more stable isotopes such as Cr, Fe, Zn, and Ni, etc. were also listed the best spike and isotope pair.
The Se concentrations in eight geological GRMs were measured by TCF-ID-HG-MC-ICP-MS. The analytical precision ranged from 0.1%to 5%.The procedural blank and detection limit of Se were 0.003 ng and <0.01 ng/g,respectively. Most of our measured Se concentrations of GRMs were generally consistent with previous values. For sample GRMs, discrepancies exist between our measurements and previous values, possibly due to sample inhomogeneity or different analytical protocols.
AcknowledgementsThis work was supported by Natural Science Foundation of China (No. U1612441, 41673017). We would like to thank Dr. Xiangli Wang at University of South Alabama for improving English and suggestions. The authors also thank Drs. Jing Wang and Li Zeng for assistance with Se isotope determination.
Compliance with ethical standards
Conflicts of interestThe authors declare that they have no conflict.
- Acta Geochimica的其它文章
- High oxygen fugacity magma: implication for the destruction of the North China Craton
- The effect of pH on the sorption of gold nanoparticles on illite
- Methane production from rice straw carbon in five different methanogenic rice soils: rates, quantities and microbial communities
- Antimony removal from wastewater by sulfate-reducing bacteria in a bench-scale upflow anaerobic packed-bed reactor
- Ecological risk assessment of surficial sediment by heavy metals from a submerged archaeology harbor,South Mediterranean Sea,Egypt
- Discrimination geochemical interaction effects on mineralization at the polymetallic Glojeh deposit, NW Iran by interative backward quadratic modeling

