CFD/CSD-based flutter prediction method for experimental models in a transonic wind tunnel with porous wall
Tongqing GUO, Dixio LU, Zhiling LU,*, Di ZHOU, Binin LYU,Jingpeng WU
a Key Laboratory of Unsteady Aerodynamics and Flow Control, Ministry of Industry and Information Technology, Nanjing University of Aeronautics and Astronautics, Nanjing 210016, China
b China Aerodynamics Research and Development Center, Mianyang 621000, China
c Shenyang Aircraft Design and Research Institute, Shenyang 110035, China
KEYWORDS CFD/CSD;Experimental models;Flutter;Porous wall;Transonic wind tunnel
Abstract To predict the flutter dynamic pressure of a wind tunnel model before flutter test, an accurate Computational Fluid Dynamics/Computational Structural Dynamics (CFD/CSD)-based flutter prediction method is proposed under the conditions of a 2.4 m×2.4 m transonic wind tunnel with porous wall.From the CFD simulations of the flows through an inclined hole of this wind tunnel, the Nambu’s linear porous wall model between the flow rate and the differential pressure is extended to the porous wall with inclined holes, so that the porous wall can be conveniently modeled as a boundary condition.According to the flutter testing approach for the current wind tunnel,the steady CFD calculation is conducted to achieve the required inlet Mach number. A timedomain CFD/CSD method is then employed to evaluate the structural response of the experimental model,and the critical flutter point is obtained by increasing the dynamic pressure step by step at a fixed Mach number. The present method is applied to the flutter calculations for a vertical tail model and an aircraft model tested in the current transonic wind tunnel.For both models,the computed flutter characteristics agree well with the experimental results.
1. Introduction
In the transonic flight regime, the shock waves and the associated interactions between shock wave and boundary layer result in nonlinear aeroelastic effects, such as the transonic dip and limit cycle oscillations.Both numerical and experimental investigations of transonic flutter are challenging. For flutter computations,the traditional frequency-domain method1-3employs the linearized aerodynamic theory,4,5which neglects the body effect and cannot handle transonic nonlinear problems. In recent decades, the more accurate time-domain Computational Fluid Dynamics/Computational Structural Dynamics (CFD/CSD) method coupling Euler/Navier-Stokes(N-S) equations solver with structural model was proposed for transonic flutter computations.1,6-9Meanwhile, wind tunnel test techniques were developed to conduct transonic flutter experiments for aircraft components and even a whole aircraft.10-13On the one hand, a flutter prediction method can be validated and improved through experimental data. On the other hand, in order to protect an experimental model from damage,numerical prediction of the flutter dynamic pressure is needed before the wind tunnel flutter test. Therefore, it is necessary to develop an accurate flutter prediction method for the flutter model tested in a transonic wind tunnel.
The wall interference has a huge effect on the transonic wind tunnel test and is a leading application of CFD.14In recent years,CFD has been frequently employed to investigate the transonic wall interference.15-17Generally, a transonic wind tunnel has porous or slotted walls at the test section in order to alleviate the blockage effect, shock wave reflection,etc. The permeable wall greatly affects the wind tunnel flow field,and hence it must be properly modeled.As for the porous wall concerned in this study, since it is not practical to solve the flow through the porous wall directly with fine mesh, the wall pressure signature method and porous wall flow model are commonly used. The wall pressure signature method uses the measured pressure distributions on the ventilated wall as the boundary conditions.18However, it is not convenient and the number of measurement points affects the numerical accuracy. Typical porous wall models include the Harloff’s model19,20and the Nambu’s model.21The former was designed for the bleed hole of supersonic air-intake that causes a large differential pressure across the porous wall. Nambu et al.21have pointed out that the Harloff’s model is not suitable for the transonic wind tunnel condition where the differential pressure is rather small. Under the conditions of the JAXA 2 m×2 m Transonic Wind Tunnel (JTWT), they employed CFD to analyze the flows through a normal hole in different flow conditions and hole shapes, and then established a linear model between the flow rate and the differential pressure.Both their experiment and direct CFD computation have suggested that the linear model has enough accuracy for the flow simulation of wind tunnel with porous wall.The Nambu’s model can be used for arbitrary porous and flow conditions without any parameter adjustment and makes the CFD analysis a more practical tool for the wall interference problem. It has been successfully applied to the 2D and 3D wall interference analyses.22-25
To our knowledge, available wind tunnel wall interference studies only focus on the aerodynamic parameter correction.In this work, the Nambu’s linear model will be extended to the porous wall with inclined holes under the conditions of a 2.4 m×2.4 m transonic wind tunnel by using CFD analyses.Then a CFD/CSD-based flutter prediction method for experimental models will be established according to the corresponding flutter testing approach.Finally,the proposed method will be applied to a vertical tail model and an aircraft model tested in the 2.4 m×2.4 m transonic wind tunnel.
2. Flutter experiments in a 2.4 m×2.4 m transonic wind tunnel
As shown in Fig. 1,we conducted the vertical tail and aircraft flutter experiments in a return-flow variable-pressure transonic wind tunnel with a 2.4 m×2.4 m test section.13The test section is 7 m long and is surrounded by a plenum chamber.The upper and lower walls are porous with 60° inclined holes of a diameter of 24 mm,and the other two walls are solid.The porosity defined as the ratio of hole to wall area is 4.8%. The testing Mach number and the dynamic pressure of wind tunnel flow can be changed independently. The plenum chamber is equipped with an air bleed system. When the testing Mach number is larger than 0.95, the air bleed system is opened to control the Mach number.
The vertical tail model was installed on the lower porous wall as shown in Fig. 1. This scaled model was designed through a set of dynamic similarity laws and was made up of aluminum alloy webs and ribs, fiberglass skins and foam in cavities. The length and height of the body equal 2.49 m and 0.34 m, respectively, and the vertical tail span is 0.98 m. The aircraft model was suspended by a Floating Suspension System (FSS) with its wings parallel to the porous walls. It was constructed by using fiberglass webs and ribs, fiberglass skins and foam in cavities.The body length is 2.45 m,the wing span is 1.63 m, and the mass equals 56 kg. More details about FSS can be found in Ref. 26.
To obtain the flutter dynamic pressure at a fixed Mach number, the dynamic pressure was increased step by step by changing the total pressure. At each dynamic pressure step,the total pressure,the static pressure and the total temperature were measured, the Mach number, the dynamic pressure and the density were computed, and the time history of model vibration signals was monitored. At a fixed Mach number,the dynamic pressure was increased till flutter was detected.One may refer to Ref.13 for more details about the flutter test apparatus and procedure.
The total temperature is about 300 K and 280 K for the vertical tail and aircraft flutter experiments,respectively.Tables 1 and 2 list the experimental results of two models, where Ma stands for the Mach number, QFdenotes the flutter dynamic pressure, and fFrepresents the flutter frequency.
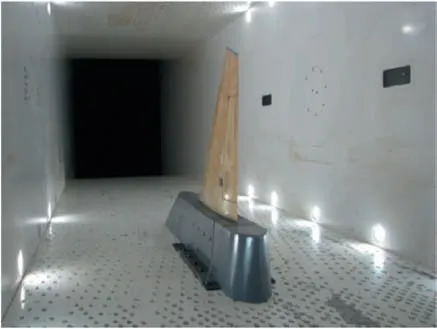
Fig. 1 Flutter experiment in a 2.4 m×2.4 m transonic wind tunnel.

Table 1 Experimental results of vertical tail model.

Table 2 Experimental results of aircraft model.
3. CFD solver
3.1. Hybrid RBF-TFI dynamic grid generation method
After the initial multi-block structured grid is generated for the undeformed configuration, an efficient hybrid Radial Basis Functions-Transfinite Interpolation (RBF-TFI) method27is applied to the dynamic grid generation, which combines the high interpolation accuracy of RBF with the high computational efficiency of TFI. In RBF-TFI, all block vertexes with known deformations are selected as the center points and the grid deformations of all block edges are accurately calculated by RBF.Then,an arc-length-based 2D TFI is used to evaluate the grid deformations of all block faces.Finally,an arc-lengthbased 3D TFI is employed to compute the grid deformations of points inside all blocks. As demonstrated in Ref. 27, for a complex 3D configuration with millions of grid cells, the dynamic grid was generated automatically in several seconds by RBF-TFI and the quality of the deformed grid maintained the same level as that of the initial grid.
In a region with complex deformation, the original RBFTFI may fail if the center points of RBF are too few to reflect the real deformation. Instead of only choosing block vertexes as the center points, an effective improvement is to increase the number of center points properly. In this work, the initial multi-block grid is coarsened in a specified ratio to obtain a new coarse grid, and all grid points with known deformations are then selected as the center points.
3.2.Steady/unsteady aerodynamic force calculations using N-S equations
Written in the time-dependent integral form for a moving control volume Ω with a surface element dS,the N-S equations read

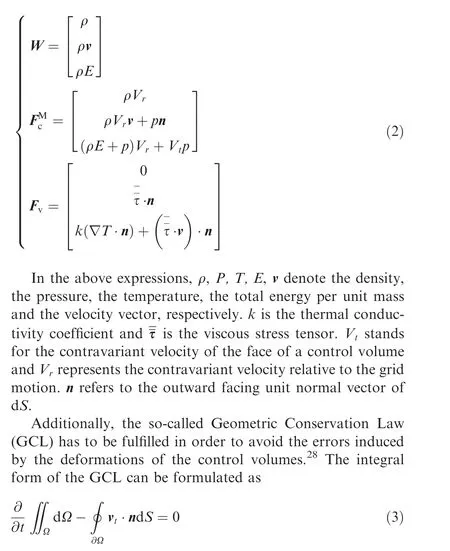
with vtbeing the grid velocity vector.
The cell-centered finite volume method is applied to the spatial discretization of Eq. (1). The 5-stage Runge-Kutta time-stepping with a local time step29and the dual timestepping approach28are employed in the steady and unsteady flow simulations, respectively. The Spalart-Allmaras oneequation turbulence model30is adopted in the turbulence modeling.The N-S solver is parallelized for higher computational efficiency.This CFD solver is developed by our research group and has been frequently applied to the aerodynamic and aeroelastic calculations.8,31-34
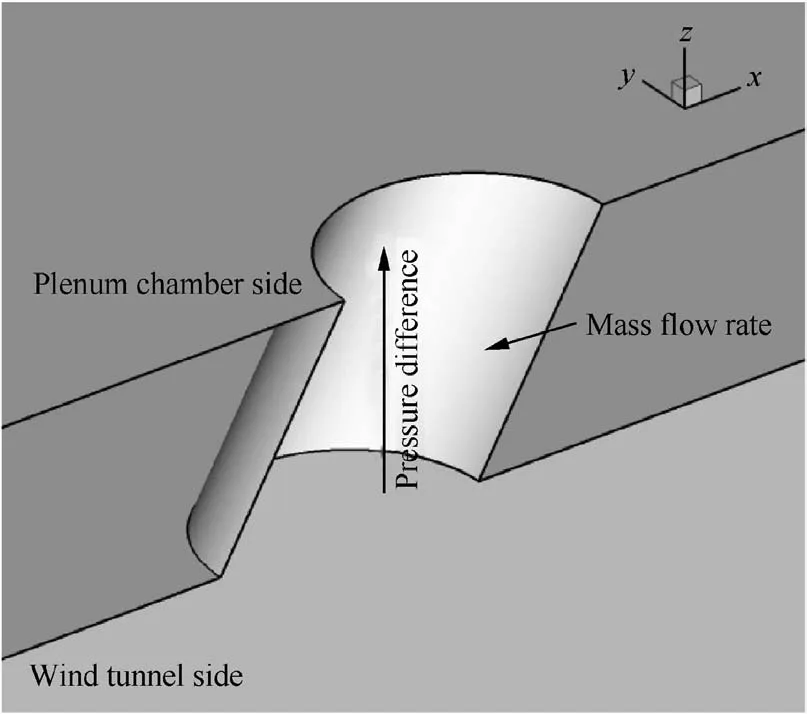
Fig. 2 Schematic of CFD analysis for flow through a hole.
3.3. Linear model for porous wall with inclined holes
Fig. 2 shows the schematic of CFD analysis for the flow through a hole. The differential pressure between both sides of the porous wall of a transonic wind tunnel is small. Under the small differential pressure, Nambu et al.21employed CFD to analyze the flows through a normal hole of JTWT in different flow conditions and hole shapes, and then proposed the following linear relation between the flow rate and the differential pressure:
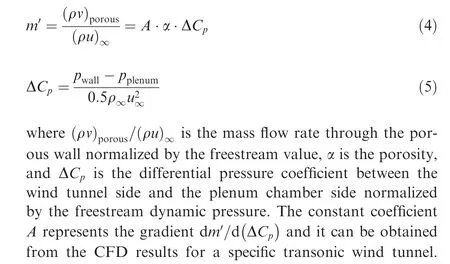
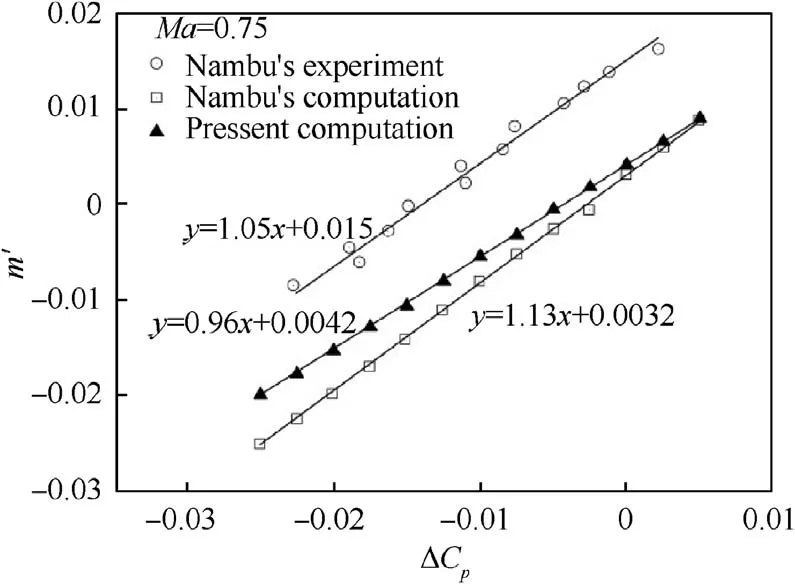
Fig. 3 Variation of mass flow rate with differential pressure coefficient for JTWT.

Nambu et al.validated their linear model by conducting an experiment.21As displayed in Fig. 3, both their computed results and experimental data show a linear relation. In Ref.21, they further simulated the porous wall flow by using the linear model as a boundary condition, and the comparison with a direct CFD simulation suggests that this model has enough accuracy for the simulation of wind tunnel with porous wall.Some successful applications to the 2D and 3D wall interference analyses can be found in Refs. 22-25.
Before solving the velocity component normal to the wall via Eq. (4), the pressure in the plenum chamber needs to be determined.We assume that the plenum chamber is completely closed and the pressure is uniform.According to the mass conservation for the inflow and outflow through the wall,the pressure in the plenum chamber can be evaluated from

The perpendicular velocity across the porous wall is then computed by using Eqs. (4) and (6) and is set as a boundary condition. The other velocity components are set to zero.
Our CFD solver is also applied to the flow simulations of a normal hole of JTWT using the same boundary conditions as those described in Ref.21.It can be found from Fig.3 that the present result shows a linear relation with a bit smaller gradient compared with Nambu’s computed result.
Nambu et al.21have demonstrated that it is possible to organize one linear relation independent of freestream Mach number by nondimensionalizing the flow rate and the differential pressure by the freestream values.Under the conditions of the 2.4 m×2.4 m transonic wind tunnel,we simulate the flows through a 60° inclined hole only at Ma=0.8. As shown in Fig.4,for the flow through the inclined hole under a small differential pressure, the flow rate still increases linearly with increasing differential pressure, and the gradient A=0.701.
Therefore,the linear relation of Eq.(4)is still applicable to the porous wall with inclined holes. Different from a normal hole, the flow through an inclined hole contributes to the perpendicular and tangential components of velocity. Once the perpendicular component vporousis solved from Eq.(4),the tangential component is prescribed as vporous/tanβ with β being the inclined angle.
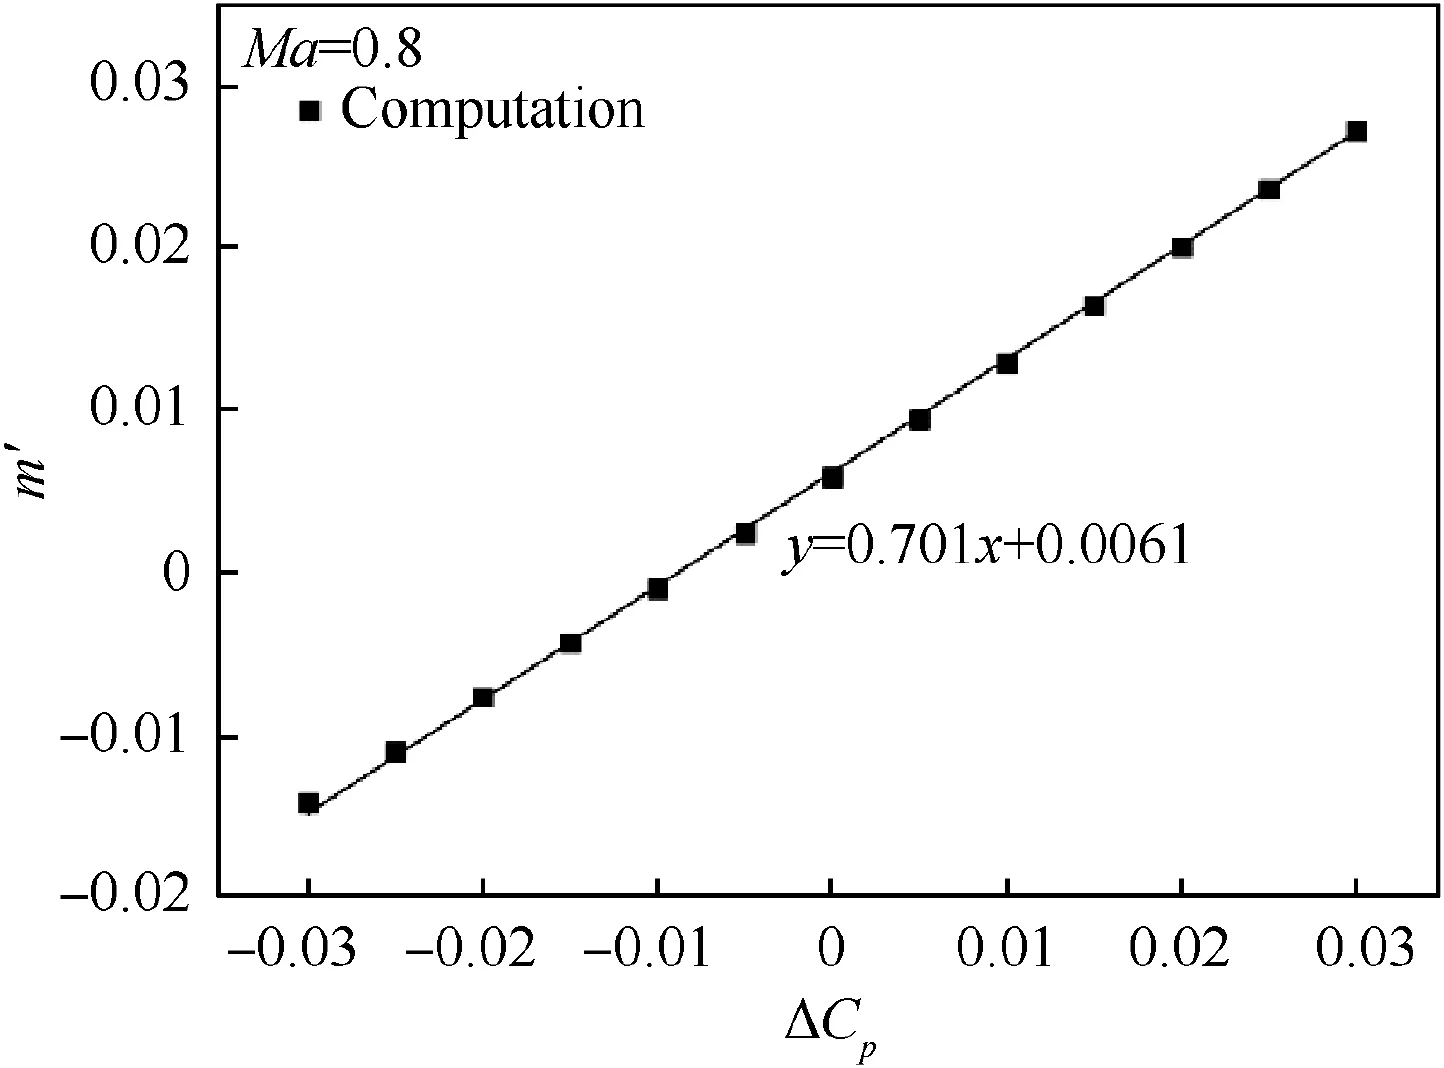
Fig. 4 Variation of mass flow rate with differential pressure coefficient for current 2.4 m×2.4 m transonic wind tunnel.
For the current 2.4 m×2.4 m transonic wind tunnel, the air bleed system is opened to control the experimental Mach number when Ma >0.95. Then Eq. (4) can be modified as

where the coefficient B reflects the effects of air bleed system.In our computations, while the air bleed system is opened,pplenumand the outlet static pressure are approximately set as p∞, and B is then adjusted to obtain an expected inlet Mach number.
3.4. Inlet boundary condition
A subsonic inlet boundary condition is used. Specify the total pressure, the total temperature and the flow angle, and then the outgoing Riemann invariant is employed at the inlet

where the index d denotes the extrapolated value from the interior field, and the index b stands for the boundary value, c is the speed of sound, γ is the ratio of specific heat coefficients,and n is the unit normal vector pointing out of the domain.
The speed of sound is related to the velocity by the following isentropic relationship:

where the index 0 denotes the total parameter.
The speed of sound at the inlet can then be determined from Eqs. (8) and (9) as follows:

with θ being the flow angle relative to the boundary. For the wind tunnel flow, θ=0o.
Quantities like the static temperature,pressure,density and the absolute velocity on the boundary are evaluated from

where R and cprepresent the specific gas constant and the heat coefficient at constant pressure,respectively.The velocity components at the inlet are obtained by decomposing vb| | according to the flow angle θ.
3.5. Outlet boundary condition
The subsonic outlet boundary condition is implemented by prescribing the static pressure at the outlet as follows:

where pais the given static exit pressure, and dp is the local pressure correction defined as

While the air bleed system is off,pais adjusted to obtain an expected inlet Mach number.
4. CSD solver
The modal approach is used to evaluate the structural deformation of the flexible structure under the action of aerodynamic forces, which can be formulated as

where Δr is the structural deformation vector, hiis the vector of the ith mode shape,qiis the corresponding generalized coordinate, and m is the mode number.
The generalized coordinates are solved from the following structural equations of motion:

where M,G,K are respectively the generalized mass,damping and stiffness matrices. A is the generalized aerodynamic force vector calculated from the following surface integral over the aerodynamic surfaces:

A second-order Hybrid Linear Multi-step Scheme(HLMS)using predictor-corrector procedure32,35is employed to solve Eq. (15), in which the flow field is solved only once at each physical time step by introducing a polynomial extrapolation of the generalized aerodynamic force to the corrector step.In Ref. 35, HLMS was verified to provide high efficiency,high-order accuracy, strong stability and simple operation for the computation of fluid-structure interaction.
With respect to the data transfer at the fluid-structure interface, at first, the mode shapes are interpolated from the structural points to the CFD grid on the aerodynamic surfaces by RBF. They are then interpolated to the whole CFD grid by the RBF-TFI dynamic grid generation method.Consequently,the coupled CFD/CSD iterations are performed only on the CFD grid and the dynamic grid is efficiently generated by using Eq.(14)together with the interpolated spatial modal values, so that the repeating data transfer between the aerodynamic and structural grids is avoided.
5.CFD/CSD-based flutter prediction method for transonic wind tunnel model
A coupled CFD/CSD method for flutter prediction advances the aerodynamic equations simultaneously with the structural equations in the time domain. After enough CFD/CSD coupling iterations, the flutter characteristics can be assessed by analyzing the time histories of generalized coordinates. More details about our time-domain CFD/CSD method can be found in Refs. 8,31,32.
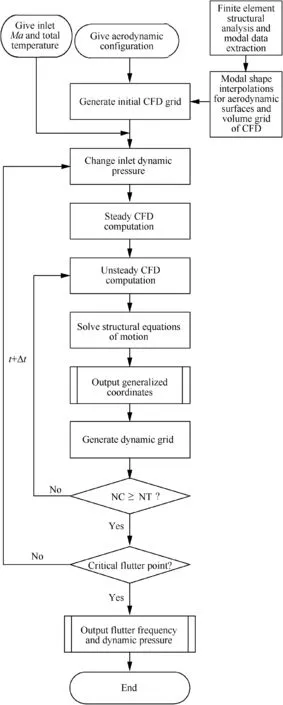
Fig. 5 CFD/CSD coupling solution procedure for flutter computation of a transonic wind tunnel model at a given Ma.
For the flutter computation of an experimental model in the 2.4 m×2.4 m transonic wind tunnel,the extended porous wall model is used as a boundary condition,and the dynamic pressure Q is increased step by step at a fixed Mach number Ma like the flutter experiment described in Section 2. At each Q step, the steady CFD computation is performed at first to achieve the required inlet Ma by adjusting the static exit pressure or the coefficient B in Eq. (7), depending on whether the air bleed system is closed or opened. The time-domain CFD/CSD coupling computation based on the steady flow field is then conducted to gain the structural response. The flutter dynamic pressure and flutter frequency at a fixed Ma are ultimately obtained while Q is increased to the critical flutter point.Fig.5 illustrates the CFD/CSD coupling solution procedure for the flutter computation of a transonic wind tunnel model at a given Ma, where NT is the prescribed total period number of computation at each Q step and NC is the current period level.
6. Numerical examples and discussion
In this section, the proposed flutter prediction method will be applied to the vertical tail and aircraft models tested in the 2.4 m×2.4 m transonic wind tunnel as described in Section 2.
In our CFD/CSD solver,the physical time step is evaluated from

where fiis the frequency of the ith mode, and N denotes the iteration number in a computational period. To obtain timeaccurate solutions, N is set as 720, and the residual is reduced by two orders of magnitude in each iteration according to our comparative computations.
6.1. Vertical tail model
In our computations, both the model installment and the size of test section are identical to the wind tunnel experiment.Fig. 6 shows the computational domain and the surface grid of the vertical model,where the rudder is marked by red lines.The total number of grid cells is about 3.5 million.
Based on the same grid in Fig.6,three boundary conditions are respectively implemented on the porous walls, namely the porous wall model,the farfield condition and the noslip condition,and the other two solid walls are computed using the nonslip condition.
Table 3 compares the modal frequency of the vertical tail model between finite element analysis and wind tunnel test.The measured frequencies are in accordance with the finite element analysis results, and they are used for the flutter computations. Fig. 7 displays the first three mode shapes, where the red square denotes the mode shape at the structural points and the green triangle represents the interpolated mode shape at the CFD grid on the aerodynamic surfaces.As can be seen,each interpolated mode shape is in accordance with the original one at the structural points.
Fig. 8 shows the computed flutter dynamic pressures QFand flutter frequencies fFof the vertical tail model. From Ma=0.695 to Ma=0.96, the results from the computations using the noslip boundary condition on the porous walls significantly differ from the experimental data. The computed QFusing the farfield condition is in accordance with the experimental values before Ma=0.857, but in the transonic regime there is an obvious discrepancy in QFand the bottom of transonic dip.Compared with the farfield condition,the computed QF, fFand the transonic dip position from the porous wall model agree much better with the experimental data. Therefore, for an accurate flutter prediction, it is necessary to consider the effect of porous walls. Fig. 9 gives the time histories of generalized coordinates for different dynamic pressures from convergence to divergence at Ma=0.695. Fig. 10 presents the time histories of generalized coordinates at the critical flutter point for Ma=0.8, 0.857, 0.896 and 0.96. The coupled bending-torsion flutter is obtained at these Mach numbers.
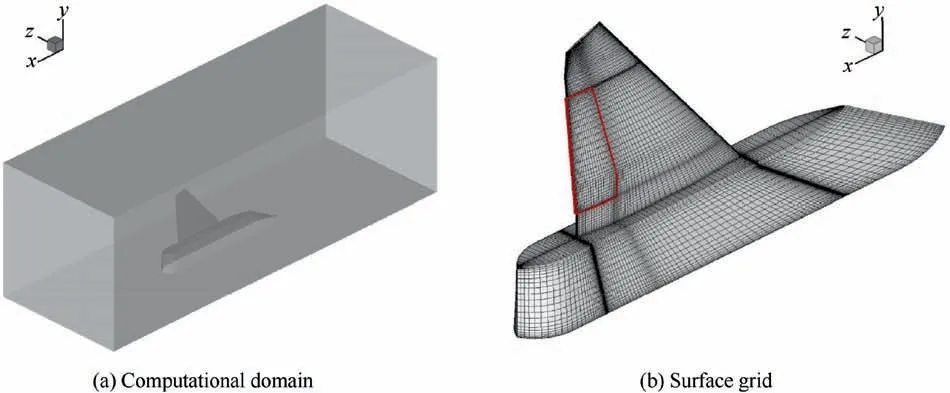
Fig. 6 Computational domain and surface grid of vertical tail model.

Table 3 Modal frequency of vertical tail model.

Fig. 7 First three mode shapes of vertical tail model.
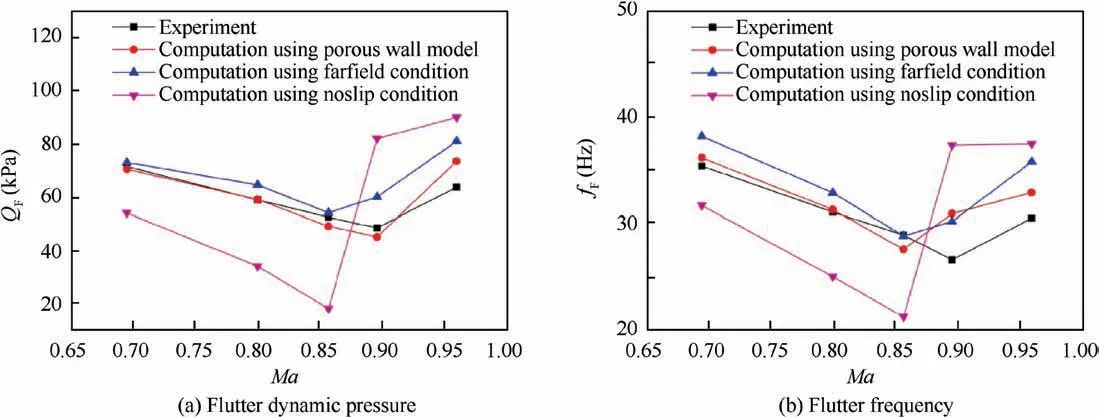
Fig. 8 Flutter dynamic pressure and frequency of vertical tail model.

Fig. 9 Time histories of generalized coordinates of vertical tail model at Ma=0.695 using porous wall model.
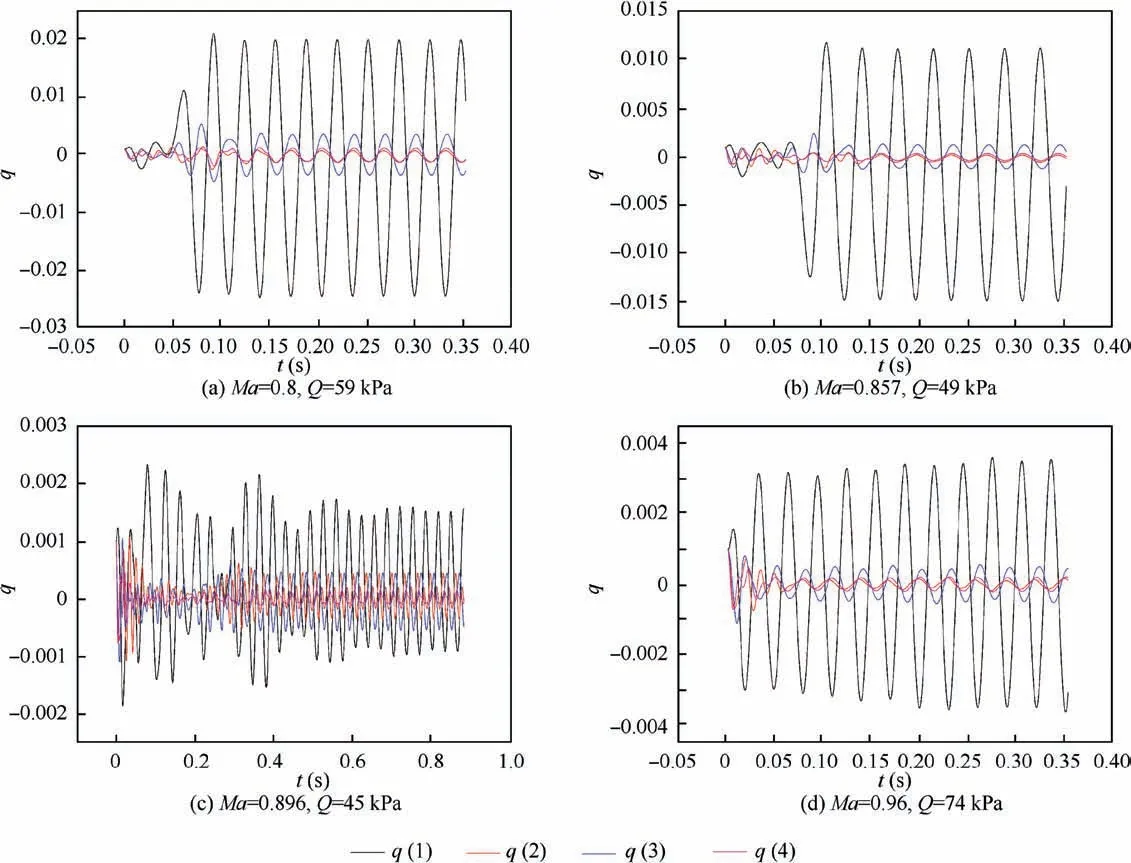
Fig. 10 Time histories of generalized coordinates of vertical model at Ma=0.8, 0.857, 0.896 and 0.96 using porous wall model.
6.2. Aircraft model
Only the symmetric modes are considered for the aircraft model, hence our computations are performed on the halfaircraft model. In addition, the effect of the floating suspension system is neglected. Fig. 11 shows the computational domain and the surface grid of the aircraft model. Both the model installment and the size of test section are identical to the wind tunnel experiment.For the aircraft model,the porous walls are directly computed by using the extended porous wall model. The total grid cell number is about 6 million.
Table 4 lists the first 7 modal frequencies of the aircraft model from a finite element analysis. In our wind tunnel test,only the first two modal frequencies were obtained due to large signal noise. Hence, the modal frequencies from a finite element analysis were directly applied to the flutter prediction for the aircraft model. Fig. 12 displays the first three mode shapes, where the red square denotes the mode shape at the structural points and the blue triangle represents the interpolated mode shape at the CFD grid.
Fig.13 compares the computed results with the experimental data.Both the flutter dynamic pressures and the bottom of the transonic dip show good agreement,but the calculated flutter frequencies are slightly lower than the experimental values.Fig. 14 shows the time histories of generalized coordinates at the critical flutter point for Ma=0.7, 0.8, 0.85, 0.88 and 0.9.The computed flutter type is coupled wing bending-body bending flutter.
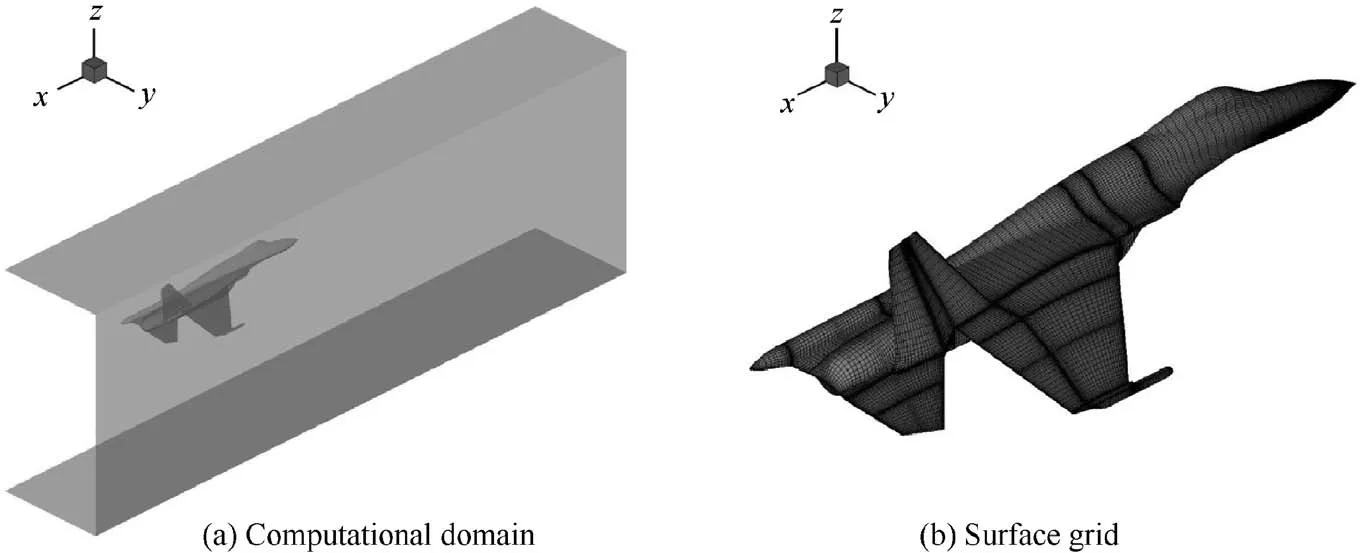
Fig. 11 Computational domain and surface grid of aircraft model.

Table 4 Modal frequency of aircraft model.

Fig. 12 First three mode shapes of aircraft model.
One reason for the flutter frequency difference between experiment and calculation in Fig.13 is the effects of the aerodynamic forces and the floating suspension system on the wind tunnel model structure. For a further investigation, as shown in Fig. 15 and Fig. 16, a fast Fourier transform analysis is conducted on the experimental time history of the wing-root bending moment at Ma=0.8. There are three dominant frequencies in Fig. 16, which also would cause a frequency evaluation error.
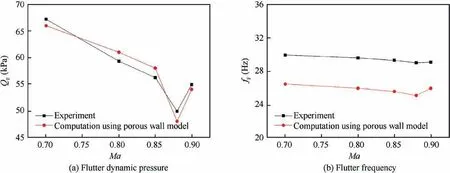
Fig. 13 Flutter dynamic pressure and frequency of aircraft model.
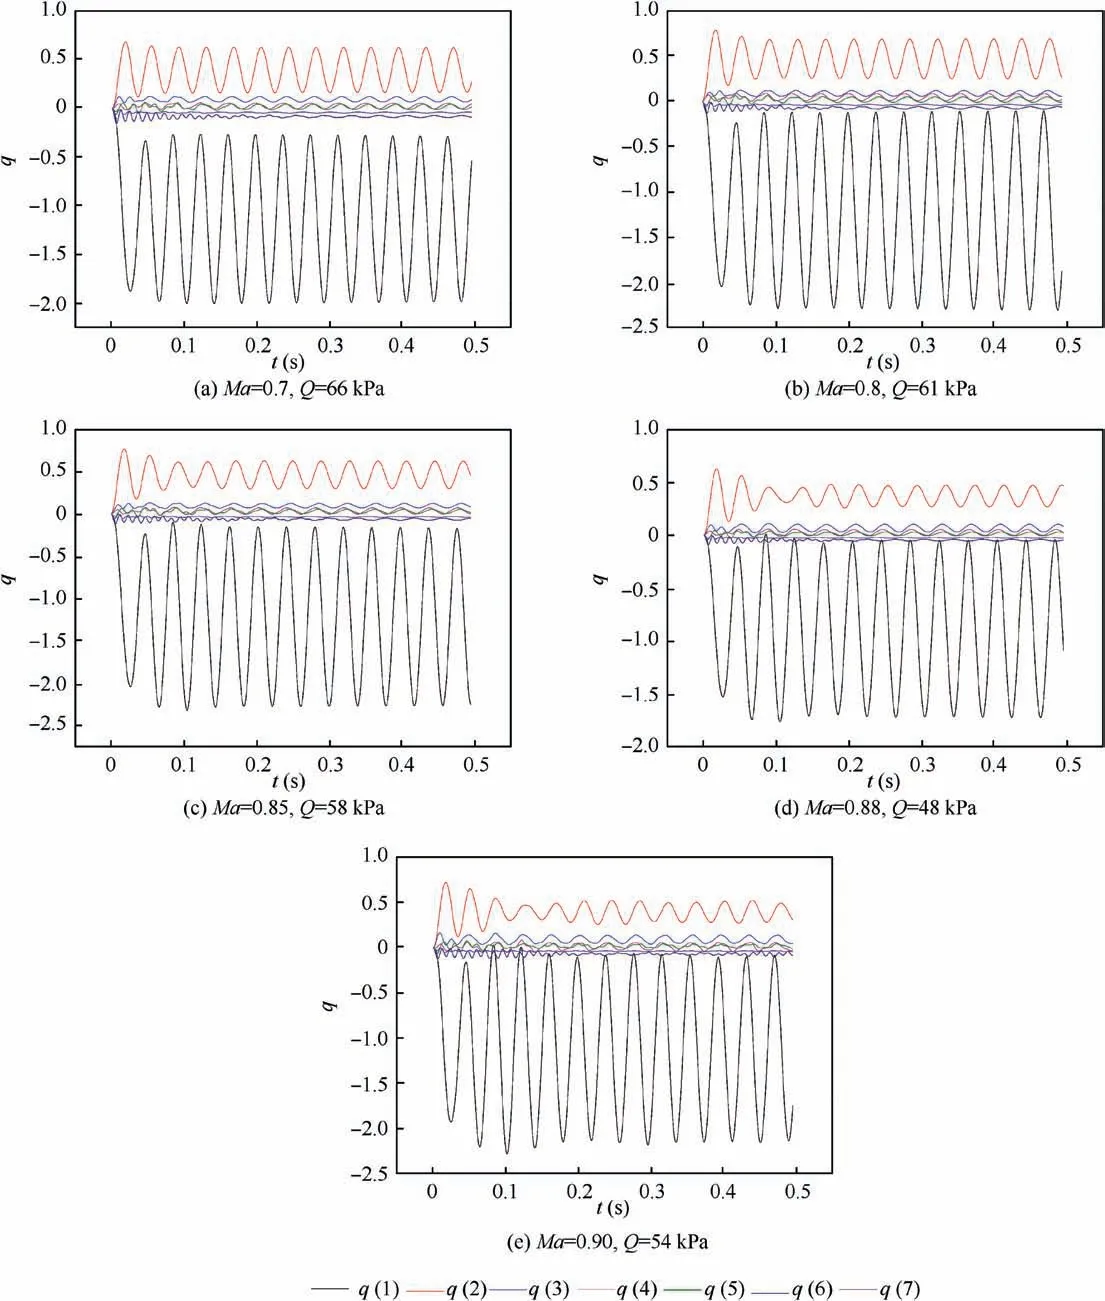
Fig. 14 Time histories of generalized coordinates of aircraft model using porous wall model.
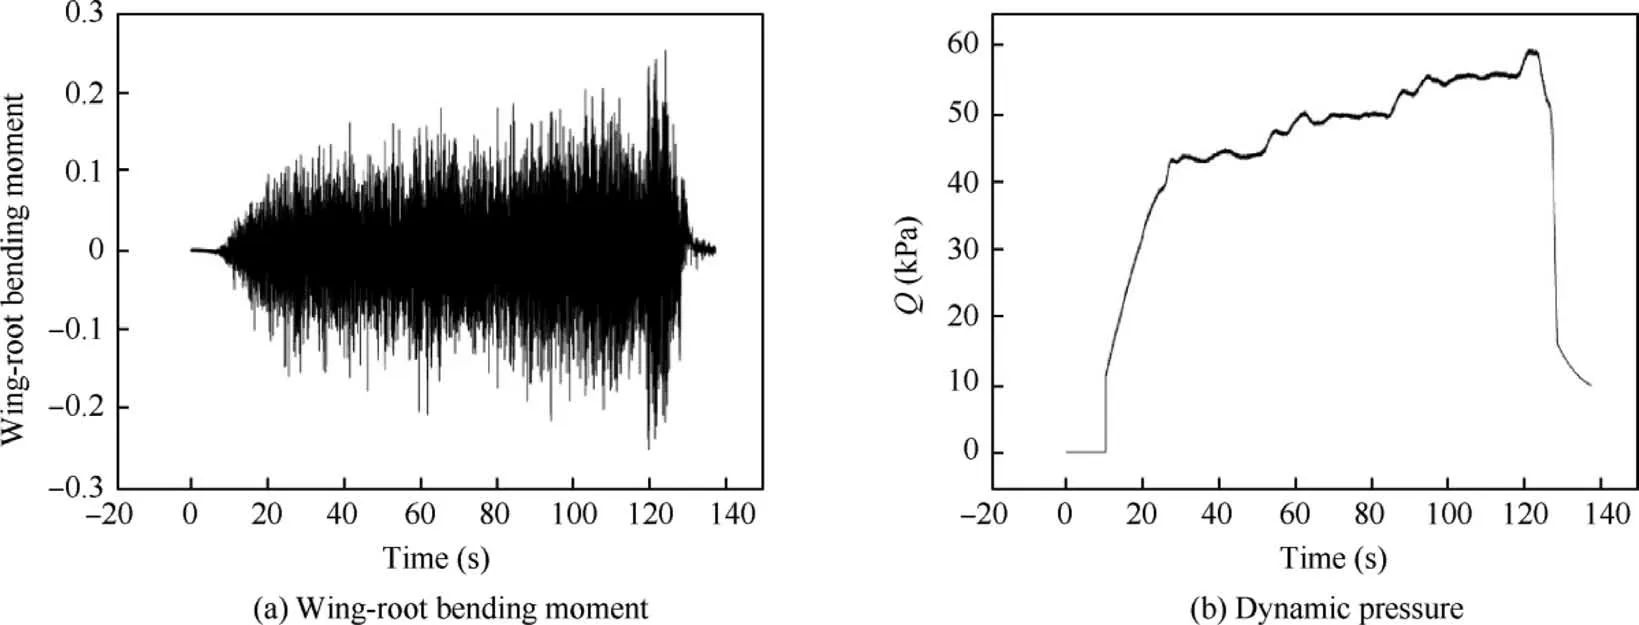
Fig. 15 Experimental time histories of wing-root bending moment and dynamic pressure at Ma=0.8.
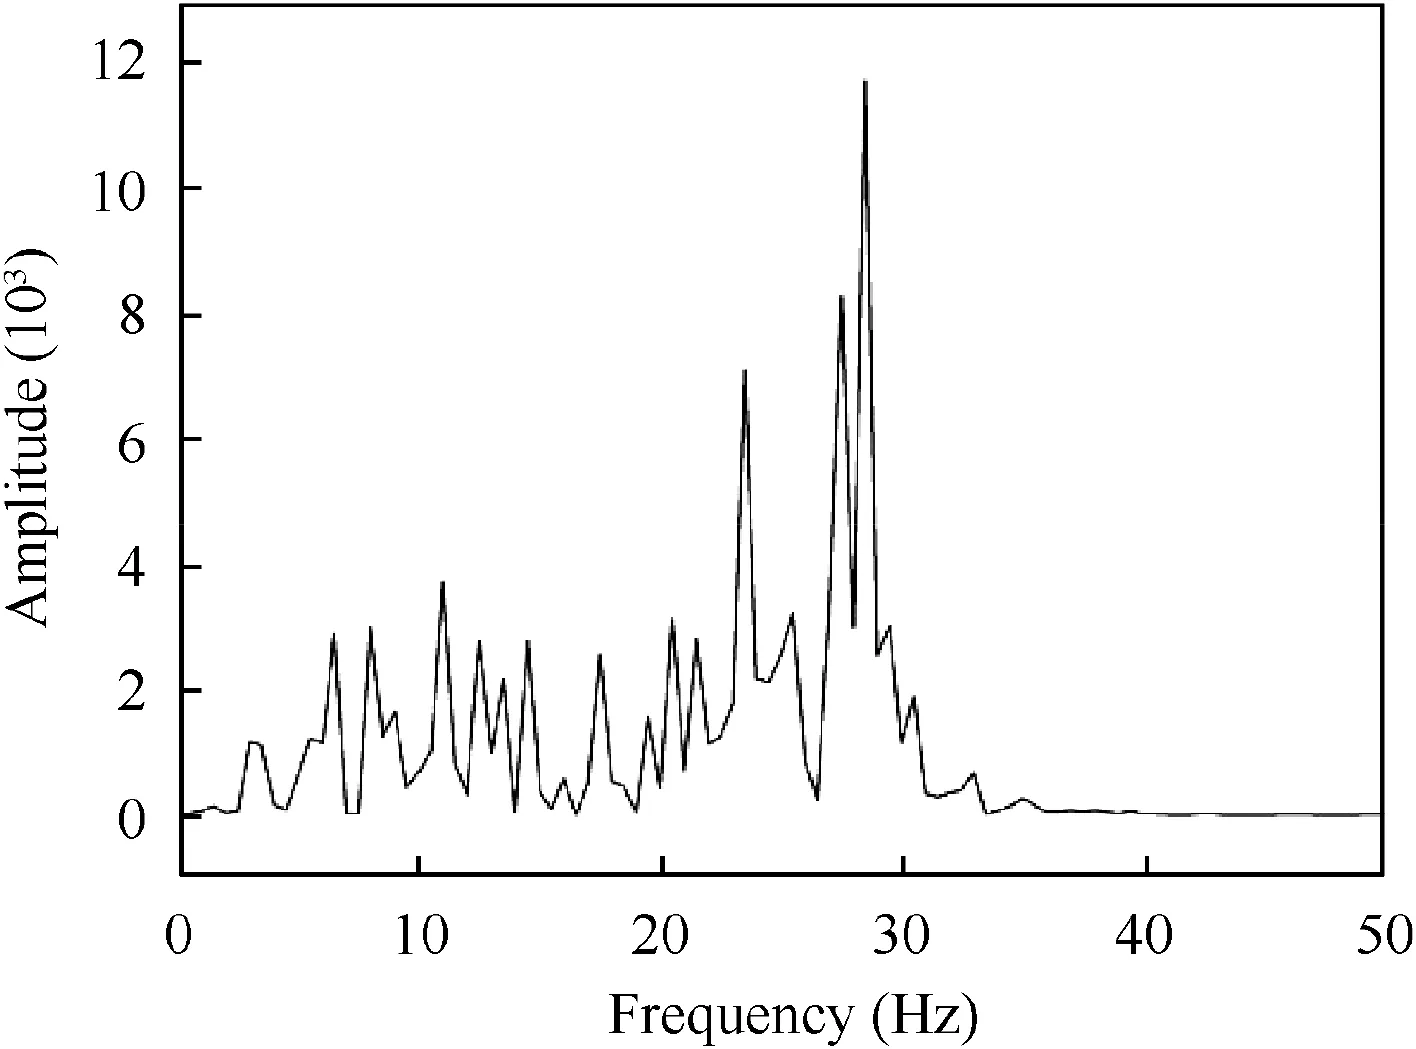
Fig. 16 Fast Fourier transform spectrum of wing-root bending moment at Ma=0.8.
7. Conclusions
To extend the Nambu’s model to the porous wall with inclined holes, the flows through a 60° inclined hole of the 2.4 m×2.4 m transonic wind tunnel are directly simulated by using CFD. According to the flutter testing approach for the current wind tunnel, a CFD/CSD-based flutter prediction method for experimental models is developed by employing the extended porous wall model as a boundary condition.The flutter computations are performed on a vertical tail model and an aircraft model tested in the current transonic wind tunnel. From our development process and numerical analyses, we conclude as follows.
(1) For the flow through an inclined hole under the small differential pressure, the flow rate still increases linearly with the increase of differential pressure.
(2) The present method can accurately predict the flutter dynamic pressure of a flutter model tested in the current transonic wind tunnel. For both models, the computed flutter dynamic pressure, flutter frequency, and the bottom of the transonic dip are in agreement with the experimental results.
(3) The present method can be extended to other wind tunnels with porous walls in a similar manner.
Declaration of Competing Interest
None.
Acknowledgements
This work was supported by the National Natural Science Foundation of China (No. 11872212) and a project funded by the Priority Academic Program Development of Jiangsu Higher Education Institutions.
 CHINESE JOURNAL OF AERONAUTICS2020年12期
- CHINESE JOURNAL OF AERONAUTICS的其它文章
- Design and experimental study of a new flapping wing rotor micro aerial vehicle
- Prediction of pilot workload in helicopter landing after one engine failure
- Study of riblet drag reduction for an infinite span wing with different sweep angles
- Modulation of driving signals in flow control over an airfoil with synthetic jet
- Strong interactions of incident shock wave with boundary layer along compression corner
- An efficient regulation approach for tomographic reconstruction in combustion diagnostics based on TDLAS method
