
Sub seasonal variations of weak stratospheric polar vortex in December and its impact on Eurasian air temperature
2019-12-03 07:53:16PENGChengFANKeandDAIHaixia
PENG Cheng, FAN Ke,c and DAI Haixia
aNansen-Zhu International Research Centre, Institute of Atmospheric Physics, Chinese Academy of Sciences, Beijing, China;
bCollege of Earth and Planetary Sciences, University of the Chinese Academy of Sciences, Beijing, China; cCollaborative Innovation Center on Forecast and Evaluation of Meteorological Disasters, Nanjing University of Information Science and Technology,Nanjing, China
ABSTRACT Weak stratospheric polar vortex (WPV) events during winter months were investigated. WPV events were identified as being weakest in December, accompanied by the most dramatic increase in geopotential height over the polar region. After the onset of a December WPV event, the dynamic processes influencing Eurasian temperature can be split into two separate periods. Period I (lag of 0-25 days) is referred to as the stratosphere-troposphere interactions period, as it is mainly characterized by stratospheric signals propagating downwards. In Period I, a stratospheric negative Northern Annular Mode (NAM) pattern associated with the WPV propagates downwards, inducing a negative NAM in the troposphere. The anomalous low centers over the Mediterranean and North Pacific bring cold advection to northern Eurasia, resulting in a north-cold-south-warm dipole pattern over Eurasia. The zero line between negative and positive temperature anomalies moves southwards during days 5-20.Stratospheric cold anomalies at midlatitudes propagate downwards to high latitudes in the troposphere and contribute to the dipole structure. During Period Ⅱ(lag of 25-40 days), as downward signals from the stratosphere have vanished, the dynamic processes mainly take place within the troposphere. Specifically, a wave train is initiated from the North Atlantic region to northern Europe. The propagation of wave activity flux intensifies a cyclonic anomaly over northern Europe, which brings cold advection to Scandinavia and warm advection to central Asia. Therefore, a northwest-cold-southeast-warm dipole structure occupies Eurasia and migrates southeastwards during this period.
KEYWORDS Stratospheric polar vortex;weak stratospheric polar vortex events in December;subseasonal variability;stratosphere-troposphere interaction; winter Eurasian air temperature (0-40 days)
1. Introduction
The stratospheric polar vortex is a climatological lowpressure system over the polar region, surrounded by cold air and westerly flow. Many previous studies have shown that strong fluctuations of the stratospheric polar vortex can propagate downwards to modulate tropospheric circulation (e.g., Baldwin and Dunkerton 2001;Cai and Ren 2006,2007;Rao,Ren,and Yang 2015).
The variation in geopotential height over the polar region is closely related to the Northern Annular Mode(NAM).The NAM is a hemispheric-scale pattern of climate variability characterized by an out-of-phase fluctuation in the strength of zonal flow along ~55°and 35°N(Thompson,Baldwin, and Wallace 2002). The downward stratospheric influence is accompanied by descending flow anomalies that induce a tropospheric NAM,or Arctic Oscillation(AO),which are large-scale seesaw patterns between the polar and mid-latitude regions (Baldwin and Dunkerton 2001;Limpasuvan,Thompson,and Hartmann 2004).
Tropospheric atmospheric circulation patterns usually share the same sign as the stratospheric polar vortex(Baldwin and Dunkerton 2001).When the stratospheric polar vortex is weak, accompanied by an increase in geopotential height over the polar area,tropospheric atmospheric circulation patterns will resemble the NAM (NAO/AO) in its negative phase. It has been widely reported in previous studies that many extreme weather events over Eurasia are associated with a negative NAO/AO (Kolstad, Breiteig, and Scaife 2010; Woo, Kim, and Kug 2015).
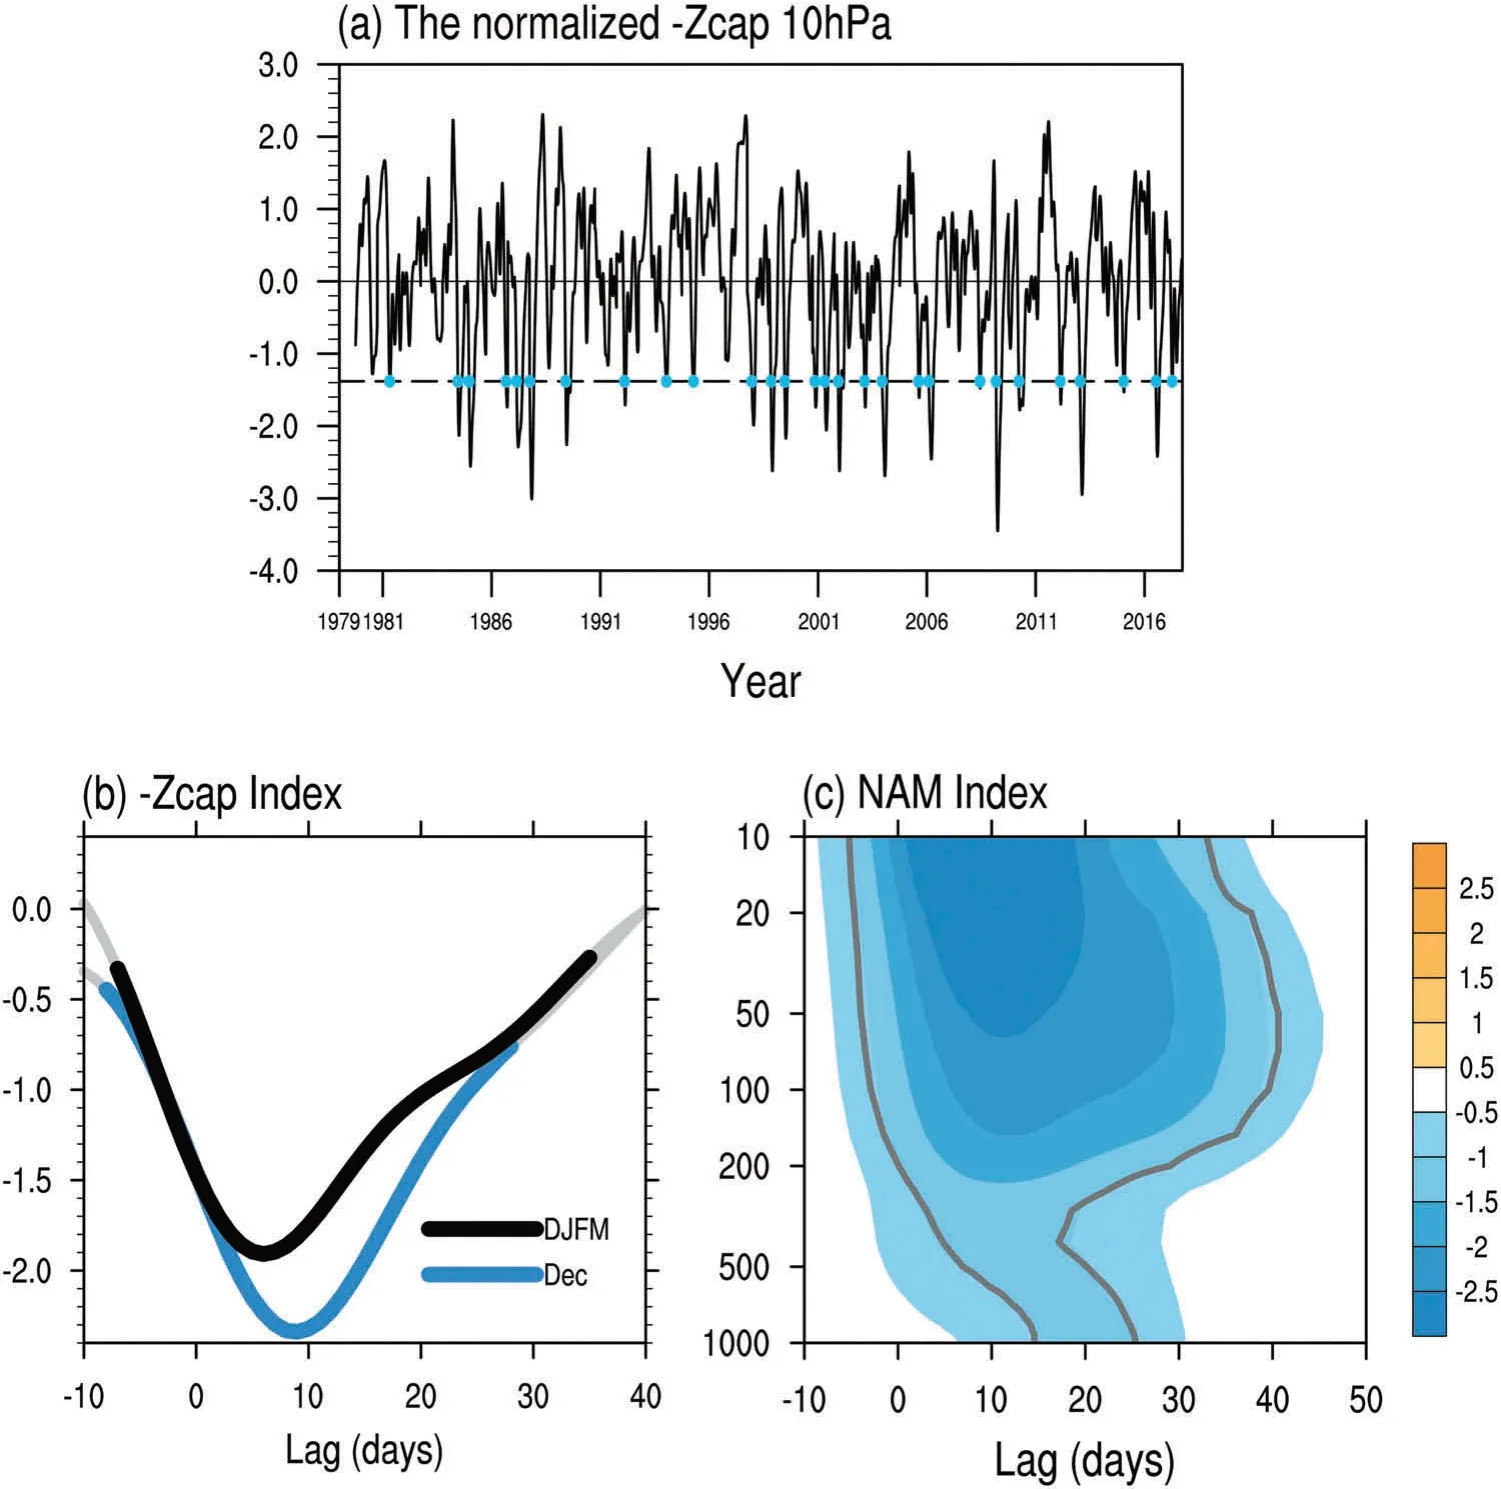
Figure 1.(a)Standardized daily-Zcap index in 1979-2017.The horizontal black-dashed line indicates the 10th percentile.The blue dots denote the onset dates of WPV events.(b)Lead-lag composite of standardized-Zcap index during the lifecycle of WPV events in DJFM and December.The blue and black thick lines indicate values exceeding the 95%confidence level in December and DJFM,respectively,based on the Student's t-test.The gray thin lines indicate values not exceeding the 95%confidence level.(c)Lead-lag composite of standardized NAM Index during the lifecycle of WPV events in December.The gray contour indicates values exceeding the 95% confidence level, based on the student's t-test.
Coupling between the stratosphere and troposphere mainly occurs in winter, with subseasonal variations.Some studies have suggested that the connection preferentially appears in late winter. For instance, Kodera and Kuroda (2000) suggested the relationship between the AO in the stratosphere and at ground level only appears in February and March. In contrast, Díaz-Durán et al. (2017) pointed out that the strongest planetarywave activities can be discovered in midwinter(January and February), accompanied by the weakest stratospheric polar vortex events. Although these studies demonstrate the subseasonal variations of stratosphere-troposphere coupling, little attention has been paid to how tropospheric regional circulation and temperature accordingly vary on a subseasonal timescale.
In this study, weak polar vortex (WPV) events on a subseasonal timescale were examined. The impact of December WPV events on Eurasian air temperature was investigated. Following this introduction, section 2 describes the data and methods used.The temperature and atmospheric circulation variations over Eurasia related to December WPV events are presented in section 3. Conclusions are provided in section 4.
2. Data and methods
Daily data from the European Centre for Medium-Range Weather Forecasts' interim reanalysis were used in this study (Dee et al. 2011). The dataset we used has a horizontal resolution of 2.5° × 2.5° and 17 pressure levels from 1000 to 10 hPa for the period 1979-2017.The daily data were 20-day low-pass filtered.
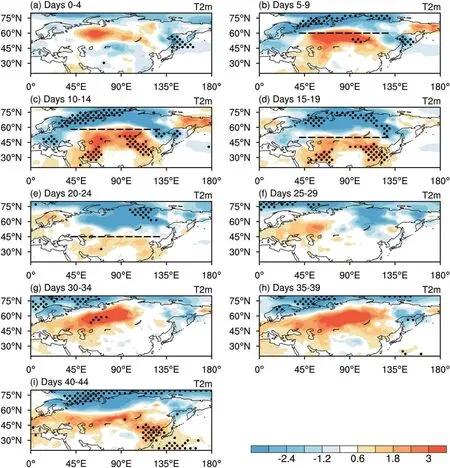
Figure 2. Composite maps of 2-m temperature anomalies (units: K) after the onset of WPV events in December (each phase represents a 5-day mean). The dots denote values exceeding the 95% confidence level, based on the student's t-test. The blackdashed lines in (b-e) indicate the node line between warm and cold anomalies.
The strength of the stratospheric polar vortex is represented by polar-cap-averaged geopotential height anomalies (Kolstad, Breiteig, and Scaife 2010; Woo, Kim,and Kug 2015).We define a Zcap Index as the normalized daily area-averaged geopotential height anomalies at 10 hPa north of 65°N(Figure 1a).As the strength of the polar vortex is negatively correlated to Zcap Index (Woo, Kim,and Kug 2015),we use-Zcap Index as an indicator hereafter. A WPV event is defined when the -Zcap Index is lower than its 10th percentile(-1.38 standard deviations).The onset date(day 0)of a WPV event is the first day when the -Zcap Index falls below the threshold. Every event contains at least 10 days lower than-0.5 standard deviations. Based on this criterion, 28 weak events were detected for the period DJFM (December-March).Among them,there are seven WPV events in December,10 events in January,eight events in February,and three events in March.It is about 0.7 events per winter and close to the major stratospheric sudden warming(SSW)events occurrence frequency, which is 0.65 events per winter based on the WMO definition (Hu, Ren, and Xu 2014).About 60%of SSW events are also WPV events(Charlton and Polvani 2007).
The NAM index was calculated by projecting daily geopotential height anomalies onto the spatial pattern of the leading empirical orthogonal function of DJFM monthly mean geopotential height anomalies. The stationary wave activities are represented by a phaseindependent flux of wave activity, defined by Takaya and Nakamura (2001).
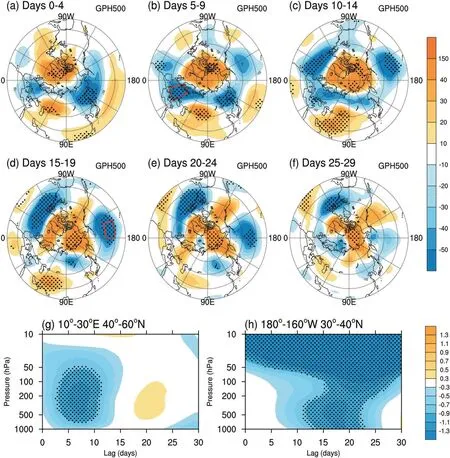
Figure 3.(a-f)Composite maps of geopotential height anomalies(units:m)at 500 hPa after the onset of WPV events in December(each phase represents a 5-day mean).The red frames indicate the main research areas that influence the Eurasian air temperature.(g, h) Lead-lag composites of standardized geopotential height anomalies averaged over the main research areas in (b, d)respectively. The dots denote values exceeding the 90% confidence level, based on the student's t-test.
3. Results
To investigate the strength of WPV events in each winter month, composites of -Zcap Index were calculated. As shown in Figure 1(b), the composite of -Zcap Index declines significantly after the onset of WPV events in December.The composite amplitude in December is larger than the composite value of all WPV events in DJFM.This indicates the most significant increase in geopotential height over the polar cap, as well as the weakest WPV events (composites of other winter months are not shown). Therefore, the effects of these WPV events in December are further explored.
To examine the stratospheric influence on the troposphere,a lead-lag composite of normalized NAM index during WPV events in December was calculated(Figure 1(c)). It is clear that, after the onset of a WPV event,a negative NAM pattern propagates downwards from the stratosphere to the troposphere before day 25.Therefore,the evolution before day 25 is considered as the ‘stratosphere-troposphere interactions' period(Period I), while Period II (from day 25 onwards) takes place within the troposphere.
Composites of 2-m temperature over Eurasia after the onset of December WPV events are provided in Figure 2.The evolution can be divided into nine 5-day phases.Each phase shows the 5-day mean value. The most prominent feature of the temperature variations during days 5-24(Period I; Figure 2(b-e)) is the dipole structure between the northern and southern parts of Eurasia.The node line keeps moving south from around 60°N during days 5-9(Figure 2(b))to 45°N during days 20-24(Figure 2(e)).During days 25-44 (Period II), Eurasian temperatures manifest as a northwest-southeast dipole pattern.The cold anomalies over Scandinavia and warm anomalies over central Asia migrate southeastwards and reach East Asia after day 40.

Figure 4. Composite maps of temperature (units: K; shading) and zonal wind anomalies (units: ms-1; contours) during the period I after the onset of WPV events in December(each phase represents a 5-day mean).The dots denote temperature values exceeding the 90% confidence level, based on the student's t-test.
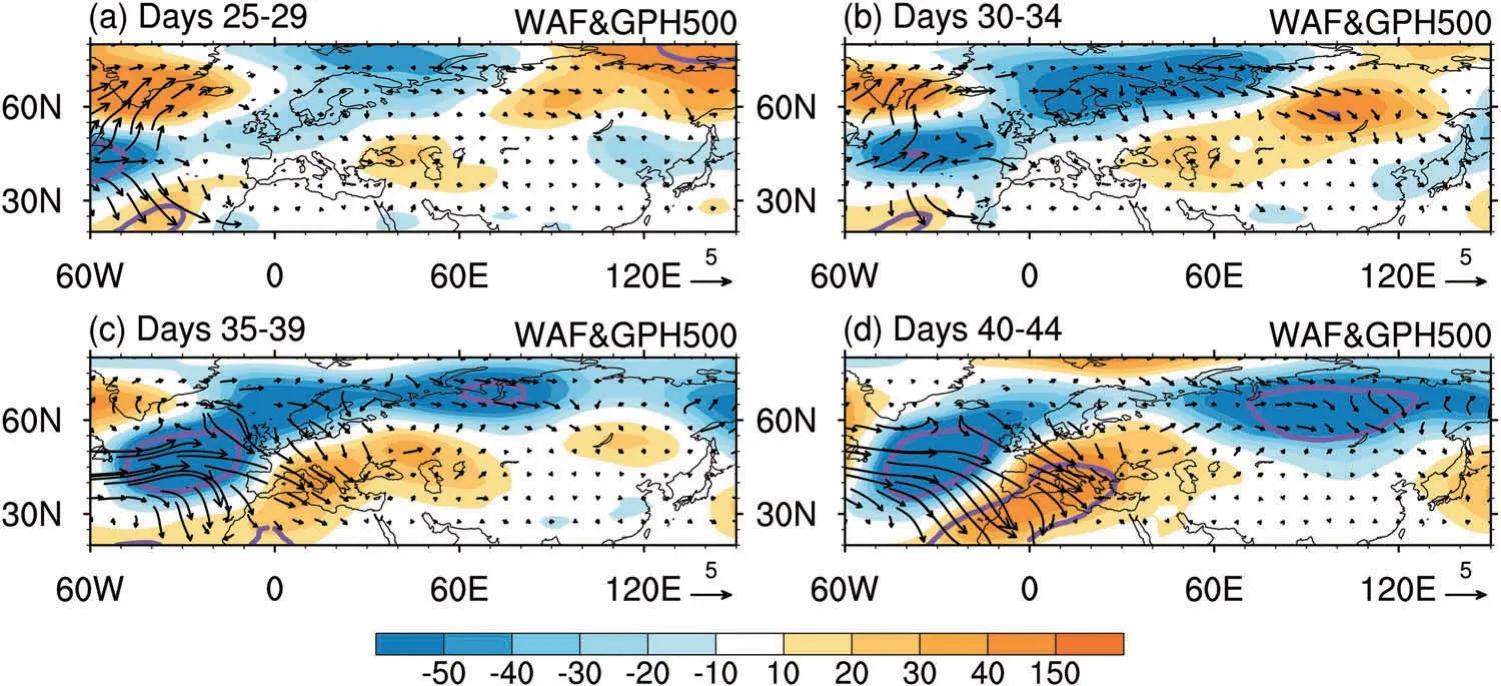
Figure 5.Composite maps of geopotential height anomalies(units:m;shading)and WAF(units:m2 s-2;vectors)at 500 hPa during period Ⅱ(each phase represents a 5-day mean).The purple contour denotes values exceeding the 90%confidence level,based on the student's t-test.
The associated geopotential height anomalies at 500 hPa during Period I are presented in Figure 3(a-f). The atmospheric circulation pattern resembles the NAMpattern in its negative phase,with a positive height anomaly over the polar region and negative height anomaly at midlatitudes.The anomalous low center over the Mediterranean during days 0-14(Figure 3(a-c))induces anomalous northeasterly cold advection over northern Europe,resulting in cold anomalies (Figure 2(b-d)) and anomalous westerly flow over southern Eurasia with warm advection.The teleconnection pattern between Mediterranean and polar regions is a typical component of the AO pattern. The anomalous low-pressure center over the central Pacific(Figure (2d)), which is similar to the traditional North Pacific center ofanAOpattern,wouldalso bring anomalous cold northeasterly flow to East Asia.Bothofthe negative AO anomalous centers are modulated by stratospheric signals,as the lead-lag composites of averaged height anomalies clearly show downward propagation over these regions(Figure 3(g)and(h)).

Figure 6.Schematic diagram of the dynamic processes involved in how weak stratospheric polar vortex influences the Eurasian air temperature.
To further explore the stratospheric influence on tropospheric temperature, composites of averaged anomalous zonal wind and temperature over 90-140°E are shown in Figure 4. The prevailing anomalous easterly over midlatitudes extends from the stratosphere to the ground, indicating a downward propagation of the negative NAM. The warm air over the polar region propagates downwards from the stratosphere to the troposphere and causes the anomalous high pressure over the polar cap in the troposphere.To keep the air mass balance,in the lower troposphere,cold anomalies propagate equatorward, with the node line between cold and warm anomalies moving from 60°N to 40°N during days 5-24 (Figure 4(b-e)), which is consistent with the temperature variations in Figure 2(b-e).This circulation process is described in detail by Cai and Ren (2007).
After the stratosphere-troposphere interactions period, dynamic processes within the troposphere will continue to influence Eurasian temperatures.During Period I,an NAO-like pattern occupies the Atlantic region during days 10-29 (Figure 3(c-f)) as a regional phenomenon of the negative NAM(Wallace 2000).After day 25(in Period II),a eastward wave-train propagation is initiated from the negative NAO-like pattern to northern Europe(Figure(5a)and (b)). As a result of the wave train, anomalous low pressure over northern Europe intensifies.The associated anomalous cyclonic circulation(figure not shown)would induce northerly cold advection to the west over Scandinavia and southerly warm advection to the east over central Asia.When the cyclonic anomaly propagates southeastwards,the northwest-southeast dipole pattern of anomalous temperature also migrates, ultimately reaching East Asia after day 30 (Figure 2(g-i)). These results are consistent with the downstream effect of negative NAO described in Sung,Lim,and Kug(2010).
4. Conclusions
After the onset of a December WPV event, stratospheric negative NAM signals propagate downwards during Period I (lag of 0-25 days). The downward geopotential anomalies induce negative NAM (-AO) patterns in the troposphere. Anomalous low centers over the Mediterranean and North Pacific could induce anomalous northeasterly cold advection to northern Eurasia and anomalous westerly warm advection over southern Eurasia. The node line keeps moving southwards as the northern cold anomalies develop.As the downward propagation of warm air induces high pressure over polar regions, the equatorward propagation in the lower troposphere moves cold air out of the polar area to keep the air mass balance (Cai and Ren 2007).
In Period II(lag of 25-40 days),downward signals from the stratosphere diminish and the temperature variations over Eurasia are mainly affected by dynamic processes within the troposphere.A wave train originates from the negative NAO-like pattern during days 25-29 and affects downstream regions. The propagation of the wave train intensifies the cyclonic anomaly over northern Europe and brings cold anomalies over Scandinavia and warm anomalies over central Asia. The cyclonic anomaly migrates southeastwards along with the northwest-southeast dipole temperature structure during Period II. All the dynamic processes involved are summarized schematically in Figure 6.
Disclosure statement
No potential conflict of interest was reported by the authors.
Funding
This research was supported by the National Natural Science Foundation of China [grant numbers 41730964, 41575079,and 41421004].
 Atmospheric and Oceanic Science Letters2019年5期
- Atmospheric and Oceanic Science Letters的其它文章
- Enhanced correlation between ENSO and western North Pacific monsoon during boreal summer around the 1990s
- Contribution of El Niño amplitude change to tropical Pacific precipitation decline in the late 1990s
- Long-term changes in wintertime persistent heavy rainfall over southern China contributed by the Madden-Julian Oscillation
- Contribution of El Niño amplitude change to tropical Pacific precipitation decline in the late 1990s
- State of China's climate in 2018
- The impacts of modeling global CO2 concentrations with GEOS-Chem using different ocean carbon fluxes