
State of China's climate in 2018
2019-12-03 07:53:14ZENGHonglingXIAOChanCHENXianyanandYEDianxiu
ZENG Hongling, XIAO Chan, CHEN Xianyan and YE Dianxiu
National Climate Center, China Meteorological Administration, Beijing, China
ABSTRACT In 2018,the mean temperature in China was 0.54°C above normal,and the annual rainfall was 7%above normal.More typhoons made landfall with severe damage.Low-temperature freezing and snow disasters occurred frequently with extensive losses. In summer, rainstorms occurred frequently with relatively limited damage.Northeast China and Central East China suffered extreme heatwaves.Regional and periodic droughts resulted in slight impacts.Severe convective weather and dust storms were relatively less, but periodic haze influenced air quality and human health.The areas of affected crops, death tolls, direct economic losses were all significantly less than those over the last 5 years.
KEYWORDS Climate state;meteorological disasters;weather and climate events;2018
1. Introduction
Since 1994,the National Climate Center has released the China Climate Bulletin at the beginning of each year,providing information on climate elements, climate system monitoring, meteorological disasters, and climate impacts to the public for the previous year. However, it is not a formal publication and is not convenient for scientists to cite it.Therefore,this report is completed to provide an accessible and authoritative assessment of the climate in China based on the operational system of the National Climate Center. This report is a summary of China's climate as well as major weather and climate events during 2018. The majority of this report is based on temperature and precipitation observations. Most of the content presents summary statistics for 2018 compared to the 1981-2010 average. Throughout the text,the terms“above normal”,“below normal”,and“close to normal”are in reference to the average from the 1981-2010 baseline period unless otherwise stated. For the weather and climate events, we select several highimpact events that occurred in 2018.These events include typhoons,low-temperature freezing,and snow disasters,rainstorms, heatwaves, droughts, severe convective weather events, dust storms, and haze events. To determine the severity of the meteorological disasters in 2018,the areas of affected crops,death tolls,number of missing persons,as well as the direct economic losses,were compared to those over the last 5 years.
2. Temperature
The mean temperature in China in 2018 was 10.09°C,which was 0.54°C above normal. The year 2018 and 1999 were both the 10th warmest year since 1951.Except for the years 1998 and 1999, the 10 warmest years in China all occurred after 2006,with 2007(10.45°C)being the warmest year on record(Figure 1(a)).
In 2018, the spatial and temporal distribution of temperature was quite uneven. In terms of the spatial distribution, the temperatures across most of China were close to or above normal, with anomalies of 1 ~2°C in central Huanghuai, eastern Jiangnan, central Inner Mongolia, southern Qinghai and parts of Tibet, except for parts of northern Xinjiang where the annual mean temperatures were slightly below normal (Figure 1(b)).
In terms of the seasonal cycle, the seasonal mean temperatures in China for winter (December 2017 to February 2018), spring (March to May), summer (June to August), and autumn (September to November)were -3.2°C, 12.0°C, 21.9°C, and 9.9°C, respectively.Spring and summer were the warmest since 1951 and were 1.6°C and 1.0°C above normal, respectively. The winter and autumn mean temperatures were close to normal.
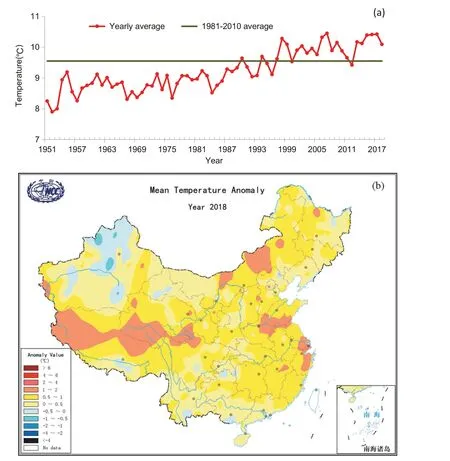
Figure 1.(a)Annual mean temperatures in China from 1951 to 2018(unit:°C)and(b)anomalies in 2018(units:°C,with respect to the 1981-2010 average).
In terms of the monthly mean temperature, the months from March to September and November were all warmer than normal, especially March, which was the warmest March since 1951 with an anomaly of 2.8°C.
In 2018, extreme high-temperature events and extreme cold events in China both occurred more often than normal. In term of the daily maximum temperature, 209 stations reached the extreme event standard, and 57 of these stations recorded their highest daily maximum temperature.In terms of the daily minimum temperature, 255 stations reached the extreme event standard, which was more than normal and significantly more than in 2017.
3. Precipitation
The total rainfall in China in 2018 was 673.8 mm,which is 7%above normal and 3.9%above that in 2017(Figure 2(a)). The year 2018 was the 7th wettest year since 1951 and the 3rd wettest year since 2010.The rainfall anomaly pattern showed that northern China was generally wet,whereas southern China was close to normal. The areas with annual rainfall amount that was 20%to 100%more than normal included central and northern Northeast China, central and eastern northwest China, central and western Inner Mongolia,central Shandong,northeastern Anhui, central and eastern Sichuan, southwestern Xinjiang, central and western Tibet, and most of Hainan.However, the rainfall amount was 20%~50% below normal over central Liaoning and southeastern Xinjiang.The rainfall in 2018 was close to normal over most other areas of China(Figure 2(b)).
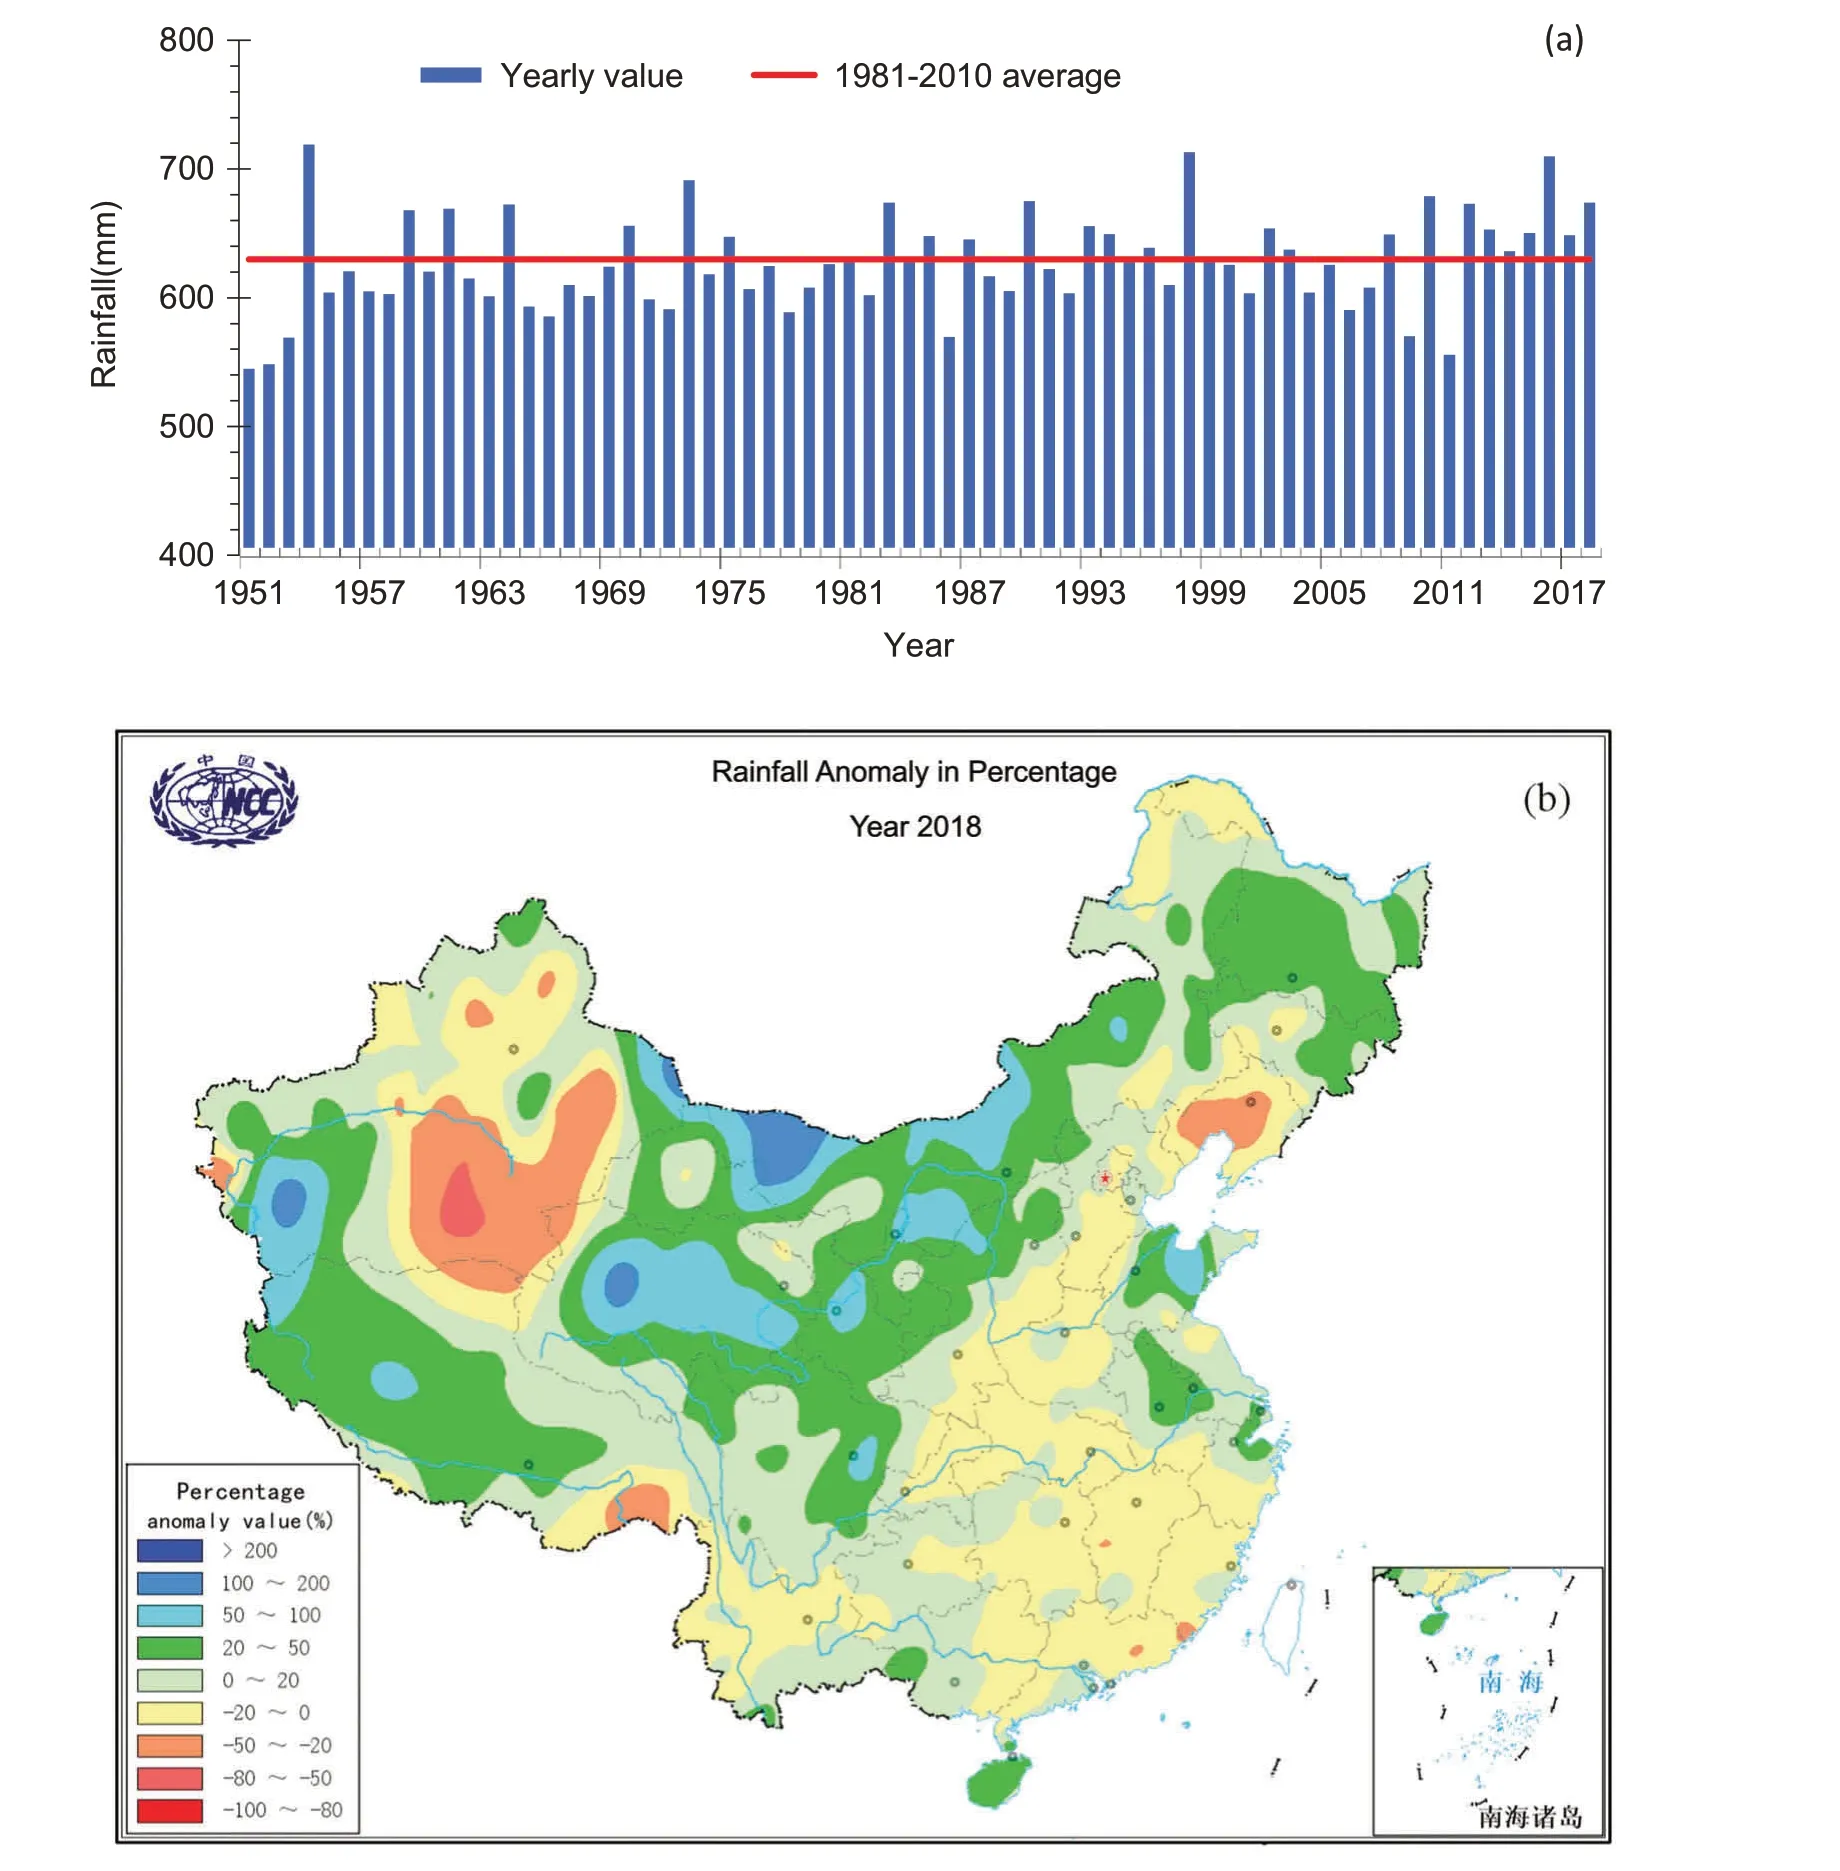
Figure 2.(a)Total annual rainfall in China from 1951 to 2018(units:mm)and(b)anomalies in percentages for 2018(units:%,with respect to the 1981-2010 average).
At the provincial scale, 21 provinces (include autonomous regions and municipalities) exhibited higher than normal annual precipitation. Of these provinces, Qinghai experienced the wettest year since 1951.In all six administrative regions of China,the annual precipitation was above or near normal.Among these regions,the rainfall was 13%more than normal in northwest China. In the seven river basins,the annual precipitation was near or above normal except for in the Liaohe River Basin,where the rainfall was 11%below normal.In the Songhua River Basin,Yellow River Basin, and Huaihe River Basin, the rainfall amounts were 21%,14%and 13%more than normal,respectively.
The winter of 2018 was relatively dry across most of China.The rainfall total in winter was 34.0 mm,which is 17% less than normal. In North China and Southwest China in particular, the total rainfall amounts were 41%and 27% less than normal, respectively. The total rainfall in spring was 142.3 mm, which is close to normal.Summer 2018 was relatively wet across most of China.The total rainfall in summer was 356.4 mm, which is 10% more than normal. Except for the middle and lower reaches of the Yangtze River where the total rainfall was 89% of the average, the other regions were all wetter than normal, especially northwest China where the total rainfall was 121%of the average.The rainfall in autumn was 127.2 mm,which is 6%more than normal.
The annual mean number of rainy days (daily precipitation greater than or equal to 0.1 mm) in China in 2018 was 103.3 d, which is close to normal. For heavy rain, in 2018, the number of days when the stations recorded a daily rainfall total greater than or equal to 50 mm was 6106, which is 2% more than normal. The heavy rain days were close to normal across most of China, with 3 ~5 d more in the local areas of central Shandong, eastern Anhui, central and eastern Sichuan,and central and northern Hainan.
For the characteristics of the rainy season, the first rainy season in South China in 2018 started later and ended earlier than normal with decreased precipitation.The onset and end of the rainy season in Southwest China were close to normal with increased precipitation. The Meiyu started later and ended earlier with decreased precipitation. The rainy season in North China started earlier and ended earlier with increased rainfall.The autumn rain in West China both started and ended later with decreased rainfall. The onset and end of the rainy season in Northeast China were close to normal with decreased rainfall.
In 2018, the number of extreme precipitation events in China was close to normal. There were 317 stations with daily precipitation reaching the extreme event standard,among which 68 stations recorded their maximum daily precipitation. 51 stations recorded their maximum continuous precipitation. In addition, 20 stations recorded their longest continuous precipitation days.
4. Major meteorological disasters and significant weather and climate events in 2018
In 2018, the losses caused by typhoons as well as lowtemperature freezing and snow disasters were extensive, whereas disasters from rainstorms, floods,droughts, severe convective weather, dust storms, and other events were relatively limited. Preliminary statistics showed that in 2018, drought-affected areas accounted for 37% of the total areas affected by meteorological disasters.Meanwhile,rainstorms,floods,typhoons,low-temperature freezing and snow disasters as well as hail accounted for 19%, 16%, 16%, and 12%of the total area affected by meteorological disasters,respectively. Meteorological disasters affected 20.81 million hectares of crops, 635 deaths or missing persons, and direct economic losses of 264.5 billion yuan. The crop-affected areas, number of deaths or missing persons and direct economic losses were all significantly less in 2018 than they were over the last 5 years (Figure 3).
4.1 Increased typhoon genesis and landfall with northern landfall positions and severe damage
In 2018,there were 29 typhoons(maximum wind force ≥8 levels near the center)in the Northwest Pacific and the South China Sea,and 10 of these typhoons made landfall.The numbers of typhoons that were generated and made landfall were both greater than normal.Compared to the 2008-2017 average, the direct economic losses caused by typhoons were extensive in 2018.
In 2018, the position of typhoon landfall was generally located in the north. Ampil, Skylark, and Wenbia successively made landfall in Shanghai within one month, whereas a total of 6 typhoons made landfall in Shanghai from 1949 to 2017. Among the 10 typhoons that made landfall, only Maria and Mangkhut made landfall as a strong typhoon, and the others were categorized as tropical storms or strong tropical storms.The average landfall intensity was 26.3 m s-1(level 10),which was weaker than the multi-year average(32.8 m s-1, level 12). In 2018, Wenbia caused the most serious damage. Since its landfall on 17 August,it produced heavy rainfall and high winds,which led to extensive damage across eight provinces, affecting 182,000 people, causing 53 deaths or missing persons,impacting more than 2 million hectares of crops, and resulting in direct economic losses of 36.91 billion yuan.
4.2 Low-temperature freezing and snow disasters frequently occurred with extensive disaster losses
In 2018, low-temperature freezing and snow disasters affected a total of 3.41 million hectares of crops, with direct economic losses of 43.4 billion yuan. Compared to the 2010-2017 average,the economic losses in 2018 were extensive.
In 2018, low-temperature freezing and snow disasters frequently occurred.In late January,a serious cold wave hit central and eastern China and caused heavy snowstorms,which affected 8.685 million people in 14 provinces and resulted in direct economic losses of 13.4 billion yuan.From 3 to 7 April,a periodic spring cold spell affected northwest China and North China, causing severe freezing damage.A total of 12.56 million people and 1.349 million hectares of crops were affected, with direct economic losses of 23.37 billion yuan. Gansu and Shanxi suffered the most serious losses.At the end of December 2018,China experienced the most significant and widespread lowtemperature freezing and snow disaster. The daily minimum temperature reached 0°C in northern South China as well as northern Yunnan.In northeastern Inner Mongolia,the daily minimum temperature was below-40°C.In general,61%of the land areas in China were affected by this low-temperature freezing and snow event.
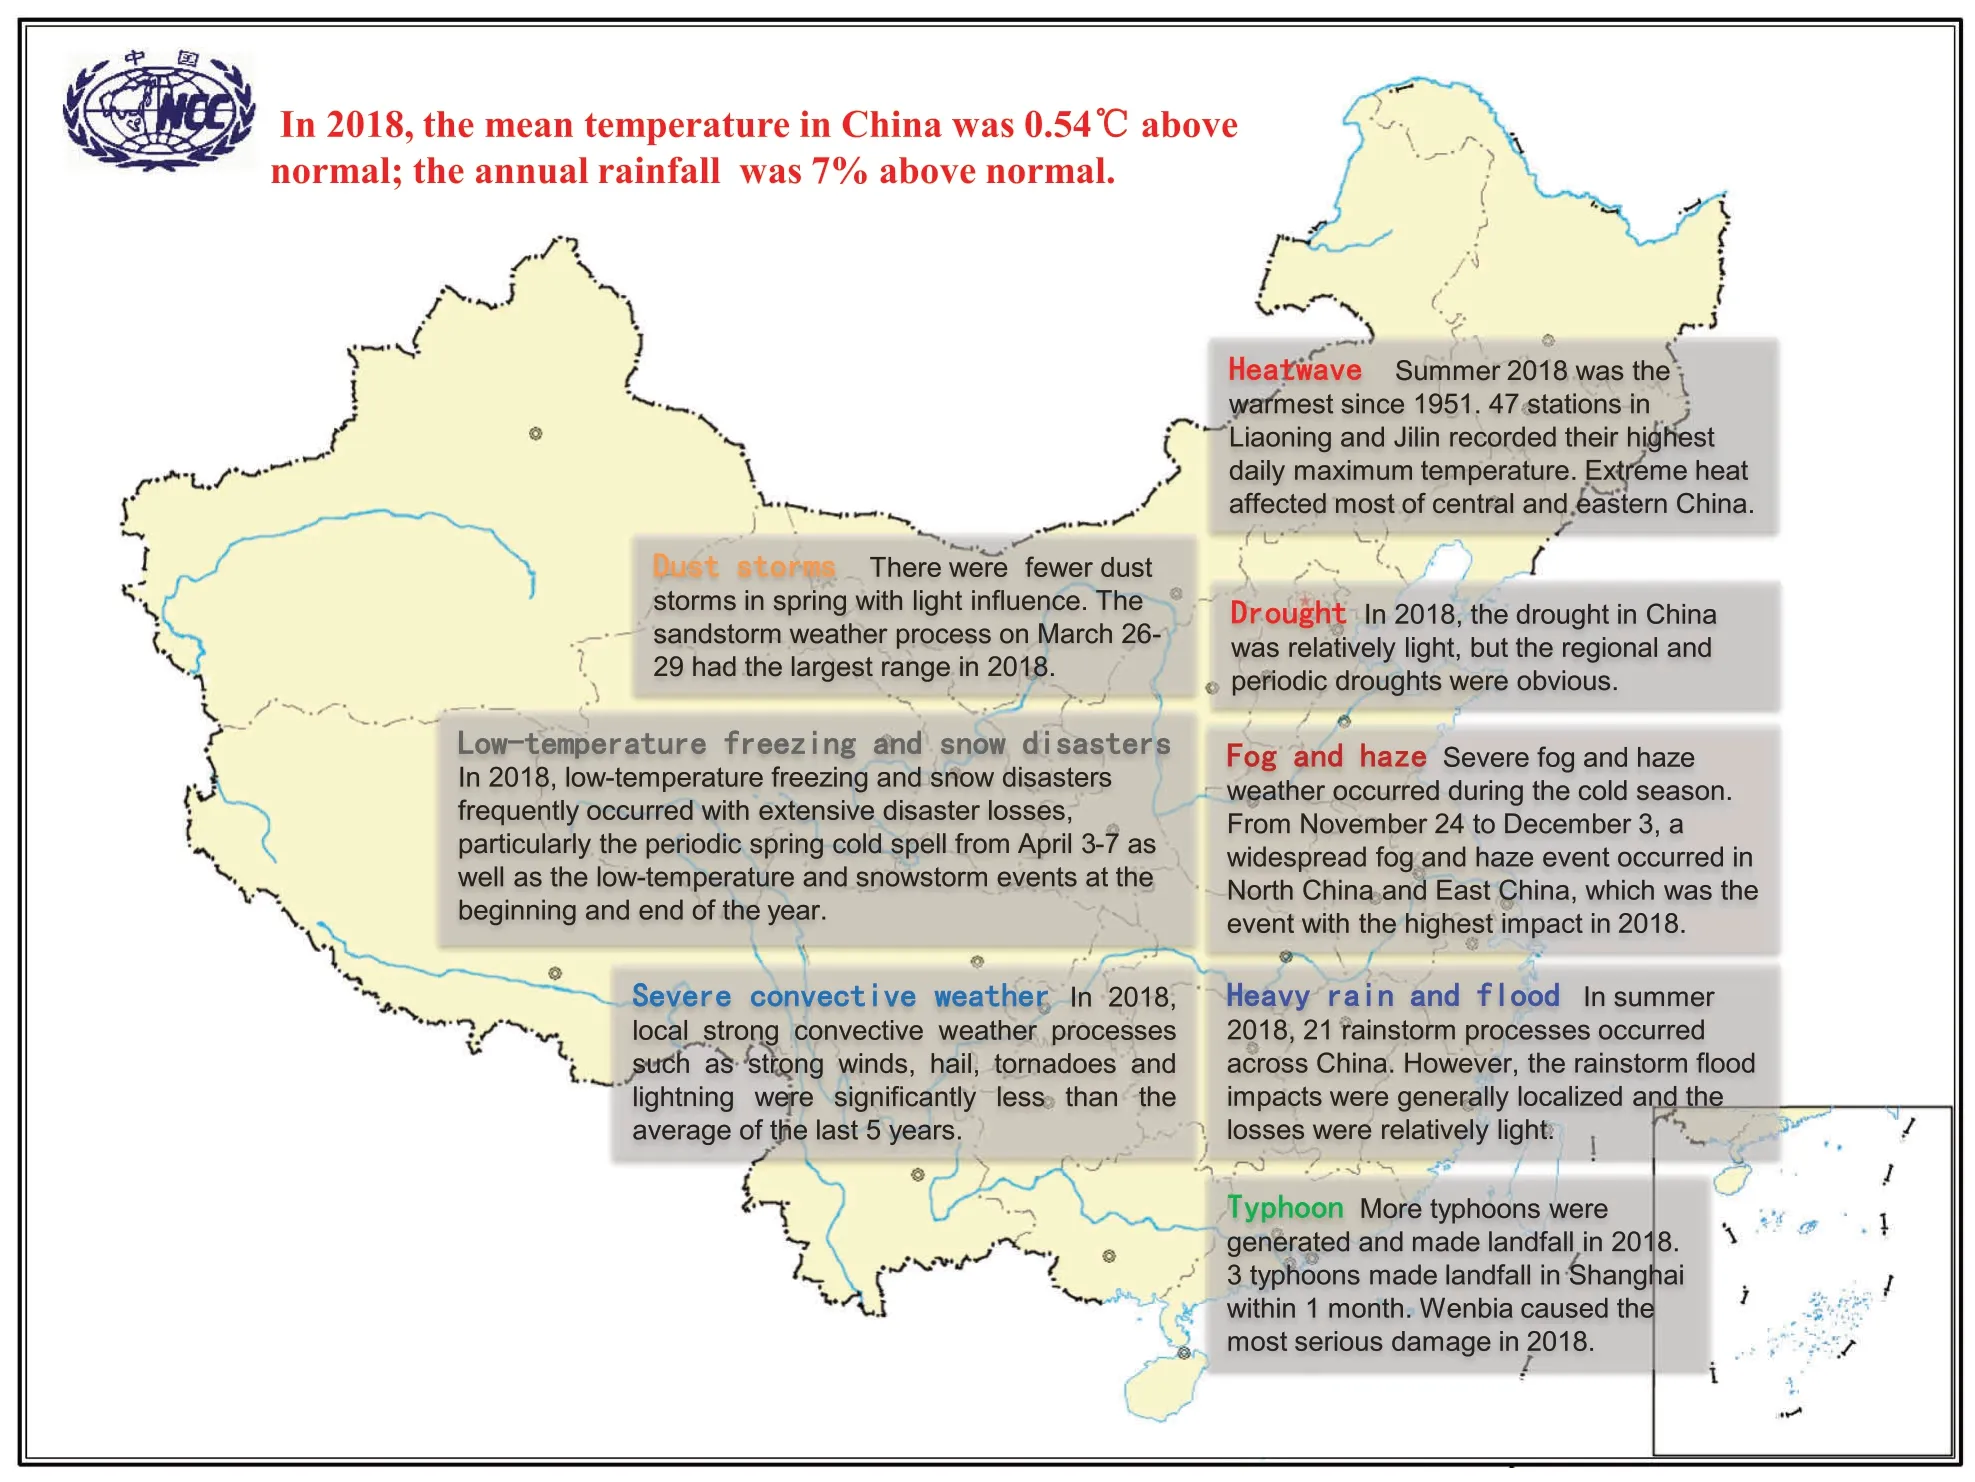
Figure 3. China's major weather and climate events during 2018.
4.3 Frequent rainstorm events in summer with relatively limited damage
In summer 2018, 21 rainstorm events occurred across China. However, the impacts of floods were generally localized, and the losses were relatively limited.
In early summer, continuous heavy rainfall in southern China led to waterlogging, landslides, and debris flows in some areas. From 18 to 26 June, Guangxi,Guizhou, Hunan, Jiangxi, and Zhejiang experienced 9 d of heavy rainfall, with the local maximum rainfall totals exceeding 400 mm. From 30 June to 8 July, continuous heavy rainfall occurred in the middle and lower reaches of the Yangtze River, with a peak total of 428 mm in Jingdezhen, Jiangxi Province.
In summer,some places in northern China also experienced heavy rainfall and floods.On 31 July,flash flooding occurred in the mountainous area of the Hami region of Xinjiang with a maximum 1-h rainfall of 29.5 mm, which caused extensive damage to farmlands, roads, railways,and power and communication facilities. On 20 July,heavy rainfall hit Lanzhou, Gansu Province, and many vehicles were washed away by the flood.
4.4 Extreme heatwaves in Northeast China as well as the central and eastern regions of China
In summer 2018, the number of high-temperature days(daily maximum temperature≥35°C) in China was 10.2 d, which is the 3rd highest since 1961, ranking behind only 2013 and 2017.
In summer, Northeast China experienced an extreme heatwave. From late July to early August, the regional mean temperature in Northeast China was 25.1°C, which was the warmest since 1961. Meanwhile, 47 stations in Liaoning and Jilin recorded their highest daily maximum temperature. From 9 July to 16 August, extreme heat affected most of Huanghuai, Jianghuai, Jianghan,Jiangnan,and northern South China.This heatwave lasted for 39 d and affected 558 counties. On July 20, the areas affected by high temperatures (above 35°C) reached a maximum of 1.6 million km2.
4.5 Obvious regional and periodic droughts with slight impacts
In 2018, the droughts in China were relatively limited,but the regional and periodic droughts were obvious.From mid-April to mid-June,droughts occurred in central and southern Northeast China as well as eastern Inner Mongolia. From mid-August to mid-September, Jianghan and western and northern Jiangnan experienced periodic droughts.From early October to early November,southern and western Huanghuai, Jianghuai, and Jianghan experienced moderate to severe meteorological droughts.Droughts affected the growth of crops in the above areas and led to high fire risks in forests and grasslands.
4.6 Less severe convective weather events with limited economic losses
In 2018, local strong convective weather events such as strong winds, hail, tornadoes, and lightning were significantly less common than the average over the last 5 years.The economic losses due to strong convective weather were generally limited as well.However,severe convective weather occurred early in 2018.From 3 to 5 March,thunderstorms,strong winds,hail,and short-term heavy rainfall occurred in Guangxi,Hubei,Hunan,Jiangxi,Anhui,Jiangsu and Henan, affecting 335,000 people and causing 14 deaths,with direct economic losses of 520 million yuan.
4.7 Fewer dust storms in spring with limited influence
Inthe spring,therewere10 dust weatherevents in northern China, which is 7 less than normal, and 3 of these events were sandstorms or strong sandstorms. Meanwhile, there were 2.3 dust weather days in northern China,which is 2.8 d less than normal.The sandstorm weather event on 26--29 March had the largest range of all events in 2018.Floating dust and sand occurred from west to east in most regions of northern China.
4.8 Severe fog and haze weather occurred in the cold season
In 2018, there were 5 large-scale, persistent fog and haze weather events in China, which is the same as in 2017.
From 15 to 22 February 2018, continuous heavy fog occurred in the Qiongzhou Strait, which resulted in poor visibility, and the ferries stopped navigation and closed. This event occurred at the end of the Spring Festival holiday when many people were traveling.Thus, many passengers and vehicles were delayed.
From 24 November to 3 December, a widespread fog and haze weather event occurred in North China and East China,which wasthe event with the highest impact in2018.The visibility in some areas of the Beijing-Tianjin-Hebei region was less than 50 m,and the hourly concentration of PM2.5in more than 40 cities reached severe pollution levels.Due to the heavy haze events,there were many delays and cancellations of flights in many airports,and several highways were closed, while the number of patients with respiratory diseases increased.
5. Conclusion
The climate in China in 2018 was slightly warmer(0.54°C above normal) and wetter (7% above normal)than normal. Multiple high-impact weather and climate events occurred in 2018, such as more northward typhoons, low-temperature freezing and snow events, heatwaves, and frequent rainstorm events.Overall, the areas of affected crops, death tolls, number of missing persons, and the direct economic losses in 2018 were all significantly less than those over the last 5 years.
Acknowledgments
The main results of this report are based on the latest climate monitoring status given by the operational system of the National Climate Center. We appreciate our colleagues' hard work on the climate monitoring and system developments.We also would like to thank Prof. ZOU Xukai, Prof. CHEN Yu,Prof. AI Wanxiu, Prof. WANG Zunya, Prof. LIU Yanju, Prof. GU Wei, Dr.SUN Shao, Ms WANG Ling, Ms ZHAO Lin, and Mr.SHI Shuai for their contributions.
Disclosure statement
No potential conflict of interest was reported by the authors.
Funding
This work was jointly supported by the National Science and Technology Fundamental Resources Investigation Project[grant number 2017FY101201] and the National Key R&D Program of China [grant number 2016YFE0102400, 2017-YFD0300201, and 2017YFA0605004].
 Atmospheric and Oceanic Science Letters2019年5期
- Atmospheric and Oceanic Science Letters的其它文章
- Enhanced correlation between ENSO and western North Pacific monsoon during boreal summer around the 1990s
- Contribution of El Niño amplitude change to tropical Pacific precipitation decline in the late 1990s
- Sub seasonal variations of weak stratospheric polar vortex in December and its impact on Eurasian air temperature
- Long-term changes in wintertime persistent heavy rainfall over southern China contributed by the Madden-Julian Oscillation
- Contribution of El Niño amplitude change to tropical Pacific precipitation decline in the late 1990s
- The impacts of modeling global CO2 concentrations with GEOS-Chem using different ocean carbon fluxes