
Soil hydraulic conductivity and its influence on soil moisture simulations in the source region of the Yellow River―take Maqu as an example
2019-11-20 13:48DongYuJiaJunWenXinWangZuoLiangWang
DongYu Jia ,Jun Wen ,Xin Wang ,ZuoLiang Wang
1.Lanzhou City University,Lanzhou,Gansu 730070,China
2.Key Laboratory of Land Surface Process and Climate Change in Cold and Arid Regions,Northwest Institute of Eco-Environment and Resources,Chinese Academy of Sciences,Lanzhou,Gansu 730030,China
3.Key Laboratory of Geographic Information Science,Ministry of Education,School of Geographic Sciences,East China Normal University,Shanghai 200241,China
4.College of Atmospheric Sciences,Plateau Atmosphere and Environment Key Laboratory of Sichuan Province,Chengdu University of Information Technology,Chengdu,Sichuan 610225,China
ABSTRACT Saturated hydraulic conductivity and unsaturated hydraulic conductivity which are influenced by soil are two important factors that affect soil water transport.In this paper,data supplied by the Chinese Academy of Sciences are used to determine true unsaturated hydrology values.Furthermore,in combination with observed,model simulation and experimental data,an improved saturated hydraulic conductivity parameterization scheme is carried out in CLM4.5 at a single point in the summer.The main results show that:(1)After improving saturated hydraulic conductivity in CLM4.5 through a parameterization modification,it is found that shallow layer soil moisture increases compared to the initial value;and(2)The numerical values of unsaturated hydraulic conductivities in the model are obviously larger than experimental values.By substituting the Brooks-Corey soil water characteristic curve into the Mualem model,the value of unsaturated hydraulic conductivity is modified;(3)By using the modified value,it is found that the attenuating magnitude of simulated soil moisture caused by each rainfall event is reduced.The soil moisture variation in shallow layers(5,10 and 20 cm)could be better displayed.
Keywords:soil hydraulic conductivity;soil moisture;source region of the Yellow River;observation
1 Introduction
The source region of the Yellow River is located in the hinterland of the Qinghai-Tibetan Plateau,China.This region is sensitive to changes in ecology,environment and climate,and it is also an important water conservation area(Shiet al.,2007).The vegetation types in this area are mainly alpine grassland,and environmental changes affect the ecological security and sustainable development of the entire region(Weiet al.,2010).
Soil moisture is closely related to local precipitation and evapotranspiration(Wanget al.,2008;Bianet al.,2012).At the same time,soil moisture and its longterm storage capacity are important for the study of carbon dioxide,water and energy cycles between the land and atmosphere.Climate change research found that the role played by soil moisture ranks second only behind sea surface temperature(Wenet al.,2003)and has a significant effect upon the global water cycle(Honget al.,2000)because it has a strong positive correlation with precipitation.Therefore,soil moisture has received much attention in the field of climate change and hydrology,as well as in agricultural research(Houseret al.,1998;Katraet al.,2007;Mostovoy and Anantharaj,2008;Entekhabiet al.,2010).Previous studies have been conducted to explore the mechanisms by which soil moisture is exchanged in land-atmosphere interactions and the energy cycle(e.g.,Entekhabiet al.,2010).Meanwhile,soil moisture has also been used to validate spatially distributed land surface and hydrological models(Wanget al.,2014).
Soil moisture is affected not only by climatic conditions but also by hydraulic transmission at different soil depths.Among the latter,saturated hydraulic conductivity and unsaturated hydraulic conductivity are two important factors that affect soil water transport.First,the soil saturated hydraulic conductivity(ks)is a key parameter that affects soil water movement,rainfall infiltration and runoff generation mechanisms.However,the vertical distribution ofksthroughout the soil profile is sometimes irregular.For example,Coquetet al.(2005)found that soil saturated hydraulic conductivity variations were not the same with an increase in depths of three sections of soil.Among them,two soil saturated hydraulic conductivity values increased when the soil depth increased and one decreased when the soil depth increased.Second,the unsaturated zone plays an important role as a link between surface water and groundwater systems(Fu and Jin,2008).There is a corresponding relationship between the matric suction and water content in unsaturated soil which is called the water characteristic curve.Unsaturated seepage coefficients can be deduced according to the water characteristic curve.For purely hygroscopic or dewetting processes,the moisture characteristic curve for the same texture is uniquely determined.The water characteristic curve is easily affected by many environmental and soil factors.The water characteristic curve is the key parameter used to simulate the transport of water and solutes in unsaturated soil.Many empirical formulae have been constructed to describe the soil water characteristic curve.The unsaturated hydraulic conductivity model created by Mualem(1976)is widely used in the indirect determination of unsaturated hydraulic conductivity due to its simple form and effective applicability.Due to the complex topography and limited site observations in the source region of the Yellow River,however,improving the parameterization scheme for hydraulic conductivity remains a great challenge in CLM4.5.
Since numerical models can describe land-atmosphere exchange processes accurately,they provide an effective guarantee for the accurate simulation of the East Asian and even global climate(Chen and Sun,2005).In recent years,to enhance the understanding of land-atmosphere exchange processes,researchers have coupled land surface models(LSMs)and a variety of weather patterns(Zhanget al.,2015).These studies show that land surface processes remain one of the main aspects used to improve simulation accuracy and prediction accuracy of the general circulation model(Xinet al.,2006).In recent years,the CLM has been widely used at the global scale.Laiet al.(2014)ran CLM4.0 using the Princeton University forcing field and found that,by analysing the simulation results for the Chinese region,the results show that CLM4.0 can reflect the spatial distribution characteristics of soil moisture in China to a certain extent,but they also found that the simulation values in some areas were higher than the observations.Swenson and Lawrence(2015)put forward a formula of soil resistance to resolve the excessive evaporation of soil moisture in CLM4.5.However,there are few studies on the improvement of the parameterization of CLM4.5 for the source region of the Yellow River,China.
As mentioned above,CLM is advantageous for the simulation of land surface processes.However,the parameterization scheme for saturated hydraulic conductivity and unsaturated hydraulic conductivity adopted by CLM has not changed to account for different locations.At the same time,the coefficient for water conductivity is closely related to local soil properties.The same value may provide incorrect initial conditions for the model simulation and may then affect the simulation results.The most effective method to solve these problems is to develop a water transfer parameterization scheme suitable for the study area.
This paper takes a new approach to evaluating the CLM4.5 model performance and assessing uncertainty;the aim is to improve the parameterization scheme and evaluation scheme methods.In other word,when assessing model performance,we ask two questions:
(1) Is the saturated hydrology parameterized scheme in CLM4.5 suitable in Maqu?
(2)Is the original unsaturated hydrology value correct in Maqu?
To address these questions,this investigation is mainly focused on the following three purposes.First,the study area and data will be described and features of the underground surface will be introduced.In the next section,soil moisture changes and characteristics will be concisely analyzed.Following this,specific methods are introduced,including the measurement of saturated hydrology and the deduction method of unsaturated hydrology value.Then,we will use the aforementioned methods to calculate the hydrology values and the results will be applied into the CLM4.5 model.The comparison of different schemes simulated results are also in this part.Finally,the conclusions of this study are summarized, drawbacks are discussed,and further research is proposed.
2 Materials and methods
2.1 Study area and datasets
Maqu County is located in the source region of the Yellow River at the junction of Gansu,Qinghai and Sichuan Provinces,China.Its geographical position is in the eastern part of the Qinghai-Tibetan Plateau(33°06′N to 34°30′N,100°45′E to 102°29′E).The altitude ranges from 3,300 m to 4,806 m above sea level.Maqu County covers a total area of 9.605×10⁵hm2,has access to pastureland with an area of 8.303×10⁵hm2and has a total population of 37,100.Maqu County is affected by the Qinghai-Tibetan Plateau and the East Asian monsoon continental climates.The climate is dry in the winter and rainy in the summer(Tianet al.,2011).The annual average temperature ranges from 1-2°C,average wind speed is 7.5 m/s,maximum wind speed is 36 m/s,average annual sunshine is 2,583.9 h,annual precipitation is 596.4 mm,and annual evaporation is 1,353.4 mm.
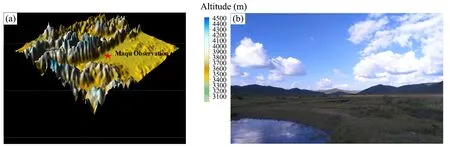
Figure 1 The surrounding terrain of the Maqu observation station(a)and surface vegetation conditions(b)
The soil temperature and soil moisture in this study are measured using ECH20 EC-TM soil moisture sensor and collected with an ECH20-EM5O automatic data recorder box constructed by the Decagon Equipment Company of America.The probes are laid out at 5,10,20 and 40 cm depths from the ground surface with a soil moisture sensing resolution of 0.001 m3/m3and an observation interval of 30 min.CLM4.5 uses the observational data of Maqu County,which was collected by the Northwest Institute of Eco-Environment and Resources,Chinese Academy of Sciences(33°55′N,102°09′E).Simulation results range from June 1 to August 31 of 2016 due to the sensitivity of a land surface model to the initial value and the"memory"of the soil,and considering the limited data length.At the same time,soil components of soil samples were collected at two places in Maqu and collected four samples at every soil depth(Table 1).

Table 1 Soil texture components
2.2 Main methods
2.2.1 Saturated hydraulic conductivity measurements
In this paper,the coefficient of soil permeability is measured using the variable head method.The diameter of the variable head tube is 1 cm,the diter of the sample device is 5 cm and the device height is 4 cm.The test interval is 5 min,and the permeability coefficient is calculated according to the following formula:

where"a"is the section area of the variable head tube;Lis the height of the sample,which is 4 cm in the test;t1andt2are the starting and stopping times,respectively;H1andH2are the heights of the starting and stopping heads,respectively;and A is the crosssectional area of the sample.
2.2.2 Unsaturated hydraulic conductivity
The formula for calculating unsaturated hydraulic conductivity can be written in the following form:
In Mualem(1976)model,kris the relative hydraulic conductivity;k0,which cannot be measured directly,is a parameter related to the pore radius.Maulem considered thatk0is equal to the saturated hydraulic conductivityks.However,in his model,k0is a point on the unsaturated conductivity curve,and its mechanism is not exactly the same as that ofks.The correction for the water conductivityk0,which cannot be measured directly,becomes an important problem in the indirect determination of unsaturated hydraulic conductivity.In this paper,using the method proposed by Zhanget al.(2015),the volumetric soil moisture of a pore with pore radiusRmincan be expressed by the integral form off(r),which is the volumetric content of pore water:

whereθris the soil residual volumetric humidity;andRmaxandRminis the maximum and minimum pore radius(m)respectively.
The radius"r",given by the Young-Laplace equation in the capillary model is related to the corresponding suction as follows:
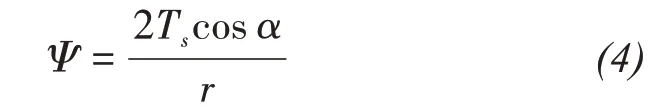
where Tsis the surface tension of water,andαis the contact angle.
The water characteristic curve model proposed by Brooks-Corey(Mayret al.,1999)is as follows:

whereθsis the saturated water content,θris the residual water content,Ψis the matrix suction,Ψeis the inlet value,andλis the pore size distribution index which can be obtained based on the water characteristic curve.
Mualem(1976)proposed that the probability of a radius "r" and porosity "ρ" isρf(r)f(ρ). Becauseρf(r)f(ρ)does not reflect the water flow direction,a tortuosity factorT(0<T<1)and pore shape parameterMare introduced:
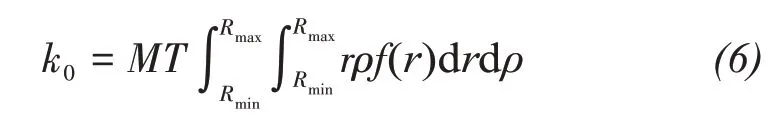
Equations(3),(4)and(5)can be integrated to form(6)for an integral change.

Therefore,the corrected hydraulic conductivity is as follows:
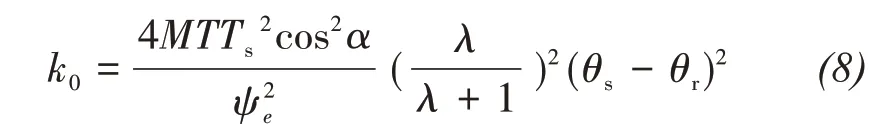
At the same time,the product ofMandThas a power-based exponential relationship with the effective volumetric humidity,which is presented below:

whereBandlare constants.Mualem(1976)proposed that the exponent oflshould be 0.5.Substituting(9)into(8):

According to Zhanget al.(2015),the parameter"A"in Formula(10)can be considered a constant for different soil types,and its value is 0.00728.
After the Brooks-Corey soil water characteristic curve model is introduced into the Mualem model,the relative hydraulic conductivity is as follows.
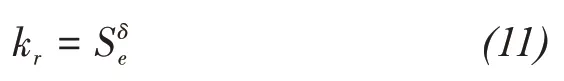
where:

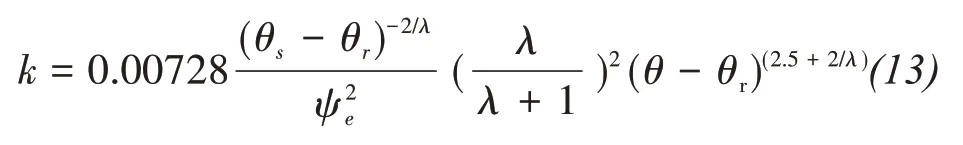
Adding Equations(10),(11)and(12)into Equation(1)yields the following expression:
2.2.3 Water characteristic curve
In addition,the tensiometer,the pressure membrane method and the sand core funnel method are three main methods which are used for water characteristic curve measurements.In this paper,the pressure curve method is used to determine the soil water characteristic curve,which is used to determine the soil matric potential by changing the pressure potential.The pressure film is composed of a porous,clay plate sealed in an airtight device with a water outlet pipe connected below,which communicates with the outside air.During the tests,samples are collected from undisturbed soil at different depths(5,10,20 and 40 cm)using a foil sample.Then,the soil samples are cut on both sides,placed onto filter paper and pressed onto the pressure plate.As the pressure rises,the soil water potential should increase.When the soil water potential is greater than the seepage pressure of the clay slab,the water will flow out of the soil sample.As the water flows out,the soil moisture decreases and the matric potential decreases.Immediately after the matric potential of the soil decreases to the point that the pressure potential due to the applied pressure is offset,the flow ceases.At this point,the matric potential of the soil is equal to the negative value of the applied pressure.When the initial humidity of the soil is known,the corresponding soil moisture can be obtained by measuring the flow quantity.Pressure is gradually added(0,20,50,100,150,200,250,300,and 350 kPa)and the above process is repeated,after which numerical series of the soil matric potential and soil moisture are obtained,and finally the water characteristic curve is retrieved.

Figure 2 Soil profile sampling at different depths(left)and a pressure film apparatus(right)
2.2.4 The introduction of CLM4.5
CESM is a coupled climate model for simulating the Earth's climate system that consists of a single model to simulate the Earth's atmosphere,oceans,land,land ice,and sea ice in addition to a central coupler component.The land surface process model(CLM,community-developed land surface model)was originally designed to provide land support for NCAR(National Center for Atmospheric Research),CAM(Community Atmosphere Model)and CCSM(Community Climate System Model)(Daiet al.,2003).
Among them,CLM4.0 has improved land surface processes,including more complex parameterization schemes for expressing soil hydraulic conductivity and snow processes.The hydrology updates include modifications wherein the hydraulic properties of frozen soils are only determined by their liquid water content rather than by their total water content in addition to the introduction of an ice impedance function;other corrections are included that increase the consistency between the soil water state and water table position and allow for a perched water table above icy permafrost ground(Swensonet al.,2012).Finally,the predominantly low-resolution input data provided for CLM4.0 to create surface datasets are replaced with newer and higher-resolution input datasets where possible.The default meteorological forcing dataset provided with CLM4.0(Qianet al.,2006)is replaced by the 1901-2010 CRUNCEP forcing dataset for CLM4.5,although users can also still use the Qianet al.(2006)dataset or other alternative forcing datasets.For more CLM4.5 improvements,component information can be obtained in the CLM45_technote (http://www.cesm.ucar.edu/models/cesm1.2/clm/CLM45_T ech_Note.pdf).
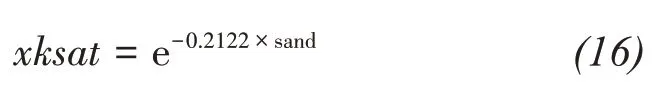
The original relationship between saturated hydraulic conductivity and sand content in CLM4.5 is as follows(Daiet al.,2003):

In CLM4.5,unsaturated hydraulic conductivity is calculated using the method of CLM3.0 TechNote(Daiet al.,2003),which is presented below:

3 The CLM4.5 Parametric scheme improvement in the source region of Yellow River
3.1 Parametric scheme improvement for the saturated hydraulic conductivity in CLM4.5
The soil saturated hydraulic conductivity(ks)is a key parameter that affects soil water movement,rainfall infiltration and runoff generation mechanisms.Many hydrological models show that it decreases as soil depth increases(Ibbitt and Woods 2004;Hwanget al.,2012).However,the vertical distribution of soil saturated hydraulic conductivity within the soil profile is sometimes irregular.For example,Coquetet al.(2005)found that saturated hydraulic conductivity values in three cultivated soils of France changed differently with an increase in soil depth.Two of those values increased with an increase in soil depth while the other decreased with an increase in soil depth after a period of time.Therefore,to simulate soil moisture accurately using CLM4.5,it is necessary to analyse the variation in soil saturated hydraulic conductivity with soil depth in the Maqu area.
The test used was the variable head method.Soil samples were collected in each soil layer,and 10 groups were measured at intervals of 5 min.The saturated hydraulic conductivity reached a steady value after 45 min.There are some differences in the range of saturated hydraulic conductivities at different depths(from Figure 3a),in which saturated hydraulic conductivity of shallow soil varies greatly due to the instability of the soil state during the initial stage of measurement.Finally,the average value of the final two values in Figure 3b is used as the corresponding saturated hydraulic conductivity at each depth.

Figure 3 The numerical distribution of saturated hydraulic conductivities at different depths(a)and their variation with time(b)
As presented in Figure 3a,saturated hydraulic conductivity values obtained by using experimental data(obtained by using the variable head method)and the model simulated data are different at each depth.The test data have an obvious decreasing trend while the calculated data from the original model show an unnoticeable decline trend.The results show that the simulation of saturated water conductivity with increasing soil depth in CLM4.5 is not accurate in the Maqu area,and a new parameterization scheme should be adopted to improve conductivity.
Based on experimental data(obtained by using the variable head method)and the relationship between saturated hydraulic conductivity and the sandy soil content in the original model,the new relationship applied to shallow soil in the Maqu area is presented as follows:
Differences in the simulated soil moisture before and after a correction for saturated hydraulic conductivity are described hereafter.
As observed from Figure 5,a decrease in soil saturated hydraulic conductivity with an increase in depth will reduce the movement of soil water to greater depths,and soil moisture in the shallow layers will increase(e.g.,Figure 5 at 10 cm and 20 cm depths,where the soil moisture increases significantly).This change concurs with the fact that soil moisture at depths of 10 cm and 20 cm is larger in actual observations.After the improvement of the parameterization scheme,the change in soil moisture is more consistent with actual observations.

Figure 4 The parameterization scheme correction.(a)Test data of saturated hydraulic conductivity values compared with those of the original model.(b)The establishment of the new parameterization scheme

Figure 5 CLM4.5 simulation variations in soil moisture at different depths(corrected values minus initial values)
3.2 Parametric modification of unsaturated hydraulic conductivity
The water retention curve(WRC),also known as the soil water characteristic curve(SWCC),is defined by the relationship between the degree of saturation(or volume humidity)and suction(Huet al.,2013).Figure 6 shows a typical water characteristic curve along with some of its key features.The discharge is stopped when the matric potential of soil decreases to the point where the pressure potential due to an applied pressure has just been offset.At this point,the matric potential of the soil is equal to the negative value of the added pressure.Figure 6 shows that initial values of soil moisture are variable at different soil depths due to influences of soil density and composition.According to the distribution of soil porosity,soil moisture decreases from shallow to greater depth.However,the final soil moisture that remains at different depths is basically the same.
As presented in Figure 7,soil water characteristic curves for different depths in the Maqu region fit well,for whichR2values are all greater than 0.92.Through the fitting formula,the residual error is less than 0.03522,indicating that the fitting formula for the soil water characteristic curve can reflect variations of soil moisture under different pressures.This provides us with supporting data for the parametric improvement of unsaturated soil hydraulic conductivity.According to Formula(5),Ψeandλcan be calculated.At the same time,according to Formula(13),the hydraulic conductivitykcan be calculated.Table 2 shows the parameters for the numerical fitting at different depths.

Figure 6 The variation of soil moisture under different pressures in the Maqu area
As presented in Table 2,numerical values of unsaturated hydraulic conductivity at different depths are slightly variable and reach their maximum value at 10 cm depth.
A fixed value of 0.1 mm/d is used in the original model,which is slightly different from the experimental results.Therefore,values of unsaturated hydraulic conductivity tests at different depths are averaged,the result of which is 0.0263 mm/d.This value is then substituted into the model.
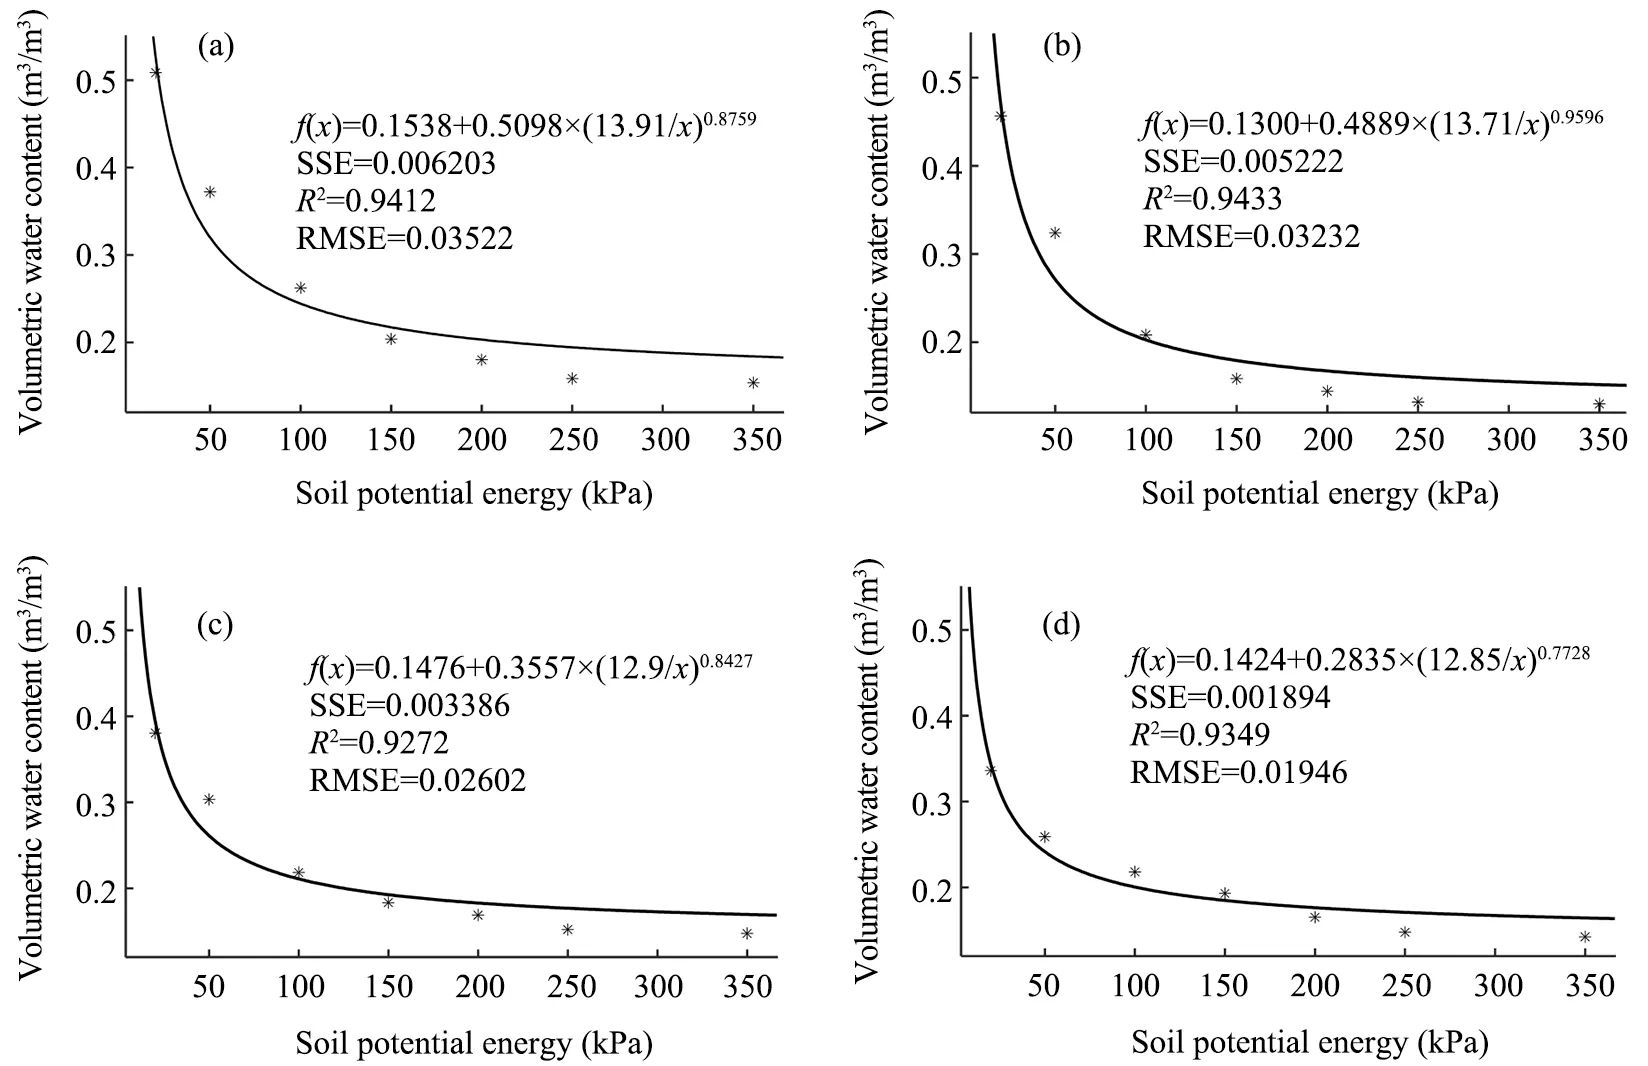
Figure 7 The curve fitting of soil water characteristic curves at different depths.(a)5 cm,(b)10 cm,(c)20 cm,and(d)40 cm
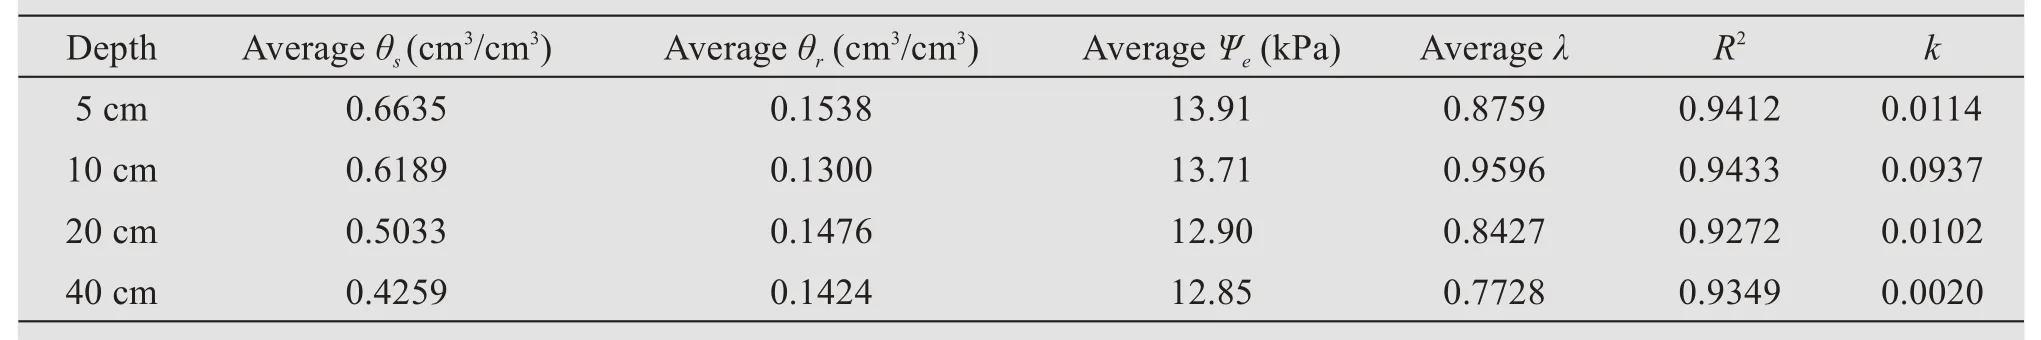
Table 2 Parameters for the soil water characteristic curve using a numerical fitting model and unsaturated hydraulic conductivity values
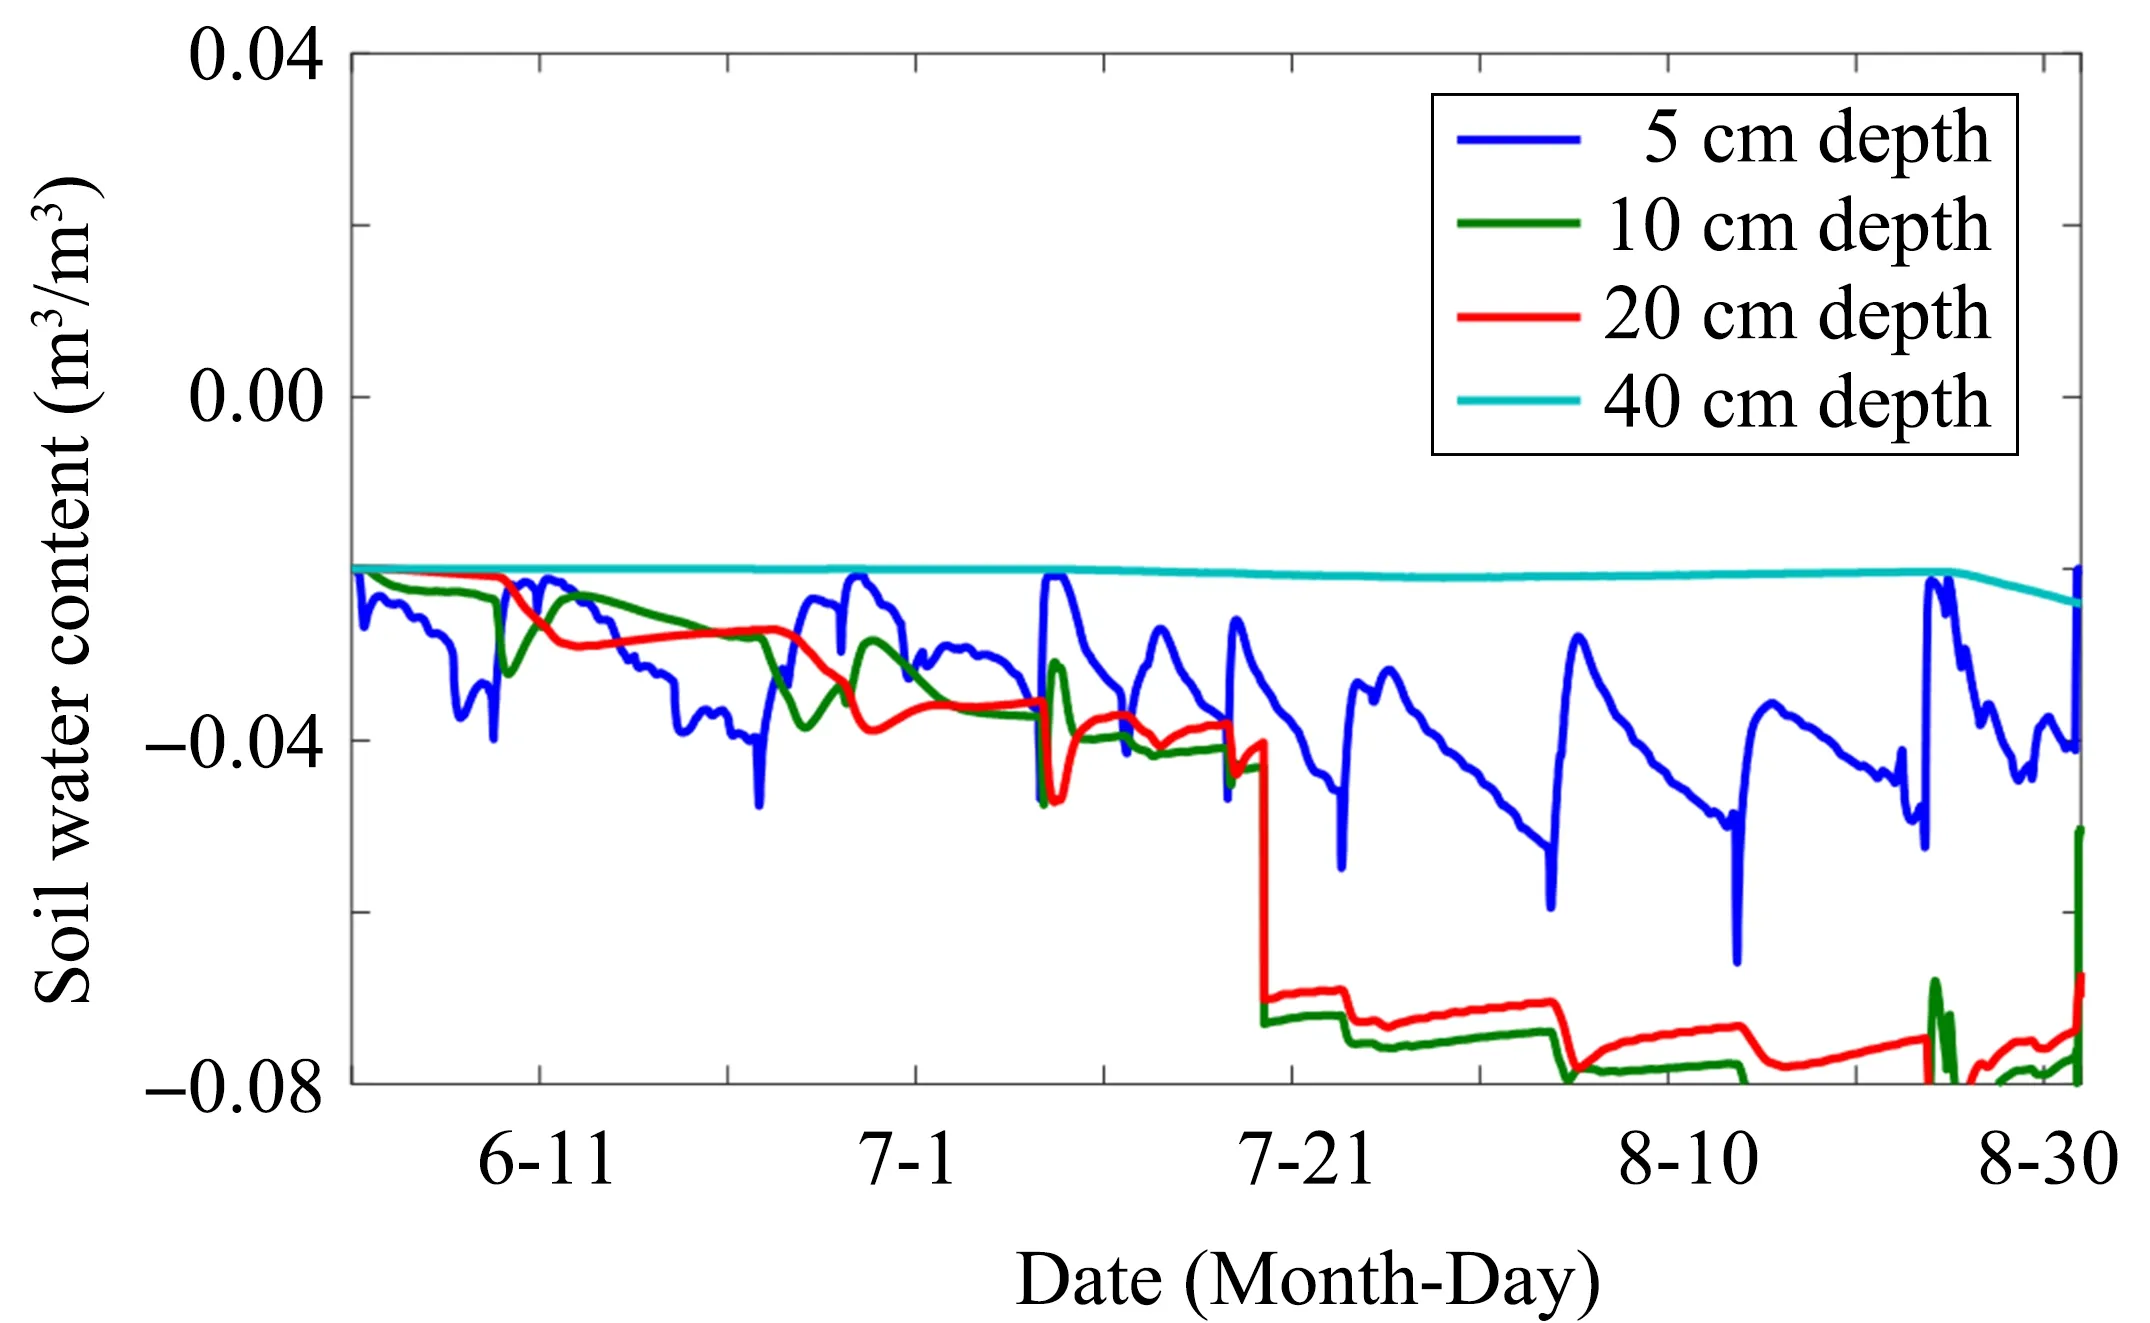
Figure 8 The variation of soil moisture before and after the parametric improvement of unsaturated hydraulic conductivity
3.3 Simulation effect after parameterization scheme modification
The simulation differences before and after the parametric improvement are presented in Figure 9.For a shallow depth of 5 cm,the parametric improvement mainly increases the attenuation range of the soil moisture after each rainfall.At the same time,soil moisture simulation values at depths of 10 cm and 20 cm are also significantly reduced,which modifies the soil moisture simulation errors(in contrast to Figure 9).However,when the unsaturated water conductivity at 40 cm depth decreases,the value of the soil moisture changes little.
Figure 9 shows a comparison of simulated values after the parameterization of each parameter with the initially simulated and observed values.To show the simulation effect of the model on the weather process,the observed precipitation data during the same period are added.As seen from Figure 9,the simulated effect of CLM4.5 on the variation of soil moisture following precipitation is ideal.Simulated values before and after the improvement can show the increase in soil moisture after precipitation and subsequent attenuation.Modifications to CLM4.5 mainly reduce the soil moisture at a shallow 5 cm depth and fix the problem of high simulation values.At the same time,due to changes in saturated hydraulic conductivity and unsaturated hydraulic conductivity,the downward migration of water slows down and soil moisture values at depths of 10 cm and 20 cm are increased.Additionally,it can be seen from Table 2 thatRvalues of soil moisture at depths of 5 cm and 10 cm(under the premise of no obvious change in theSSEorRMSE)has improved to a certain extent.However,from Figure 9d and Table 3,it is easy to observe that simulation results for soil moisture at a depth of 40 cm before and after parametric improvement have not been improved,and simulated values are still significantly lower than observed values.This is because soil moisture at a depth of 40 cm is mainly affected by the upward migration of soil water from the depth which deeper than 40 cm and is not affected by precipitation in the short-term.The simulation and parametric improvement of soil moisture at greater depths will be explored in further studies.
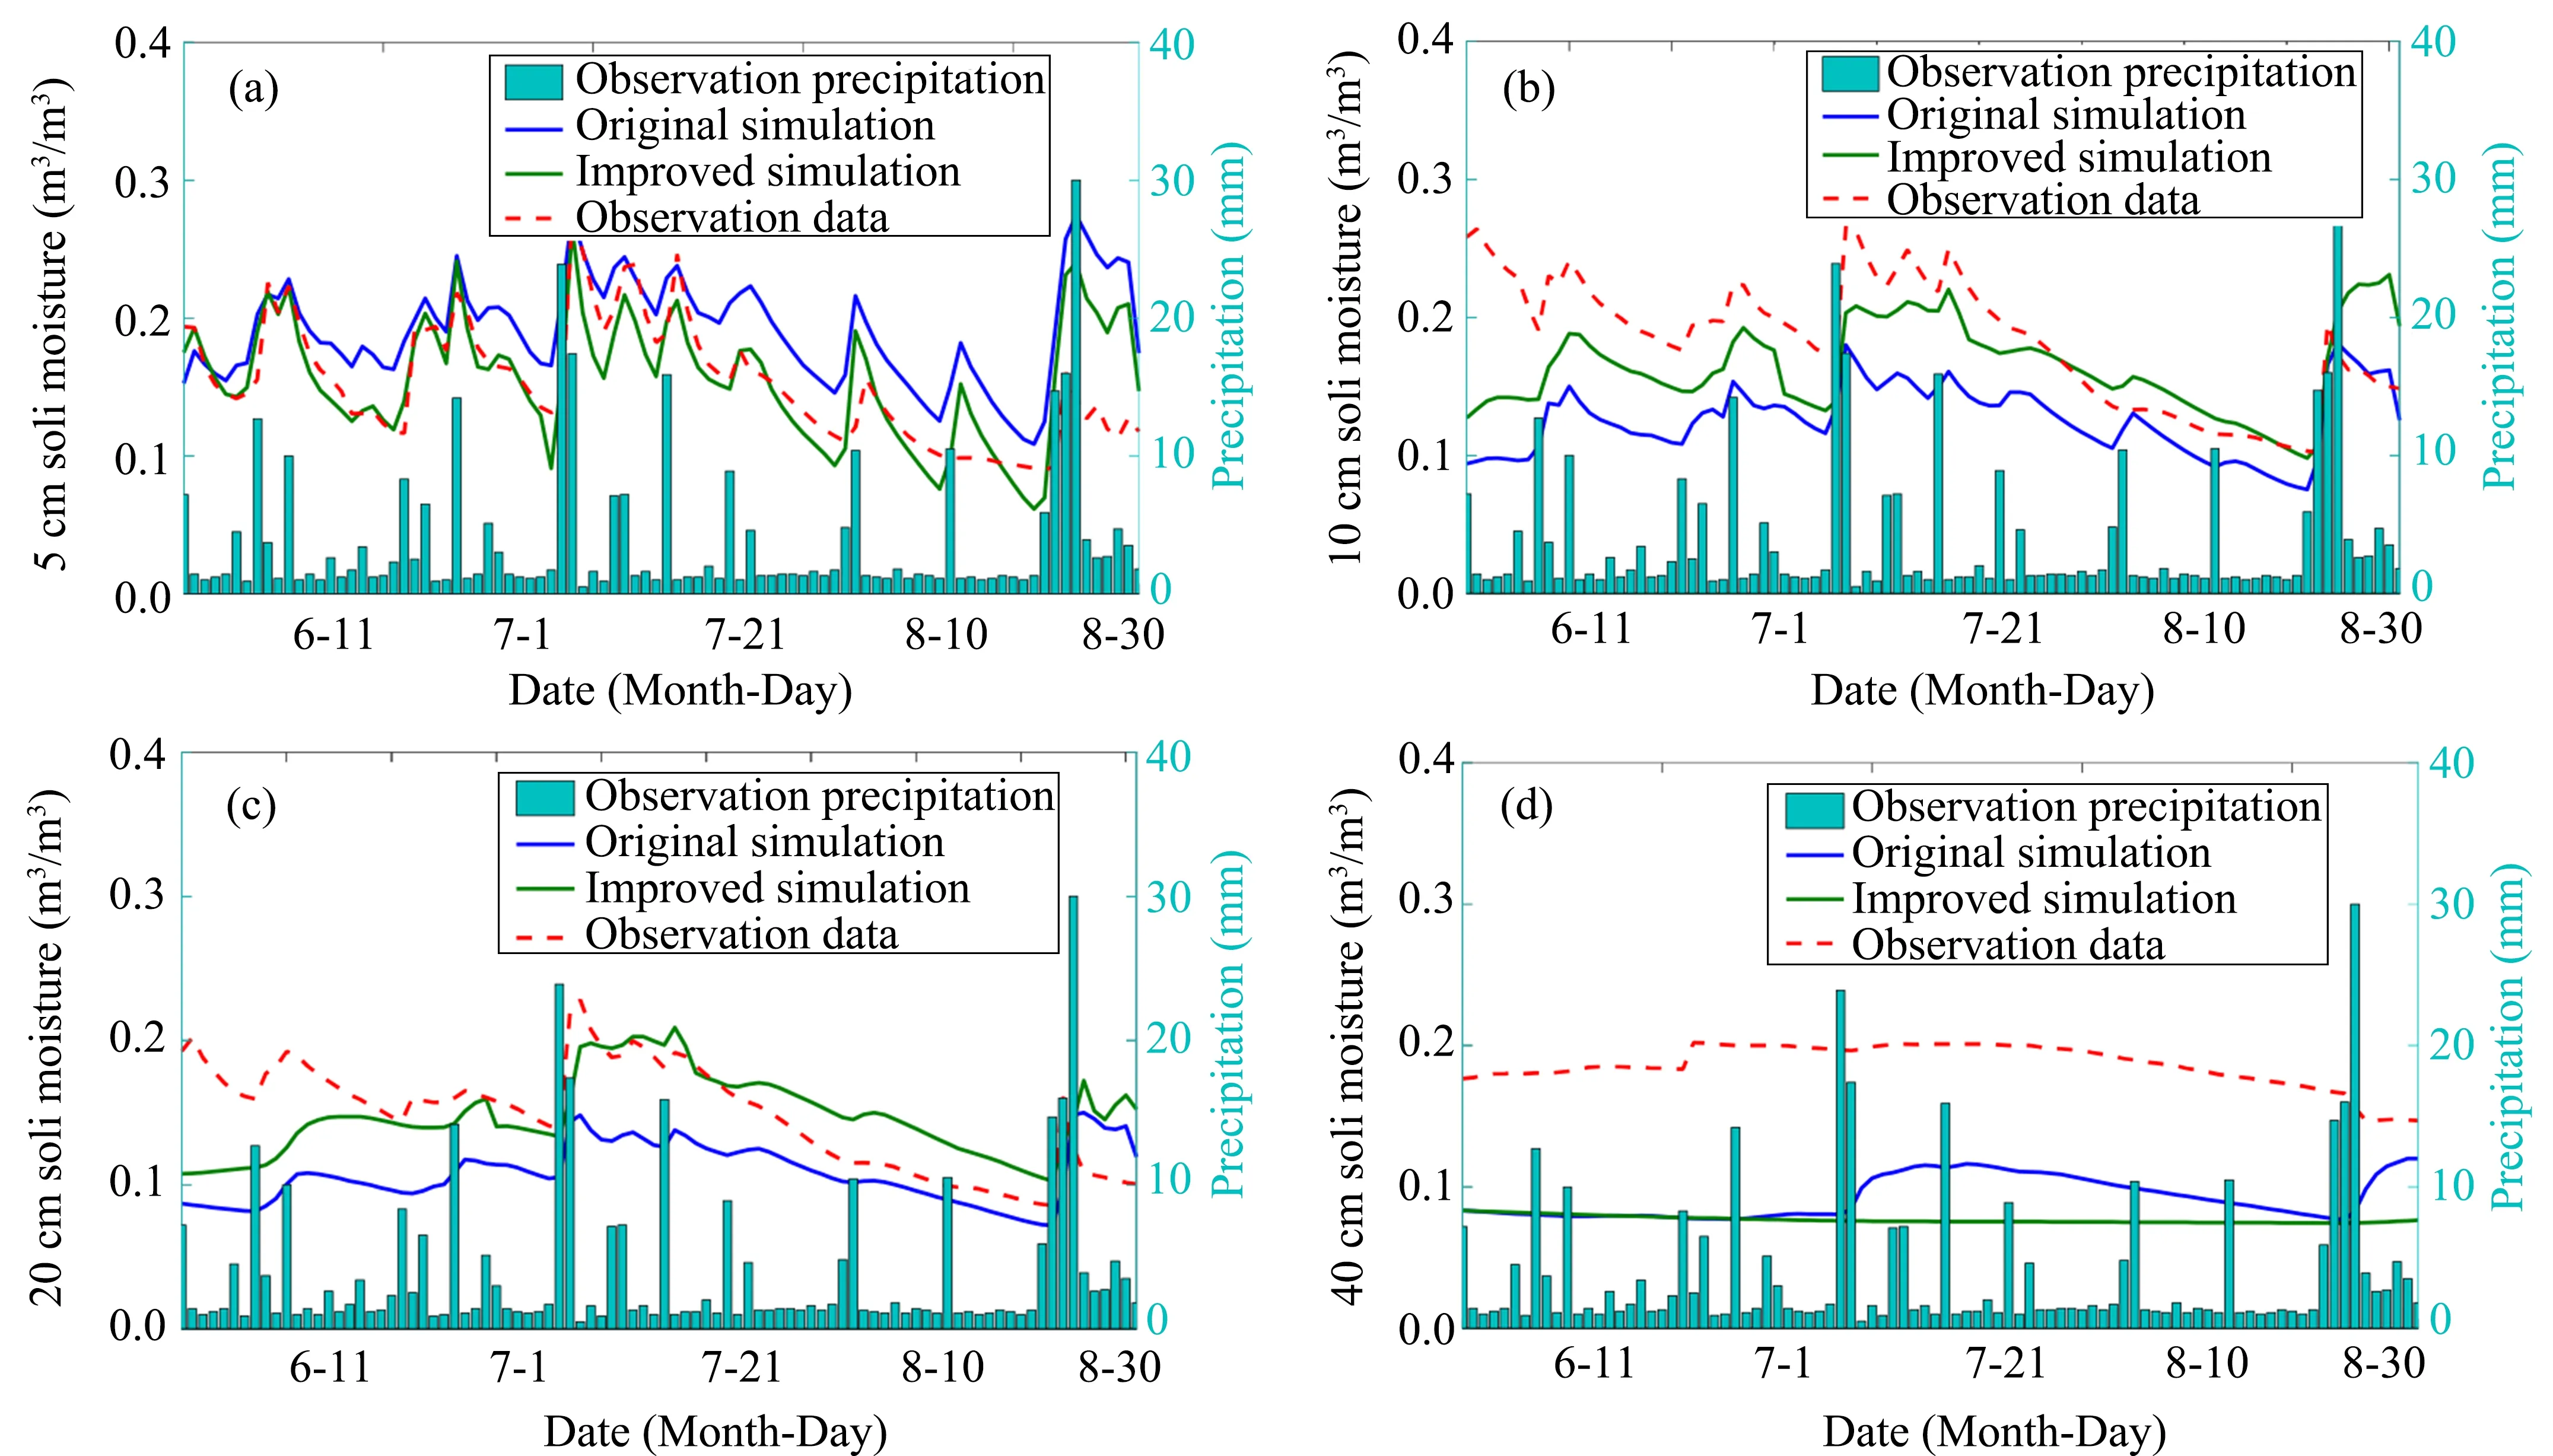
Figure 9 Comparisons between observed soil moisture and the original simulation and improved simulation of the soil moisture at(a)5 cm,(b)10 cm,(c)20 cm,and(d)40 cm depths
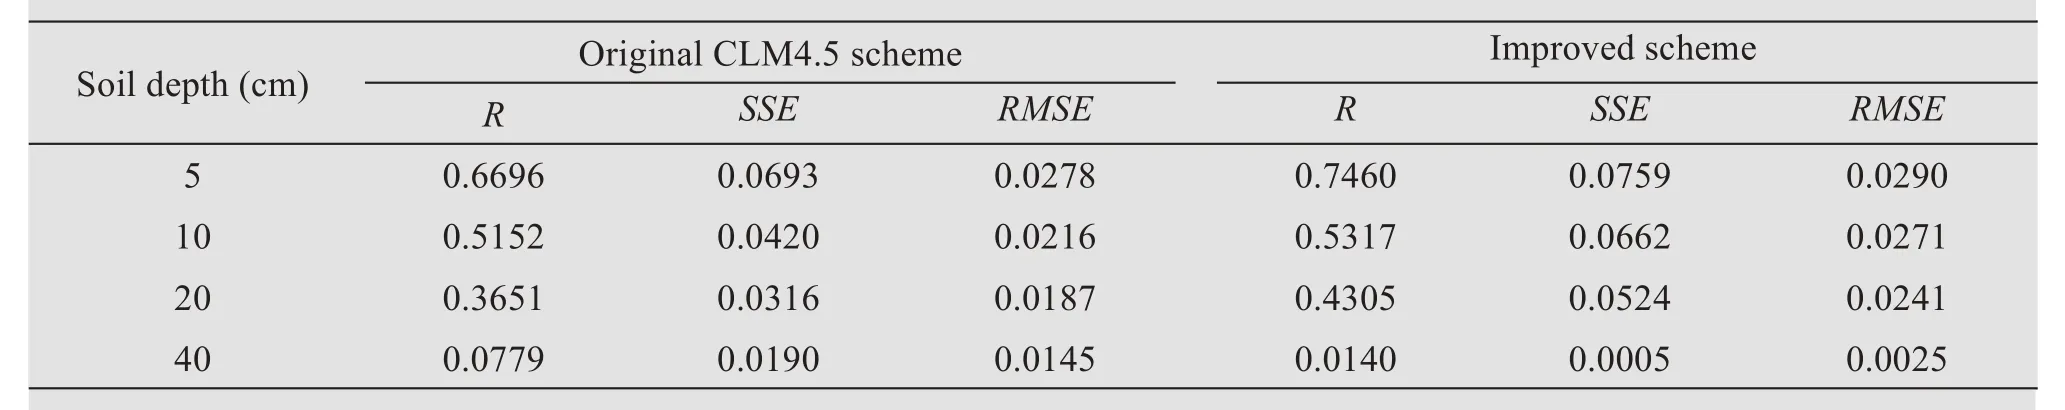
Table 3 Statistical values for simulated and observed soil moistures in CLM4.5 for the two schemes
4 Discussion and conclusions
In this paper,characteristics of water and heat variations in the Maqu area were analysed by utilising observation data of soil temperature and soil moisture and eddy observation data in 2016.At the same time,with a combination of experimental data(obtained by using the variable head method and Water characteristic curve)and observational soil moisture data,parameterization schemes for saturated hydraulic conductivity and unsaturated hydraulic conductivity in CLM4.5 are improved,the main conclusions of which are as follows:
(1)Measured and original simulated saturated hydraulic conductivity values differ slightly in shallow soil layers. However, with the deepening of soil depth,the difference between them becomes larger.After parametric improvement,it is found that the simulation effect of soil saturated hydraulic conductivity has been greatly improved,which is basically consistent with observed values.
(2)After parametric improvement of unsaturated hydraulic conductivity in CLM4.5,it is found that the change trend of soil water content before and after precipitation is more in line with the actual situation.Simulated values of soil water content at depths of 10 cm and 20 cm are smaller than the initial ones,and simulated results have been improved greatly.
(3)As observed from the effects of the overall simulation,and following parametric improvement of saturated hydraulic conductivity and unsaturated hydraulic conductivity, the numerical values of soil moisture and their variation trend are closer to actual observed values in shallow layers(5,10 and 20 cm).At the same time,CLM4.5 has an improved simulation effect on the increase and attenuation of soil moisture after precipitation.However,simulated soil moisture values in the deep layer(40 cm depth)before and after the improvement are significantly lower than the observed data.Because the soil moisture at a depth of 40 cm mainly depends on the upward migration of water,saturated and unsaturated hydraulic conductivities have little influence on it.
In this study,the test data are taken as the"true data"and applied in CLM4.5.Due to time constraints,the collected soil samples are all covered by alpine meadow in Maqu.However,the underlying surface types,altitude and soil types are diverse in the source region of the Yellow River.Future research should select a variety of soil samples covered by the different underlying surface to obtain the parameterized scheme applicable to the whole region,and verify it in the whole area.In addition,the process of soil freezing and thawing will affect the process of soil moisture transmission.Future research should focus on the application of parameterized water transmission scheme in the process of soil freezing and thawing.
Acknowledgments:
This study was supported by funding from the National Natural Science Foundation of China(Grant No.41530529),the Opening Fund of Key Laboratory of Land Surface Process and Climate Change in Cold and Arid Regions,CAS(Grant No.LPCC2018006),the National Natural Science Foundation of China(Grant Nos.91737103 and 41661014),Gansu Natural Science Foundation(18JR3RA221)and the Lanzhou City University Doctoral Research Initiation Fund(Grant LZCU-BS2019-13).The authors are grateful to the anonymous reviewers for their constructive comments.
 Sciences in Cold and Arid Regions2019年5期
- Sciences in Cold and Arid Regions的其它文章
- Editors-in-Chief Guodong Cheng and Ximing Cai
- Origin and advances in implementing blowing-snow effects in the Community Land Model
- Analysis of chaotic climatic process in the Tarim River Basin(I)
- Seed germination and seedling growth of Pycnanthus angolensis(Welw.)Warb.,African false nutmeg
- Features on N/P ratio of plants with different functional groups between two types of steppe in semi-arid area
- Qualitative and quantitative phytochemical analysis of selected mosses with different alcoholic solvents