QTL Mapping for Main Stem Height, First Branch Length and Branch Number Based on a High-Density Linkage Map in Peanut (Arachis hypogaea L.)
2019-10-22 09:21-,-,-,-,-,,-,-,-*,*
花生学报 2019年2期
-, -, -, -, -, , -, -, -*, *
(1. Shandong Peanut Research Institute, Qingdao 266100, China;2. Weihai Seed Management Station, Weihai 264200, China;3. Qingdao Agricultural Radio and Television School, Qingdao 266071, China)
Abstract: The genetic basis for plant architecture traits in peanut (Arachis hypogaea L.) is poorly understood. This study characterized quantitative trait loci (QTLs) underlying peanut main stem height (MSH), first branch length (FBL) and branch number (BN), using a high-density genetic linkage map in a recombinant inbred line (RIL) population derived from Huayu28 and P76. The map consists of 2266 SNPs and 68 SSRs covering a genetic distance of 2586.37 cM. The average distance between adjacent markers was 2.25 cM. A positive correlation was found between MSH and BN (r=0.354), FBL (r=0.854). QTL analysis showed 18 additive QTLs (four MSH, five FBL, and nine BN) mapped to 10 chromosomes. While most QTLs were identified in only one environment, qMSHA01.1 for MSH, qFBLA01.2 for FBL, qBNB07.1 and qBNB07.2 for BN were in two environments. Besides, 24 pairs of epistatic QTLs were identified for MSH, FBL, and BN; all of which accounted for phenotypic variation explained (PVE) less than 10%. These results provide a foundation for fine mapping and cloning of genes affecting plant architecture and the design of molecular breeding in peanut.
Key words: branch number; epistatic effects; first branch length; main stem height; peanut; QTL; SNP; SSR
1 Introduction
The cultivated peanut (ArachishypogaeaL.) is an important oil and food crop widely cultivated in Asia, Africa, America, and Australia. China is the world's largest producer of peanut with 16.48 million tons in 2014, which amounted to a world share of 37.5%[1], but still can't meet the huge marketing needs. To further improve peanut yield and breeding selection efficiency, a clear correlation between yield and main stem height (MSH), first branch length (FBL), branching number (BN) needs to be clarified. These traits have contributed to grain yield in peanut[2-3], however their contributions to yield were complex. MSH was also significant correlated with FBL and BN. MSH was positively correlated with FBL, and negative correlated with BN[4]. Chen et al (2017) displayed a contrasting result, positively correlating MSH with BN[2](p< 0.05).
Genetic linkage maps play a fundamental role in QTL identification by providing measurements of the relative effects of alleles in the mapped chromosomal regions. They also provide selectable DNA markers for breeders to manipulate traits through marker assisted selection (MAS)[5]. Several types of markers have been used in QTL mapping of peanut agronomic traits, many of which are detected for quality traits[6-7], resistance to biotic[8-15]and abiotic stresses[16-17]. Many traits have also been associated with yield, including main stem height, first branch length, total branch number, pod size and seed size[2,4,18-25]. Main stem height, first branch length, and branch number have highly significant correlations with yield. Some studies focus on these three traits in peanut using F2, F3, mini-core collection, and RIL mapping populations. Based on mini core collections, Jiang et al (2014) identified 8 SSR markers associated with MSH with the phenotypic variation explained (PVE) from 1.33% to 2.17%, two and five associated alleles for FBL in two environments respectively, with the PVE from 1.19% to 2.06%, and nine associated alleles for BN in three environments with the PVE from 1.59% to 4.81%[4]. Based on a chromosome segment substitution line (CSSL) population, Fonceka et al (2012) identified 15 QTLs for MSH located on A01, A02, A03, A05, A07, A08, B02, B03, B05, B06, B09, and B10 using significant associations between lines and traits[20]. Shirasawa et al (2012) used 94 F2lines in one year and detected QTLs affecting MSH, FBL and BN: three (qLMS06.2,qLMS04.2 andqLMS05.2), two (qLLB06.2 andqLLB01.2) and one (qNB06.2), respectively[23]. These traits were strongly correlated, so that QTLs for MSH, FBL were detected in the same marker interval in LG06.2. Huang et al (2015, 2016) and Yang (2015) detected 44 QTLs controlling MSH in different populations (one F2, two RILs) of Zhonghua10×ICG12625, which were located on A02, A03, A04, A06, A09, B02, B04, B06, and B07. 31 of these QTLs focused on A04, A09, B04 and B06[21, 24-25]. For MSH,qPHA4.2a,qPHA4.1c,qPHA4.3 andqMHA04.1 in F6/F7populations were all clustered on A04, with different additive effects[24-25]. QTLs for MSH in F2populations were not detected in RIL populations[21]. The F3and RIL populations of Fuchuan Dahuasheng×ICG6375, commonly found 15 QTLs for MSH located on A02, A06, A09, A10, B01, B06, nine of which located on A06 and B06. For BN, nine QTLs were identified in populations of Zhonghua10×ICG12625 and located on A01, A05, A08, B04, B05, six of which located in the B genome[2, 19]. Eleven QTLs were detected for BN in populations of Fuchuan Dahuasheng×ICG6375 located on A06, B01, B03, B06, B08, B09 and B10, seven of which were located on the B genome. These results showed that (1) MSH, FBL and BN are significantly correlated; (2) The genetic basis of MSH and BN are complicated and QTL have varied with differing cross combinations; (3) MSH, FBL and BN are sensitive to environments, and RIL populations worked well in detecting such QTLs; (4) A high-density linkage map is a powerful tool to unravel complex traits. In this study, the phenotypic data of MSH, BN, and FBL was collected across two environments for a RIL (F2:6-7) population from a cross between two peanut varieties, Huayu28 (maternal) and P76 (paternal). Using a high-density genetic linkage map for cultivated peanut, we detected QTLs controlling MSH, BN and FBL in whole genomes using a RIL population. We then analyzed the correlation between MSH, BN and FBL, thereby providing a foundation for fine mapping to breed favorable genes in peanut.
2 Materials and methods
2.1 Plant materials and phenotypic data
An F2:6-7population of 146 RILs was derived from a cross between 'Huayu28' and 'P76'. The 'Huayu28' variety matures early, has normal oleic acid content and small-seeds. 'P76' matures late, has high oleic content, and has a medium-seed. The complete RIL population together with parental lines was planted in an experimental field in Laixi Station of Shandong Peanut Research Institute, Qingdao, China from 2010 to 2011 using a randomized complete block design with two replications. Each plot contained one row, with 10 plants in each row, 10 cm between plants within each row, and 35 cm between the rows. Standard agricultural practices were used for field management. At least three plants were used from each line to investigate the main stem height (MSH), branch number (BN) and first branch length (FBL). MSH is defined as the distance from the base of main stem and first branch to the tip of the main stem. FBL is the distance from the base to the tip of the first branch, and BN is total number of branches more than 5 cm.
2.2 DNA extraction and marker analysis
Young healthy leaves from the two parents and 146 RILs (F2:11) were collected, frozen in liquid nitrogen, and transferred to a -70°C freezer. Total genomic DNA was extracted from each leaf sample by Plant Genomic DNA Kit (Tiangen Biotech (Beijing) Co., Ltd). The concentration and quality of DNA were examined using electrophoresis in 0.8% agarose gels with a standard lambda DNA and an ND-1000 spectrophotometer (NanoDrop, Wilmington, DE, USA). SLAF-seq was used to genotype the 146 RILs, and the two parents, as previously described[26]. SSR primers were selected from several previous articles. PCR reaction conditions were: 3 min denaturation at 94°C; 35 cycles of 1min at 94°C, 30 s at 55°C, and 90 s at 72°C; and then a final extension of 10 min at 72°C, and storage at 4°C. The PCR products were then separated on an 8% PAGE gel.
2.3 Linkage map construction and QTL identification
Since next-generation sequencing data includes many genotyping errors and deletions, reducing the quality of the high-density linkage maps, the High Map Strategy was used for ordering the SLAF and SSR markers, and to correct the genotyping errors in the linkage groups[27]. After genotyping 146 RILs, a 2-point linkage analysis was performed for efficient markers. All high-quality SLAF and SSR markers were allocated to 20 linkage groups (LGs) based on chromosomal locations. A detailed MST map algorithm ordered the SLAF and SSR markers[28], and the SMOOTH algorithm was used to correct the genotyping errors as per the marker ordering[29]. All LGs were processed as follows: primary markers were used to order the LGs by their chromosomal locations; according to the relationship between the ordered markers, genotyping errors or deletion were corrected using SMOOTH algorithm; the minimum spanning tree map was used to order the map; and the SMOOTH algorithm was used to correct the newly ordered genotypes. After four or more cycles of this processing, 20 high-quality maps were obtained. The Kosambi mapping function was used to estimate the map distances[30].
QTLs for MSH, FBL and BN traits were applied to this map. QTL mapping was performed by QTL IciMapping4.1 (downloaded from http://www.isbreeding.net) using the inclusive composite interval mapping of additive (ICIM-ADD) and two locus epistatic QTLs (ICIM-EPI) modules. Additive QTLs were detected using a 1.0 cM step in scanning. The probability used in stepwise regression was 0.001. Significant LOD thresholds were determined for each dataset with 1000 permutations. Type I error was 0.05 determined with the LOD threshold from permutation tests. Epistatic QTLs were detected using a step of 5 cM in scanning, a probability of 0.0001 in stepwise regression, and a LOD threshold of 5.0 to claim significant epistatic QTL. QTL names were designated as the following: qBNA06.1 is a QTL for BN on A06 and eqBNA01/B03 is an epistatic QTL for BN on A01 and B03.
3 Results
3.1 Phenotypic variation and correlation between MSH, FBL and BN
Phenotypic data for two seasons were generated for MSH, FBL and BN on all two parents and the complete set of the RIL population (Table1 and Fig.1). The MSH, FBL and BN of maternal parent, Huayu28, were 35.31cm, 38.00cm and 9.35 in 2010, 31.27cm, 33.00cm and 6.41 in 2011, respectively. MSH, FBL and BN of paternal parent, P76, were 49.29 cm, 52.68 cm and 26 in 2010, 47.35 cm, 58.00 cm and 12.00 in 2011, respectively. Phenotypic variation for MSH of RILs ranged from 21.23-62.57 cm and 21.00-72.00 cm during 2010 and 2011, respectively. Phenotypic variation for FBL of RILs ranged from 25.67-71.00cm and 25.00-73.00cm during 2010 and 2011, respectively. Phenotypic variation for BN of the RILs ranged 5.00-25.23 cm and 5.00-22.47 cm during 2010 and 2011, respectively (Table 1). A One-Sample Kolmogorov-Smirnov test showed that MSH and FBL in the RIL population were distributed normally in 2010 and 2011, and the distribution of BN was nearly normal (Table 1 and Fig.1). A pairwise correlation analysis showed that MSH was positively correlated with BN (r=0.354) and FBL (r=0.854) (Table 2).

Fig. 1 Phenotypic distribution of MSH, FBL and BN in the RIL population

Traits and YearHuayu28P76MinMaxMeanSDKolmogorov-Smirnov Z valueAsymp.Sig. (2-tailed) BN10LX9.3526.005.0025.2311.954.052.180.00BN11LX6.4112.005.0022.47 9.862.591.420.04FBL10LX38.0052.6825.6771.0043.897.961.020.25FBL11LX33.0058.0025.0073.0041.907.831.040.23MSH10LX35.3149.2921.2362.5739.097.380.880.41MSH11LX31.2747.3521.0072.0039.227.551.180.12

Table 2 Phenotypic pairwise correlation among BN, MSH and FBL of the RIL population
Note: Pearson test and two-tailed; ** denotes significance level at 0.01% and ns means no significance.
3.2 QTLs for peanut MSH, FBL and BN
In our previous work, a high-density genetic map was constructed, which contained 2334 markers (68 SSRs and 2266 SNPs) on 20 linkage groups (LGs), and spanned 2586.37 cM. The average distance between adjacent markers was 2.25 cM. Genome-wide QTL analysis was performed using such genetic map and the phenotypic data of MSH, FBL and BN obtained from the RILs in 2010 and 2011 in Laixi. QTL mapping identified 18 putative QTLs with 4, 5 and 9 additive QTLs for MSH, FBL and BN, respectively (Table 3). Among them, 7 QTLs were in the A genome, and 11 QTLs were in the B genome.
For MSH, four additive QTLs were detected on three chromosomes, with all positive alleles on chromosomes A01, A10 and B03 contributed by 'P76' (Table 3). Three additive QTLs namelyqMSHA01.1,qMSHA10.1 andqMSHB03.1 were identified in the environment of 2011, which explained 4.27%-19.47% of the phenotypic variation. In the environment of 2010, two additive QTLs,qMSHA01.1 andqMSHB03.2 were identified with 11.69% and 6.56% of PVE. In the interval Marker4138449-Marker4133871,qMSHA01.1 had the largest effect on MSH, being detected in two environments and accounting for 11.69% and 19.47% of the phenotypic variation.
For FBL, five QTLs were detected on chromosomes A01, A10, and B03.qFBLA01.1 peaked in marker interval Marker4281112-Marker4289358, with the 'Huayu28' allele providing increased first branch length, accounting for 13.46% of the phenotypic variance.qFBLA01.2 was positioned between markers Marker4138449 and Marker4133871, with the positive allele from 'P76', and identified in two environments.qFBLA01.2 accounted for 11.35% and 21.48% of the phenotypic variance. Three additional QTLs were identified for FBL, with two positive alleles on chromosome B03 and one on A10 contributed by 'P76', accounting for 4.24% to 6.11% of the phenotypic variation.
Nine additive QTLs for BN were detected on chromosomes A06, A08, B03, B04, B05, B06, B07 and B08, and explained 4.65% to 14.67% of the phenotypic variation. 'P76' contributed the positive alleles atqBNA08.1,qBNB03.1,qBNB05.1,qBNB07.1,qBNB07.2 andqBNB08.1, with four of these QTLs explaining more than 10% of the phenotypic variation. 'Huayu28' contributed the positive alleles atqBNA06.1,qBNB04.1 andqBNB06.1.qBNA08.1 in interval Marker 1206009-Marker1147080 andqBNB03.1 in interval Marker4579104-Marker4701122 accounted for 11.61% and 11.38% of the phenotypic variation, respectively. There, two QTLs were detected on chromosomes B07, which wereqBNB07.1 in interval GM1899-Marker 3418462, andqBNB07.2 in interval Marker3418462-Marker3357242.qBNB07.1 was significant in 2010LX, and explained 14.67% of the phenotypic variation.qBNB07.2 was significant in 2011LX, and explained 13.13% of the phenotypic variation.qBNB07.1 andqBNB07.2 were linked with Marker3418462, and had the largest effect on BN.
With an additive QTL analysis bothqFBLA01.2 for FBL andqMSHA01.1 for MSH were in interval Marker4138449-Marker4133871, both ofqFBLB03.1 for FBL andqMSHB03.1 for MSH were in interval Marker4642762-Marker4762074. This indicates that the same additive QTL may control MSH and FBL.
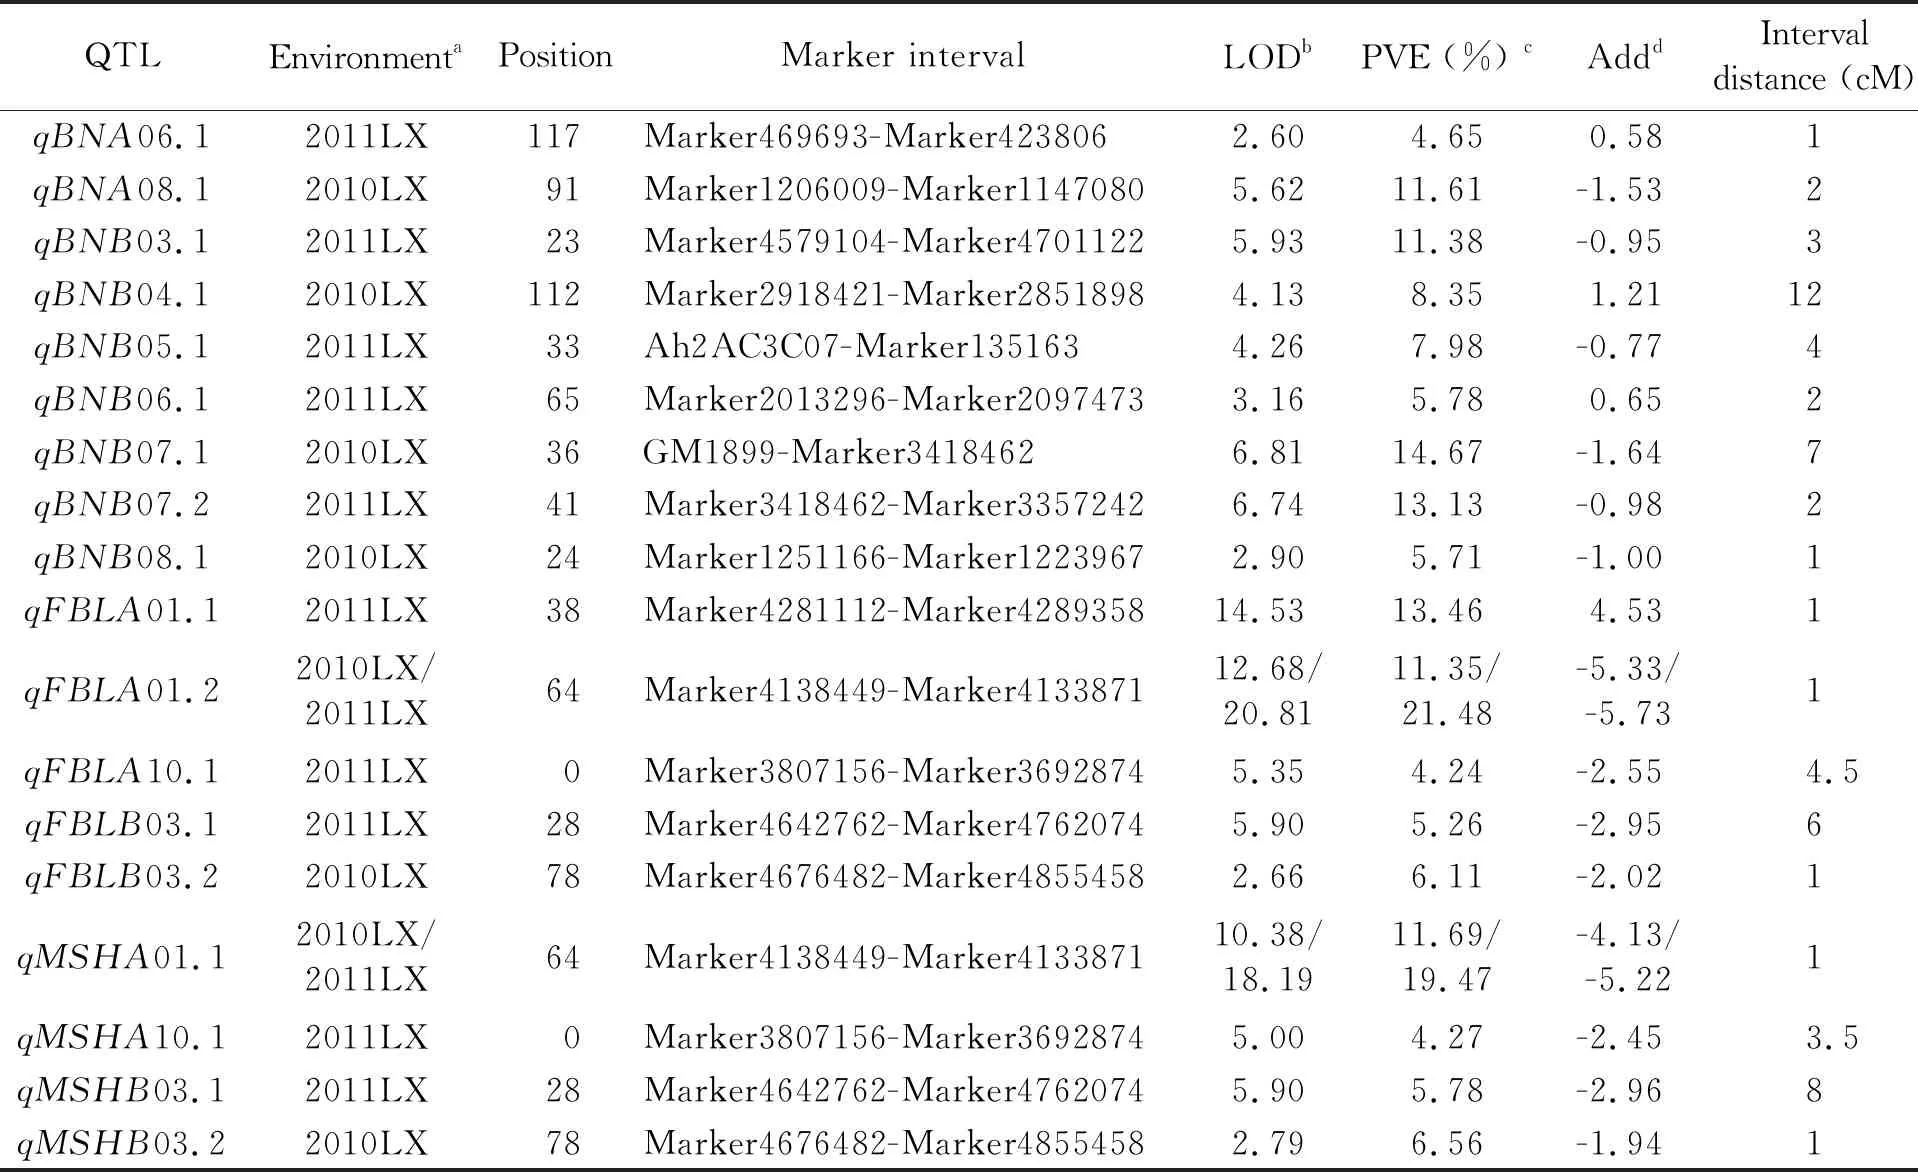
Table 3 QTLs detected for branch number, first branch length and main stem height in two environments from 2010-2011
Note: a. Environments 2010LX and 2011LX, phenotype data from Laixi, Shandong during 2010 and 2011; b. Peak LOD value; c. Percentage of phenotypic variance explained by the QTL; d. A positive additive effect indicates that the 'Huayu28' allele increased the phenotypic value, a negative value indicates that the 'P76' allele decreased the phenotypic value.
3.3 Epistatic QTLs for MSH, FBL and BN
Using inclusive composite interval mapping, we identified digenic epistatic QTLs in peanut. Seven, fifteen and two pairs of epistatic QTLs were identified for MSH, FBL, and BN, respectively, the LOD of which were higher than 5 (Table 4). MSH epistatic QTLs were identified on A01/B06, 01/B07, A02/B04, A02/B07, A04/A06, A05/B04 and A08/B07, and which explained 4.81% to 6.00% of the phenotypic variance. Fifteen pairs of epistatic QTLs for FBL accounted for 4.84% to 8.27% of the phenotypic variance. Two pairs of epistatic QTLs on chromosomes A01/B03 and B03/B09 showed significant effects on BN.eqBNA01/B03 explained 5.02% of the phenotypic variance, andeqBNB03/B09 accounted for 4.48% of the phenotypic variance. Epistatic QTL analysis indicated that four epistatic QTLs may control both MSH and FBL:eqMSHA01/B06 andeqFBLA01/B06,eqMSHA02/B04 andeqFBLA02/B04,eqMSHA05/B04 andeqFBLA05/B04,eqMSHA08/B07 andeqFBLA08/B07 (Fig.2).
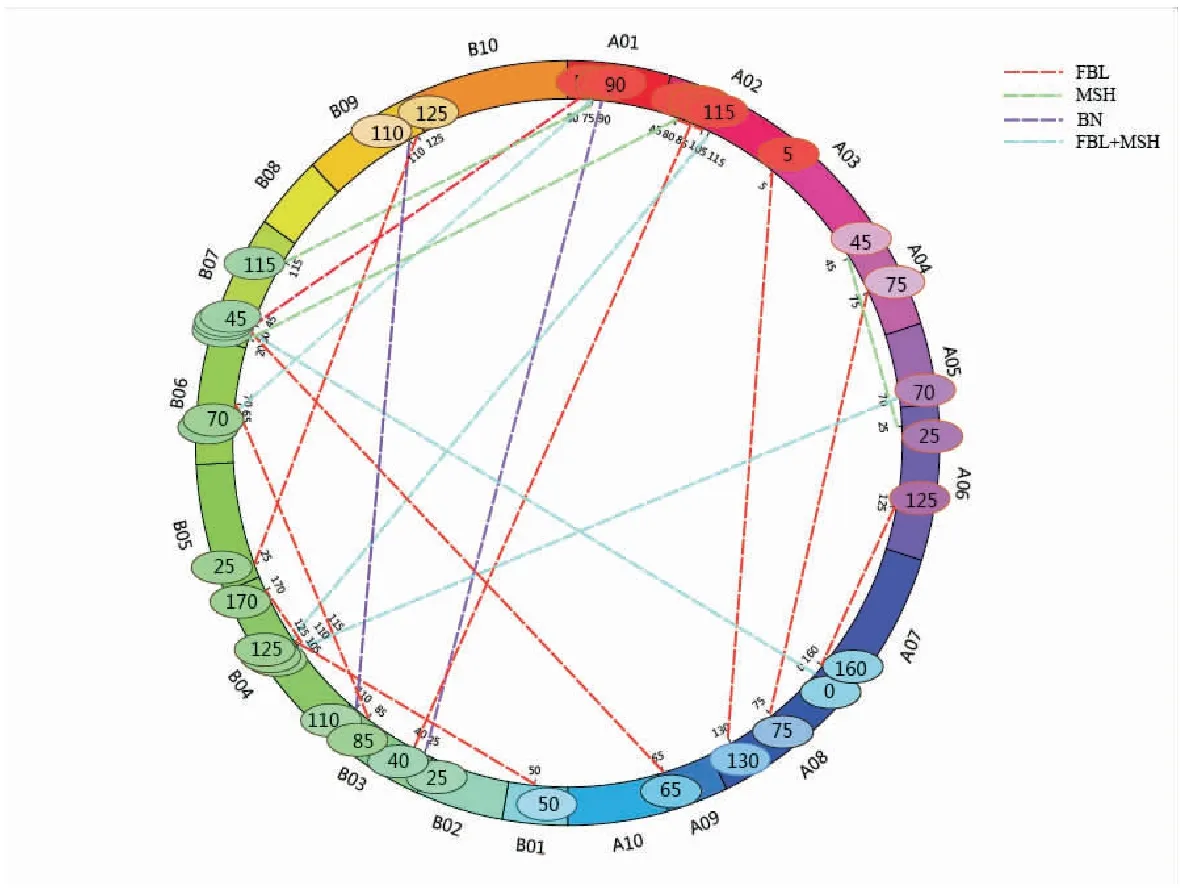
Fig. 2 Epistatic QTLs for main stem height, first branch length and branch number
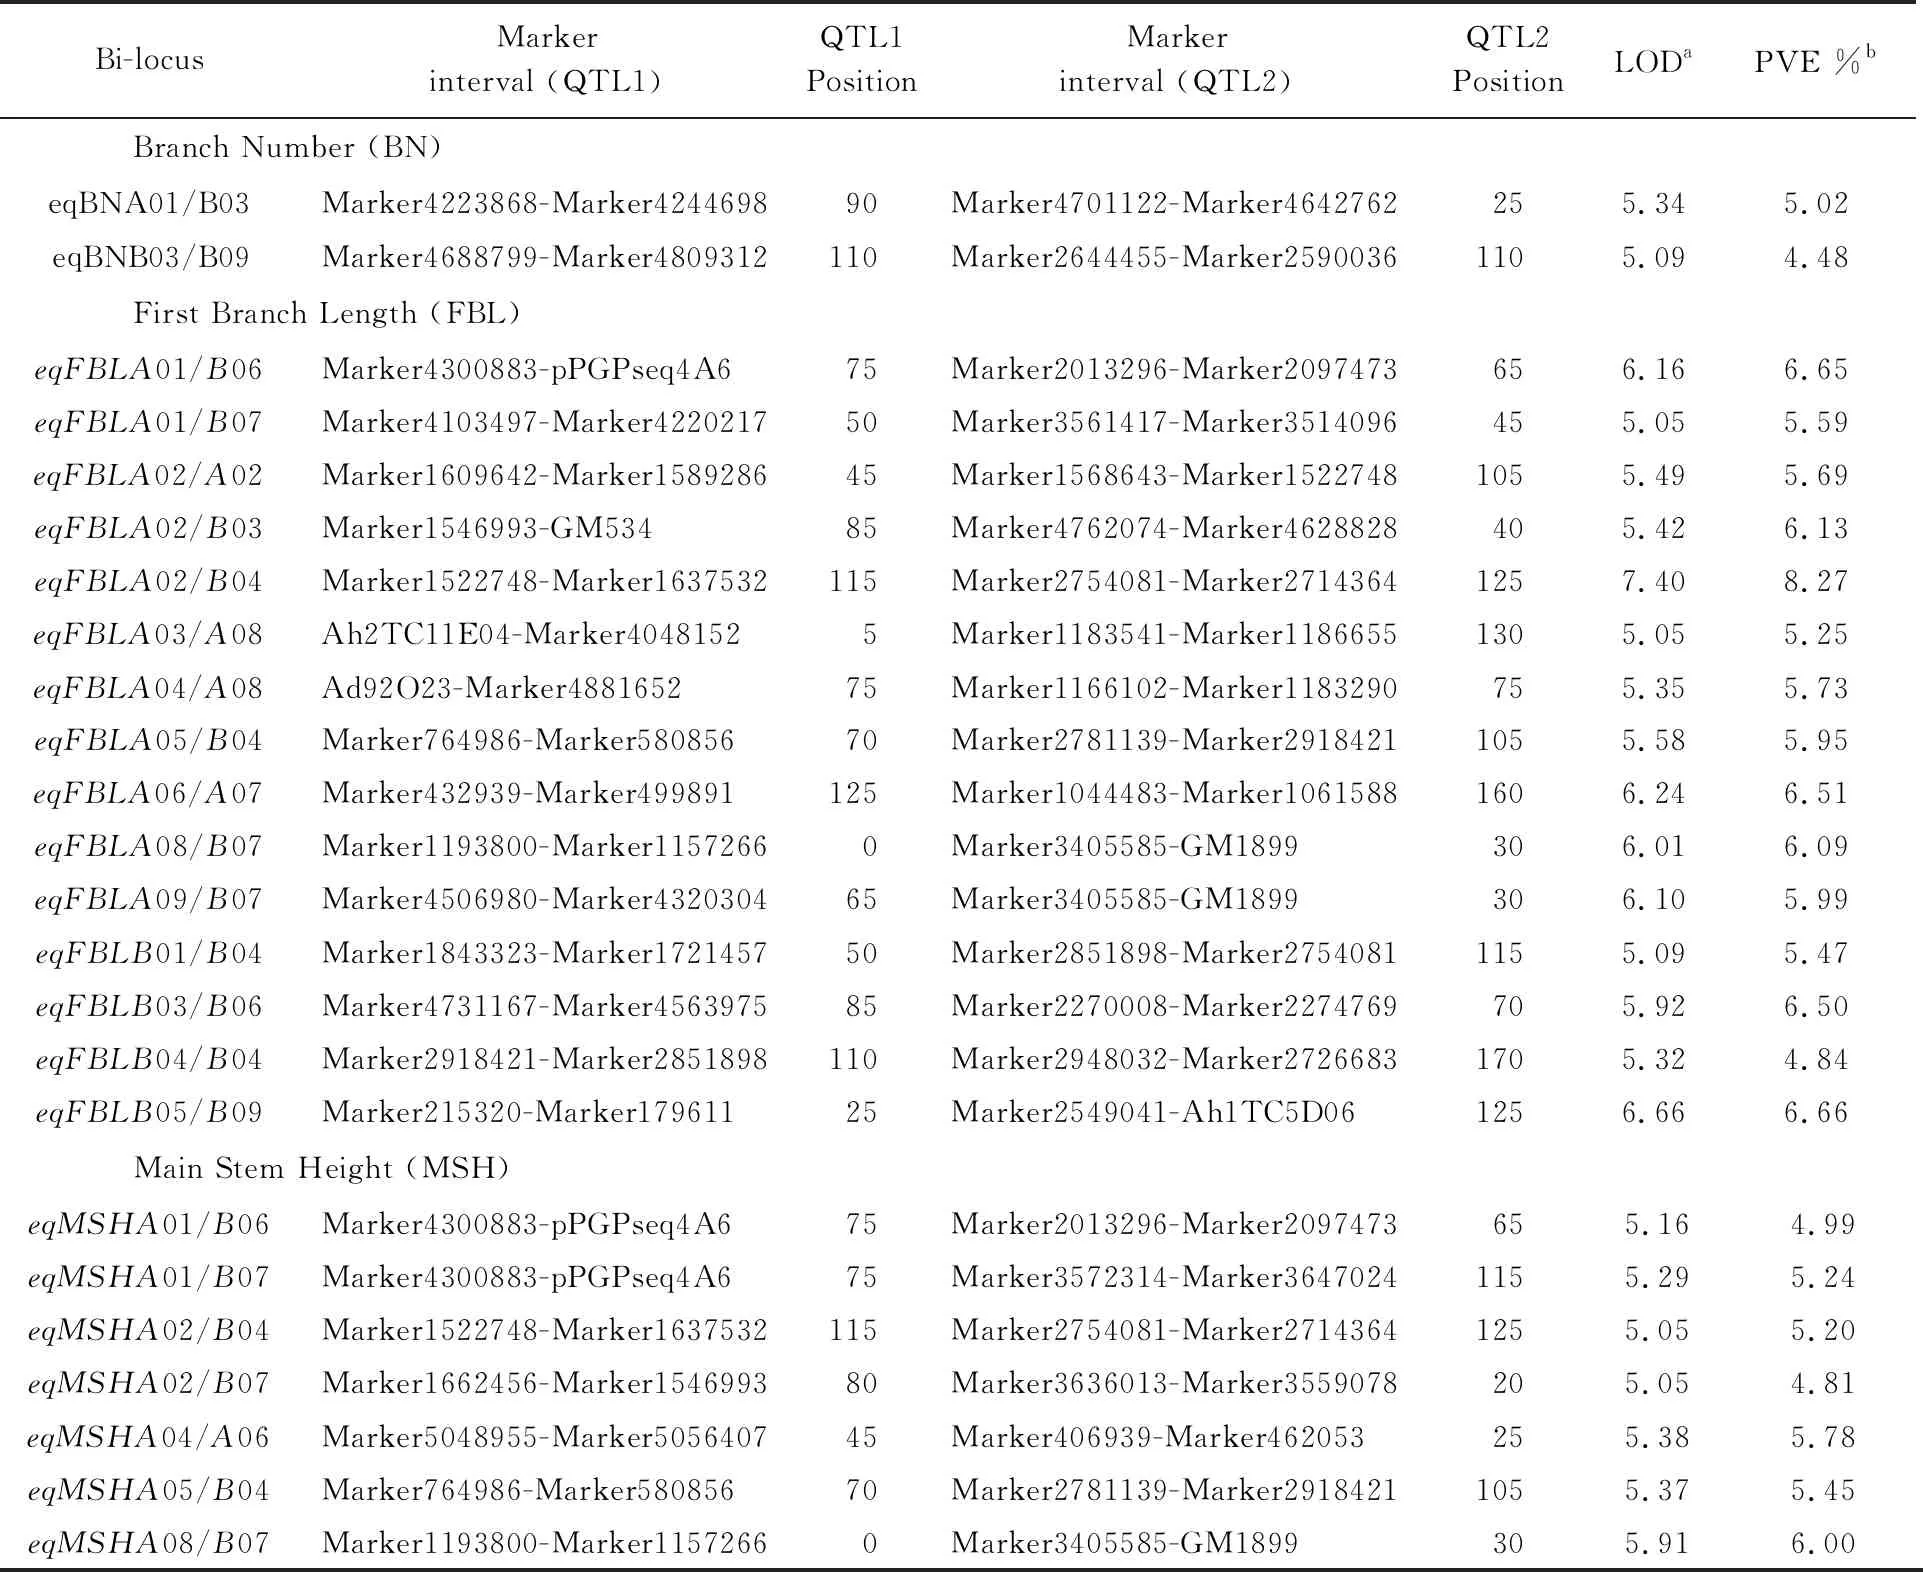
Table 4 Epistatic QTLs for branch number, first branch length, and main stem height
Note: a, LOD score for epistatic QTL; b, Phenotypic variation explained by epistatic QTL effects.
4 Discussion
4.1 QTLs for plant architecture traits
We identified 18 additive QTLs for MSH, FBL and BN. These QTLs were distributed across 10 chromosomes: A01, A06, A08, A10, B03, B04, B05, B06, B07, B08. QTLs for MSH were located on A01, A10, and B03, however, previous QTLs for MSH were located on A02, A03, A04, A06, A09, A10, B01, B02, B03, B04, B06, B07, B08, B09 and B10 groups[2, 19-25]. QTLs for the FBL were located on A01, A10, and B03, and the previous QTLs for the FBL were located on A01, A03, A05, A06, A08, A10, B04, B05, B06, B10, and B11 groups[20]. QTLs for BN were located on A06, A08, B03, B04, B05, B06, B07, and B08, while the previous QTLs for BN were located on A01, A05, A06, A08, B01, B03, B04, B05, B06, B08, B09, and B10 groups[2, 19, 21, 24-25].
QTLs for MSH were detected in different parent combinations showing that the genetic basis of MSH was dependent on peanut genotypes. Based on a RIL population from Fuchuan Dahuasheng×ICG6375, QTLs,qHMSA6.1a,qHMSA6.1b,qHMSB6.1a, andqHMSB6.1bwere detected across three environments and located on A06 and B06[2]. Based on an F3population from Fuchuan Dahuasheng×ICG6375, QTLs,qMHA061.1 (qMHA062.1),qMHA061.2 (qMHA062.2) andqMHA092.2 (qMHA091.1), were detected across two environments and located on A06 and A09[19]. Based on populations from Zhonghua10×ICG12625, two major effect consensus QTLs namelycqPHA4aandcqPHA4bwere identified with stable performance across three environments in the RIL[25]; 3 QTLs,qHMSA3,qHMSB4 andqHMSB7, were detected on A03, B04 and B07 in an F2:3population; 3 repeated QTLs for main stem height,qMHA04.1,qMHB04.1 andqMHB04.2, were identified on A04, B04 using the RILs[21, 24]. In this study, one QTL for the height of the main stem was detected across two environments on A01. Consistent with other crop species, main stem height is controlled by multiple QTLs[31-32].
4.2 Co-localization of QTL
It is well known that correlated traits are likely to map to similar locations[33]. Identifying co-localizations of QTLs controlling different traits will lead to markers for more effective marker assisted selection of correlated traits. Co-localizations of QTLs for plant architecture traits were reported in earlier research[2,19-25]. Shirasawa et al (2012) identified QTLs for main stem and longest branch length, in the same marker interval on LG06.2[23]. Jiang et al (2014) identified QTLs for main stem length and longest branch length near the same marker 17E1-420, 17E1-440, 19A5-500[4]. In this study, QTLs for MSH and FBL were both located in Marker 4138449-Marker4133871 on A01 with the favorable allele from 'P76'. These traits were significant correlated with one another, and therefore we suggest that the identified QTLs control plant biomass.
5 Conclusion
In the current study, we detected QTLs for peanut main stem height (MSH), first branch length (FBL) and branch number (BN) with a high-density genetic linkage map. 18 additive QTLs (four for MSH, five for FBL, nine for BN) were mapped on 10 chromosomes. Most QTLs were identified only one environment.qMSHA01.1 for MSH,qFBLA01.2 for FBL were identified in two environments and found in the same interval Marker 4138449-Marker4133871. These results provide a foundation for fine mapping, cloning, and the design of molecular breeding for genes in peanut.