参杂缺陷石墨烯的高分子复合材料导热特性分子动力学模拟
2019-10-14 07:56熊扬恒吴昊高建树陈文张景超岳亚楠
物理化学学报 2019年10期
熊扬恒,吴昊,高建树,陈文,张景超,岳亚楠,*
1武汉大学动力与机械学院,水力机械过渡过程教育部重点实验室,武汉 4300722 Holland Computing Center, 内布拉斯加大学林肯分校,美国 林肯 68588
1 Introduction
In the past decade, lots of attentions have been given to the advanced polymer-based materials in applications such as fuel cells, wearable devices, and 3D printing1-3. However, the thermal conductivity of polymers is generally in the order of 0.1 to 1 W·m-1·K-1due to the amorphous arrangement of the molecular chains4-6. By changing the intrinsic structures of polymers through stretching, grafting and aligning etc.,numerous polymers with enhanced thermal conductivities have been reported7-10. Different from direct modifications of intrinsic structures, various thermally conductive fillers,including carbon fibers, carbon nanotubes (CNTs), graphene,ceramic and metal, have been introduced to enhance the thermal properties of polymers11-13. For example, Xu et al. investigated the thermal properties of composites with different single-walled carbon nanotube (SWNT) volume fractions. The highest thermal conductivity was increased by 130% at 49% (volume fraction)SWNT11.
Recently, graphene-based composite materials have garnered enormous attentions due to the superior thermal conductivity of graphene14-17. Adding graphene/graphite into pure polymer is expected to improve the thermal transport in the polymer composite18-20. Moreover, graphene and graphite are more costeffective in practical fabrications compared to CNTs. Shahil et al. synthesized multilayer graphene-based composites as highly efficient thermal interface material which could enhance the heat transfer between two solid surfaces. An enhanced thermal conductivity of 5 W·m-1·K-1was achieved for the graphenebased polymer at a filler loading fraction of 10% (volume fraction)21. Kim et al. developed a fabrication method to allow nanofillers with different shapes and sizes to evenly disperse in polymers. The thermal conductivity of graphene-resin composite was experimentally measured as 0.87 W·m-1·K-1at a mass fraction of 20%22. Shtein et al. reported a polymer matrix(epoxy) with an ultra-high thermal conductivity of 12.4 W·m-1·K-1at a filling fraction of 24% (volume fraction)graphene nanoplatelets. The remarkable improvement of thermal conductivity is mainly due to the closure of gaps between adjacent graphene nanoplatelets of large lateral dimensions and the low defect density23. Discrepancies among the experimental values are associated with different graphene morphology, volume fraction,polymeric material and measurement method24-26.
The perfect planar structure leads to the superior thermal conductivity in graphene. However, structural defects, such as single point vacancy, Stone-Wales defect, grain boundary,isotope doping and functionalization, are inevitable during the process of graphene fabrication and sample preparation27-29.Prior works have investigated the effect of the defect on thermal transport in graphene30-32. It is known that the introduced defects will suppress the thermal transport in graphene33-35. For example, a 7.5% of vacancy defects in graphene can reduce its thermal conductivity by nearly 300 times compared to that of pristine graphene34. Such a drastic reduction is attributed to the reduction of the mean free path and relaxation time of phonons within the defected graphene. The inner vacancy defect causes a stronger influence on the thermal conductance of graphene comparing to the edge vacancy defect effect36. However, the heat-transfer mechanism in graphene-based nanocomposites is unclear and remains an open topic.
In this work, the interfacial thermal conductance and the overall thermal conductance of graphene-polyethylene composites is comprehensively studied using MD simulation.Based on the NEMD method, the effect of vacancy defect with different densities is explored. The interfacial thermal conductance between the sandwiched graphene layer and the polymeric material and the overall thermal conductance in the nanocomposite are investigated respectively. Moreover,frequency domain analysis is carried out to explain the mechanism of interfacial energy transport. The structure concentration effect of polymeric materials is observed when a graphene layer is embedded in the nanocomposites. Our simulation utilizes an effective approach for thermal analysis in small-scale nanocomposites, and the calculated results provide valuable guidance for using defective graphene as fillers to tune the thermal conduction in polymeric composites.
2 Methods and simulations
The polymeric material used in this work is polyethylene(C20H42). As shown in Fig. 1a, the graphene-polyethylene composite consists of two amorphous polyethylene blocks and a sandwiched graphene layer. The structure is designed with an overall length of 12 nm and a cross-sectional area of 2 nm × 2 nm. All simulations are carried out using the LAMMPS package with a time step of 0.25 fs37.
The adaptive intermolecular reactive empirical bond order(AIREBO) potential38, which has been widely used in simulations of carbon systems39, is used to model the graphene layer. The condensed-phase optimized molecular potential for atomistic simulation studies (COMPASS) is used to model the polymer molecules40. The COMPASS potential has been employed to study the thermal energy transport in polymeric materials, and the calculated thermal conductivities are found to match well with the experimental results41. The interactions between the graphene and polyethylene (van der Waals interactions) are modeled by Lenard-Jones (LJ) potential, which is described as
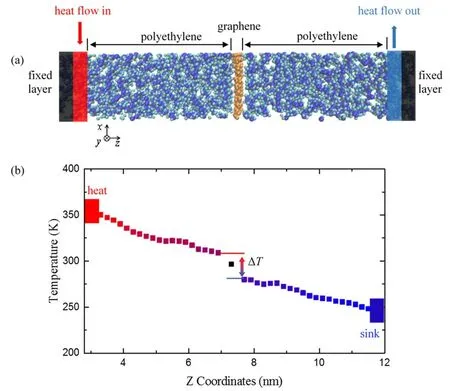
Fig. 1 (a) Graphene-polyethylene composite in NEMD simulation.(b) The steady-state temperature profile along the heat flux direction.Graphene is set as the embedded layer in the middle of polyethylene. Heat flow runs across the composite with the fixed layer setting at the end of the system. The ΔT represents the temperature drop at the interface between graphene and polyethylene.

where ε0is the energy parameter, r is the interatomic distance and σ0is the van der Waals diameter. The LJ parameters used in this work are shown in Table 1. It has been proved that the specific parameters in Table 1 are applicable in describing the mechanical properties of graphene and polyethylene model42.
The NEMD method is employed to calculate the thermal transport in graphene-polyethylene composites43. Periodic boundary conditions are applied in x and y directions. After energy minimization, the simulation domain in the z-direction is extended 2 nm larger than the original dimension to avoid the possible interaction between the two ends. The system is initially equilibrated at temperature 300 K for 500 ps in thermal-isobaric ensemble (NPT). A micro-canonical ensemble (NVE) is followed for another 250 ps. Atoms (1 nm) at both ends of the sample are fixed to stabilize the free edge. Two adjacent layers of 0.8 nm are grouped as heat source and sink in Fig. 1a,respectively. A constant heat flux rate q˙ is applied to the system for 1500 ps in NVE ensemble to ensure the temperature gradient reaches steady state. The steady-state temperature profile is presented in Fig. 1b. There is a temperature jump ΔT at the interface between graphene and polyethylene. Then the interfacial thermal conductance can be calculated as G = q˙/ΔT,where ΔT is obtained by averaging the data over a period of 500 ps in steady state.
3 Results and discussion
3.1 Effect of defect on interfacial thermal transport
Prior works have investigated the effect of defect on thermal transport in graphene30. Aside from in-plane thermal transport,vacancy defect affects the interfacial thermal conductance of graphene embedded in polymeric materials as well. In our simulation, we explored the effect of defects on interfacial thermal transport by removing various numbers of carbon atoms(4 to 32) from the center of single-layer graphene. With 160 atoms in the graphene sheet, the density of defects ranges from 0 to 20%.
In our thermal transport model, heat flows across the embedded graphene layer and develops a steady-state temperature gradient (shown in Fig. 1b). The interfacial thermal conductance is determined to be (75.6 ± 1.9) MW·m-2·K-1,which is very close to the reported value for single layer graphene embedded in polymeric materials44-46. As shown in Fig. 2, the thermal conductance of the graphene layer has apositive correlation with the density of vacancy defects. With increasing defect concentrations from 0% to 20%, the thermal conductance increases from 75.6 MW·m-2·K-1to 85.9 MW·m-2·K-1. Previous MD simulation showed that a 4.17%defect in graphene has a negligible effect on the grapheneparaffin interfacial thermal transport42. Compared to the reference data, the thermal conductance increases marginally(~14%) with higher defect concentrations in our simulation results.
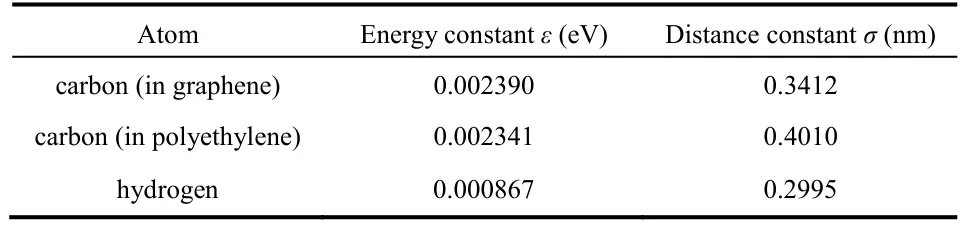
Table 1 Lenard-Jones parameters of different atom types.
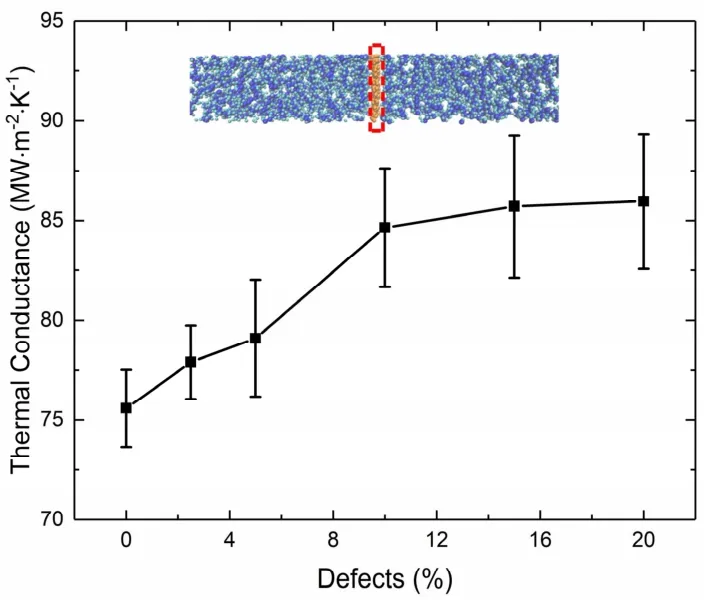
Fig. 2 Interfacial thermal conductance as a function of vacancy defects. Insert schematics show the interfacial area.
To understand the evolution of interfacial thermal conductance, the vibrational density of states (VDOS) is employed to characterize the energy of atomic vibrations. It is calculated by taking the fast Fourier transform (FFT) of the velocity autocorrelation function of atoms. The VDOS in frequency domain is given by

where ω is frequency, v(0) and v(t) are atomic velocities at the initial time and at time t, respectively. Fig. 3 shows the VDOS spectra of polyethylene and graphene. The poor spectra overlap between graphene and polyethylene leads to an ineffective interfacial thermal conductance. It is noted that the out-of-plane VDOS at low-frequencies (less than 15 THz) make the most contributions to the overlap between the pristine graphene and the polyethylene, which is in agreement with prior studies47. The VDOS spectra of graphene under three defects concentrations(0%, 10%, 20%) are shown in Fig. 3a. With more defects on the graphene layer, the low-frequency vibration modes of graphene are increased, promoting the interfacial thermal coupling between graphene and surrounding polyethylene. This evolution of low-frequency vibration modes is caused by the loss of sp2bonds in graphene48. The number of covalent bonds is reduced in graphene when vacancy defects are introduced. Therefore, the embedded graphene layer in the composite becomes less rigid structurally which leads to an increase of low-frequency vibration modes. Consequently, the interfacial thermal transport is enhanced due to the existing of vacancy defects in graphene.
3.2 Effect of defect on overall thermal conductance
By utilized the same simulation model in Fig. 1a, the effect of vacancy defect on the thermal performance of nanocomposites is investigated. To quantitatively evaluate the effect of vacancy defect on the overall thermal conductance of graphenepolyethylene composites, an area of 2 nm × 2 nm × 2.8 nm is selected, which contains graphene atoms and a consistent volume of polyethylene as shown in Fig. 4a.
To remain consistent with previous calculations, the same heat flux is imposed on the nanocomposites. The corresponding temperature drop ΔT’ is shown in Fig. 4b. The overall thermal conductance can be also calculated as G = q/ΔT’.
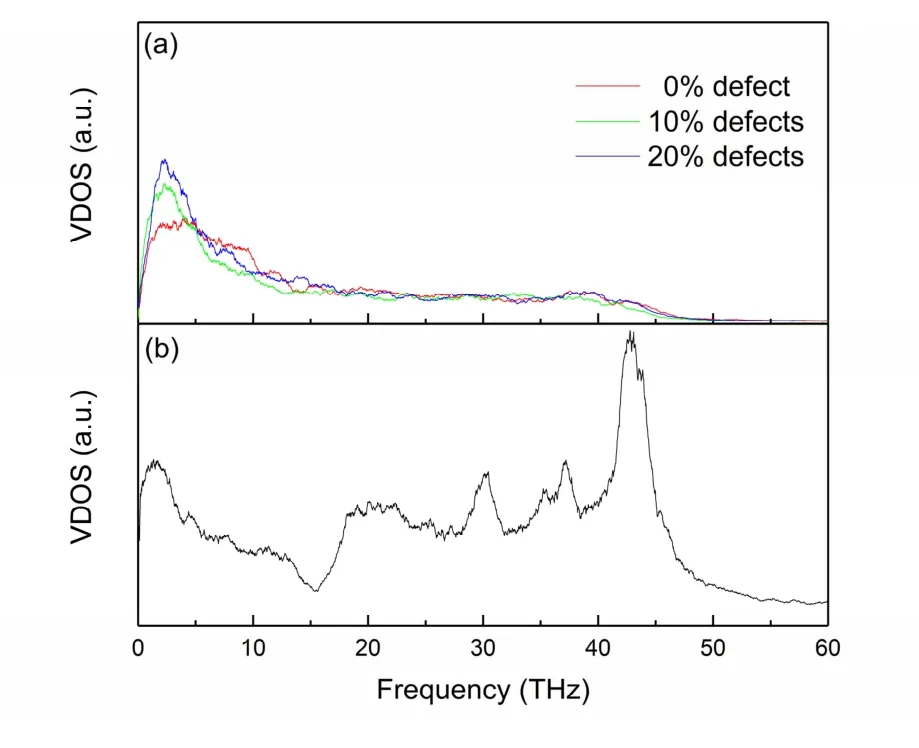
Fig. 3 (a) Out-of-plane VDOS spectra at three defect concentrations(0%, 10% and 20%). (b) VDOS spectra of polyethylene.The VDOS spectra are the averaged results for corresponding graphene and polyethylene atoms.
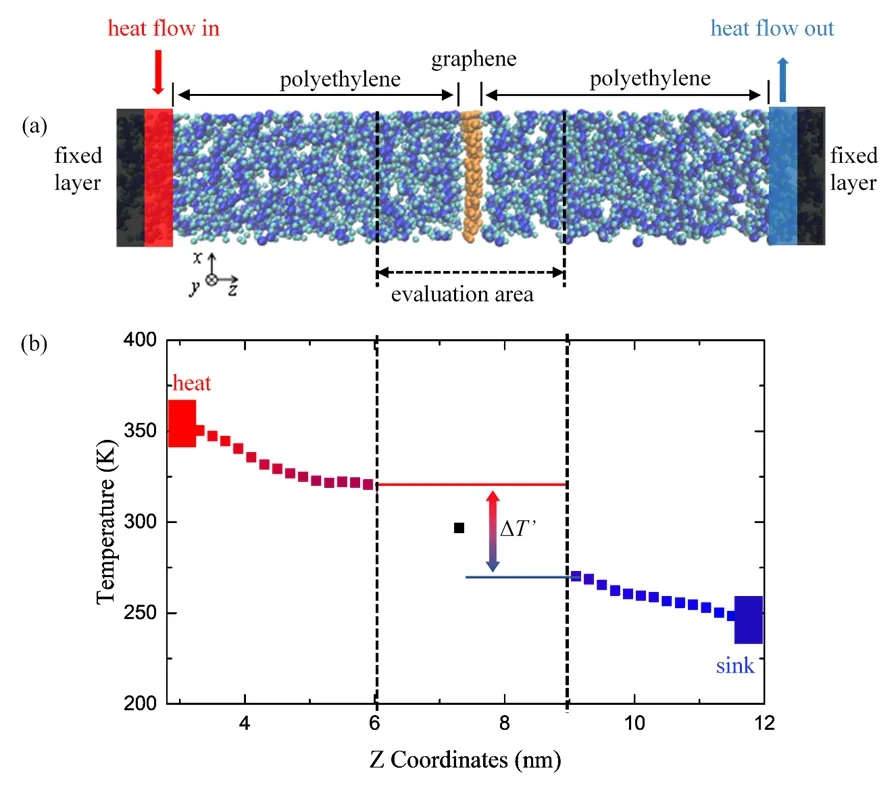
Fig. 4 (a) Schematic of the simulation model for overallthermal conductance evaluation. (b) The steady-state temperature profile of the composite along the heat flow direction.
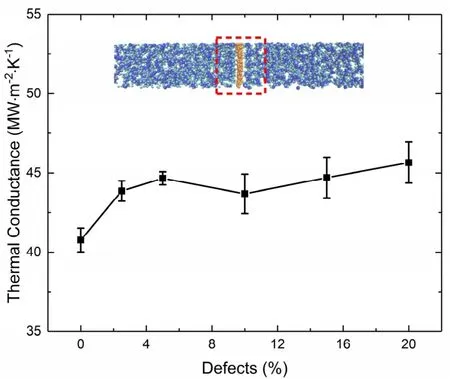
Fig. 5 Overall thermal conductance of the evaluation area as a function of vacancy defects. Insert figure shows the evaluation area.
As shown in Fig. 5, as the density increases from 0% to 20%,the thermal conductance increases from 40.8 MW·m-2·K-1to 45.6 MW·m-2·K-1. The vacancy defect has a relatively smaller effect on the overall thermal conductance when compared to the effect on the interfacial thermal conductance. In consideration of our small evaluation area, the increase of interfacial thermal conductance induced by vacancy defect has a significant effect on the overall thermal conductance. Moreover, as the size of graphene increases, the interfacial thermal transport has less influences on the overall thermal conductance of nanocomposites48.
More than the effect of interfacial thermal transport, the distribution of the molecular chains could also affect the overall thermal conductance in the nanocomposite. Fig. 6 shows the relative concentration of nanocomposite and polyethylene along the heat flow direction. The horizontal axis is the distance from the central graphene layer. The peak density at 0 nm is the relative concentration of carbon atoms in graphene. The black line represents the relative concentration of pure polyethylene model. It is indicated that the polyethylene molecules are uniformly distributed with no stratification or concentration.However, when a graphene layer is sandwiched within the polyethylene, the density distribution of the molecular chains exhibits sinusoidal fluctuations. The distance between graphene and the adjacent polyethylene is about 0.17 nm which is half the thickness of graphene49.
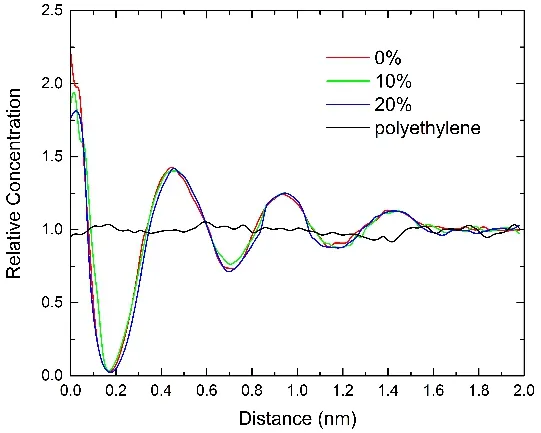
Fig. 6 Relative concentration of nanocomposite and polyethylene along the heat flow direction.
It is observed that the density of polyethylene increases near the interface and falls back to the normal level with growing distance from the graphene layer. The concentrated layers of polyethylene have aligned molecular arrangement50, which results in a better thermal conductivity in polymeric materials10.Two main concentrated layers of polyethylene are at distances of 0.45 and 0.95 nm with relative peak concentration of 50% and 25%, respectively. The fading peak concentration and widening peak width in Fig. 6 indicate a decreasing interaction between graphene and polyethylene. It is found that thermal transport across graphene-polymer interface can be enhanced by increasing the polymer density. Luo et al.45explained this density effect using VDOS analyses: the shorter interatomic distances lead to stronger van der Waals forces and greater overlaps between the spectra of polymer and graphene which results in better interfacial thermal coupling. Besides, the higher local density of polymer near the interface provides more atoms for interacting with graphene, which directly facilitates the interfacial thermal conductance.
4 Conclusions
To sum up, the interfacial thermal conductance and the overall thermal conductance of the graphene-polyethylene composites are comprehensively investigated using NEMD method. With increasing density of vacancy defect from 0% to 20% in graphene, the interfacial thermal conductance increases from 75.6 MW·m-2·K-1to 85.9 MW·m-2·K-1. The calculated interfacial thermal conductance increases with defect concentrations due to the increased populations of low frequency phonons, which results in better VDOS overlaps between graphene and polyethylene. Meanwhile it is found that vacancy defects have relatively smaller effect on the overall thermal conductance (from 40.8 MW·m-2·K-1to 45.6 MW·m-2·K-1). It is reported that the local structure with higher density of polyethylene near the interface provides more atoms for interacting with graphene. Our results indicate that the thermal performance of polymeric composites can be effectively tuned via surface engineering of graphene and provide guidance for future development of graphene-based composites for practical thermal applications.
猜你喜欢
初中生世界·八年级(2021年10期)2021-12-28
湘潮(上半月)(2021年10期)2021-12-02
支部建设(2019年36期)2019-11-19
华人时刊(2019年21期)2019-05-21
艺术评论(2019年9期)2019-01-26
写作(2018年4期)2018-11-28
东坡赤壁诗词(2018年1期)2018-03-31
校园英语·下旬(2017年13期)2017-12-27
文史春秋(2017年10期)2017-11-29
雕塑(1997年1期)1997-06-26