
Evaluation of Uncertainty in Determination of Sucralose Content in Edible Betel Nut by High Performance Liquid Chromatography
2019-09-25 07:10:54ChenXuemeiFengYanyongXiaoWeiYangYujuanKuangFengjunKuangFengjiaoGuoWangqingZhangWeiXuKai
中阿科技论坛(中英文) 2019年3期
Chen Xuemei,Feng Yanyong,Xiao Wei,Yang Yujuan,Kuang Fengjun,Kuang Fengjiao,Guo Wangqing,Zhang Wei,Xu Kai
(1.Hunan Kouweiwang Group Co.,LTD,Yiyang,Hunan 413001;2.Hunan Zhongyi Food Chemical Testing Institute,Yiyang,Hunan 413001)
Abstract:The assessment of uncertainty is part of ensuring the accuracy of measurement results.In accordance with the'Food Safety National Standard Food Determination of Sucralose(Sucralidin)in Food'(GB 22255-2014)[1]method,this paper carries out the content of sucralose in edible betel nut measurements and establishes mathematical models by using the differential detector in high performance liquid chromatography,and analyzes various factors affecting the detection results of sucralose in edible betel nut,and the uncertainty factors affecting the determination results were systematically expressed and evaluated.The analysis results show that under the 95%confidence interval,when the content of sucralose in the betel nut sample to be tested is 0.81g/kg,the expansion uncertainty is 0.041472g/kg,the coverage factor k=2.
Keywords:high performance liquid chromatography;areca nut;sucralose;uncertainty
Sucralose is a sweetener approved by China for use in various foods.Its sweetness is pure,the sweetness is about 600 times sweeter than that of sucrose.It is also widely used in edible betel nut.According to the“National Food Safety Standard Standards for the Use of Food Additives”(GB 2760-2014),the maximum use of candied fruit(food additives for edible betel nut is based on candied fruit)is 1.5g/kg[2].This paper establishes a model based on'Measurement and Expression of Measurement Uncertainty'(JJF1059.1-2012)[3]and'Guidelines for the Evaluation of Uncertainty in Chemical Analysis'(CNAS-GL006:2019)[4],systematically analyzes the sources of uncertainty,and improve the accuracy of the test results by evaluating the uncertainty affecting the test results of the samples.
I.The Experimental Part
(i) Experimental Principle
According to GB 22255-2014,the sucralose in the sample is extracted by methanol aqueous solution,and the protein and fat are removed,after being purified by solid phase extraction column,the separation was carried out by reversed-phase chromatography using liquid chromatography.According to the retention time,the peak area is used for quantitative.
(ii) Equipment
Shimadzu high-performance liquid chromatography Shimadzu RID-10A,quantitative reproducibility 0.7%;METTLER one in hundred thousand electronic analytical balance XS105,fine range 0~41g,minimum division value 0.00001g,0~50g indication error is±0.00001g;the A-stage pipette is 5mL,the tolerance is±0.025mL;the A-stage pipette is 50mL,the tolerance is±0.05mL;the A-stage volumetric flask is 10mL,the tolerance is±0.020mL;grade A volumetric flask 100mL,tolerance is±0.10mL;KQ-2250B ultrasonic cleaner,vortex mixer,centrifuge;solid phase extraction column(200mg,the type is N-vinyl pyrrolidone and divinyl benzene hydrophilic and lipophilic equilibrium fillers)was activated sequentially with 4 mL of methanol and 4 mL of water before use.
(iii) Standard Reagents
Sucralose standard(C12H19C13O8):CAS number 56038-13-2,purity≥99%,source:Dr.Ehrenstorfer.
(iv) Measuring Step
1.Preparation of Standard Solution
a. Sucralose stock solution (1.00mg/mL):Weigh 0.10g(accurate to 0.0001g)of sucralose standard in a 100mL volumetric flask,dilute to the mark with water,and mix well.
b.Sucralose standard working solution:Respectively pipette 0.5mL,1 mL,2 mL,5 mL,10 mL of sucralose stock solution in a 10 mL volumetric flask and dilute to volume with water.The concentration of the sucralose working solution was 50 μg/mL,100 μg/mL,200 μg/mL,500 μg/mL,and 1000 μg/mL,respectively.
2.Chromatographic Conditions
Column:C18(250 mm × 4.6 mm × 5 μm).The mobile phase acetonitrile-water(11:89),the column temperature was 35℃,and the injection volume was 20 μl.
3.Sample Processing
Crushed the betel nut,and 2.0 g of the sample was weighed into a 50 mL centrifuge tube.After ultrasonic extraction for 5 min with 5 mL of water,15 mL of methanol was added to continue ultrasonic extraction for 30 min,and then centrifuged at 3000/r for 10 min,the supernatant was transferred into a separatory funnel.The precipitate was added with 5.0 mL of aqueous methanol solution(75+25).After the mixture was stirred well,ultrasonic extract for 10 min,then centrifuged at 3000/r for 10 min.The extraction was repeated twice,and the supernatant was combined in a separatory funnel.30 ml of n-hexane was placed in a separatory funnel,and the vibrational layering was carried out,and the lower aqueous phase was transferred into a 50 mL evaporating dish.The evaporating dish was evaporated on a boiling water bath.When the liquid in the evaporating dish was about 1 mL,the evaporating dish was rinsed three times with 9 mL of water,and the washing liquid was transferred and placed in a 15 mL centrifuge tube,sonicated for 5 min,and centrifuged at 3000/r for 10 min.Take all the supernatant into the activated solid phase extraction column,control the liquid flow rate to not exceed 1 drop per second,add 1 mL of water when the liquid level on the column is about 2 mm,continue to maintain the liquid flow rate of 1 drop per second,after completely exclude the liquid in the column,elute with 3 mL of methanol and collect the eluent.Placed the elution in a 50 mL evaporating dish,and evaporated to dryness on a boiling water bath.The residue was dissolved in 50.0 mL of acetonitrile aqueous solution(11+89),and the solution was passed through a 0.45 μm filter.The filtrate was used to prepare a sample solution.Measurement:20 μL of each standard working solution and sample were injected into a liquid chromatograph for analysis,and the retention time was qualitative,and the peak area was quantified by external standard method.
II.The Measurement Uncertainty Assessment
(i) Establish a Mathematical Model
The calculation formula of sucralose content in the sample is as follows:
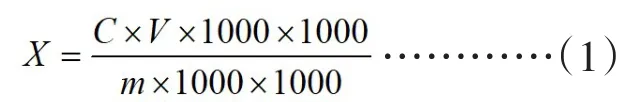
In this formula,X is the content of a component in the sample,the unit is grams per kilogram(g/kg);C is the concentration of a component in the injection solution obtained from the standard curve,the unit is micrograms per milliliter(ug/mL);V is the sample solution volume in milliliters(mL);m is the mass of the sample,the unit is grams(g).
(ii) Measurement Uncertainty Source Analysis
Considering the measurement process and calculation formula,the uncertainty sources of sucralose content determination mainly include the following aspects[5]:1.standard material;2.standard curve fitting;3.recovery rate;4.instrument response value;5.measure differences in sample handling procedures;6.measurements of the peak area of the sample.
The source of each consideration is influenced by different factors,which can be summarized as follows.
1.Uncertainty of the Total Volume V Brought into the Sample at the Time of Constant Volume
There are mainly uncertainties in the calibration of the volumetric flask and the uncertainty caused by the temperature change.
2.Uncertainty of Sucralose Content Concentration in Sample Liquid
(1)The Uncertainty Generated When C is obtained by the Concentration-Peak Area Fitting Calibration Curve of Standard Solution.
(2)Uncertainty in the Preparation of Standard Working Fluids.
It mainly includes[5]:a.uncertainty introduced by reference material;b.uncertainty caused by weighing;c.uncertainty caused by calibration of standard working fluid preparation process;d.influence of temperature change on preparation of standard working fluid.
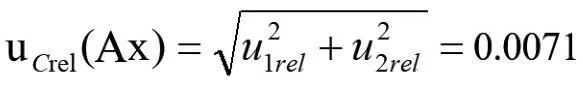
(3)Uncertainty in Measurement of Peak Area of Sample Liquid
Brought in by two aspects:1.peak area repeatability measurement;2.data processing system.
(iii) Uncertainty Introduced during Sample Weighing
(iv) Sample Characteristics and Uncertainty Brought by frep during Processing
(v) The Uncertainty Caused by Extraction of Samples, Consider in Terms of the Recovery Rate
III.Evaluation of Uncertainty Component
(i) Uncertainty of the Total Volume V Brought in at Constant Volume
1.Uncertainty Arising from the Calibration of the Volumetric Flask
In the sample processing process,50.0ml Tianbo A grade full pipette is needed.According to the requirements of“General Glass Grating Calibration Procedure JJG 196-2006”,the corresponding maximum tolerance is±0.05,considering its rectangular distribution,k=
u1=Δy/k=0.05/=2.88×10-2
u1rel=2.88×10⁻²/50=5.77×10-4
2.Uncertainty Considerations Brought in by Temperature Changes
In the analysis test,the temperature during the measurement also has an effect on it.We consider the temperature of the sample making process as 25℃and the calibration temperature of the measuring bottle as 20℃.The expansion coefficient of water is 2.1×10⁻⁴ml/℃,the temperature change is a rectangular distribution,and the standard uncertainty is:
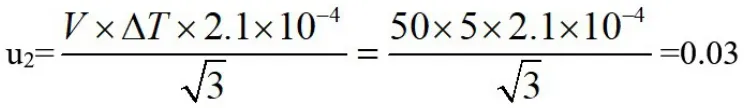
Relative standard uncertainty:u2rel=0.03/50=0.0006

Table 1 Calibration Curve Fitting Data
3.Standard Uncertainty Synthesis of Total Volume in Sample Processing
(ii) Uncertainty of Sucralose Content Concentration in Sample Liquid
1.Uncertainty Generated when Obtaining C by the Concentration-Peak Area Fitting Calibration Curve of Standard Solution
The standard uncertainty of the calibration curve fitting is determined by two repeated measurements on the standard series,and the peak area is obtained.The results are shown in Table 1 Calibration Curve Fitting Data.
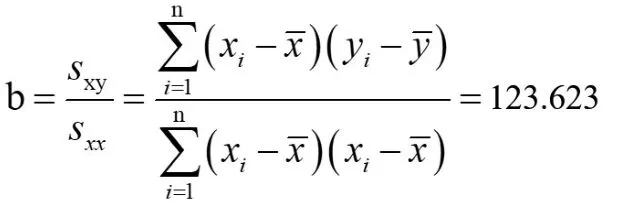
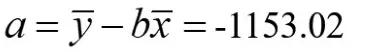
The standard curve can be obtained by fitting the experimental data[5]with the least square method.The standard uncertainty of fitting the calibration curve parameters can be calculated by statistical program.According to the measurement data,the linear regression equation y=a+bx can be used to calculate the calibration curve,and the slope b and intercept a of the fitting line obtained by the least square method are:
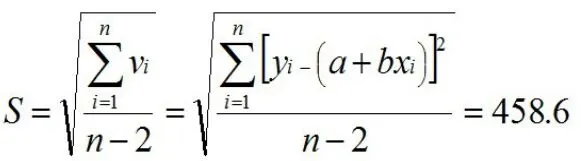
The standard deviation S of the peak area of the sucralose is:
When the curve is used for measurement,measure the sample solution twice,n=10,and the measured value of sucralose in the sample solution is 1.563 ug;the standard uncertainty u(ure)for fitting the calibration curve is:

Elative standard uncertainty sucralose urel(ure)=u(ure)/C=0.206
2.Uncertainty in the Preparation of Standard Working Fluids
(1)Evaluation of Uncertainty Introduced by Reference Material
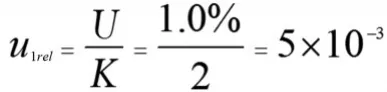
The introduction of reference material is generally a Class B assessment.According to the information provided by the sucralose standards certificate,the uncertainty is±1.0%.The reference material generally gives extended uncertainty,which is a normal distribution with a confidence level of 95%and a coverage factor k=2.The relative uncertainty is:
(2)Relative Standard Uncertainty Produced by Weighing Reference Material
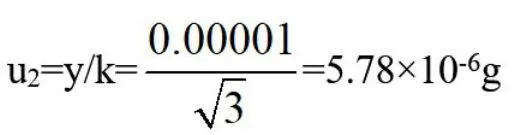
The reference material weight is:0.100g,weigh the sample with one in hundred thousand electronic analytical balance,the calibration certificate gives that the repeatability error of the balance is 0.0000g,and the indicated error of the balance is±0.00001g.The results are obtained by weighing the balance twice,and considered according to the uni-form distribution(rectangular distribution),
then:standard uncertainty:
Relative standard uncertainty:

(3)Uncertainty Evaluation of Measuring Instruments Calibration in the Process of Standard Working Fluid Configuration
The process of standard working fluid preparation requires the use of several specifications of glass measuring tools.According to the requirements of the“General Glass Measuring Tool Verification Regulation JJG-2006”,there is a corresponding maximum tolerance.According to the rectangular distribution,k=,thereby the relative uncertainty component is estimated(see Table 2).
Relative standard uncertainty synthesized from the data in table 2:
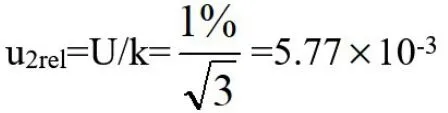
(4)Effect of Temperature Change on the Preparation of Standard Working Fluid[5]
Uncertainty arising from the lack of temperature control.According to the manufacturer's information,the gauge has been calibrated at 20℃,while the laboratory temperature is varies from± 5℃.The uncertainty caused by this effect can be calculated by estimating the temperature range and the volume expansion coefficient.The volume expansion is significantly larger than the volume expansion of the glass,so it is only necessary to consider the former.The coefficient of expansion of water is 2.1×10⁻⁴ml/℃,and the standard uncertainty is calculated by assuming that the temperature change is a rectangular distribution.

Table 2 Standard Uncertainty Caused by Glass Gauge during the Preparation of Standard Solution
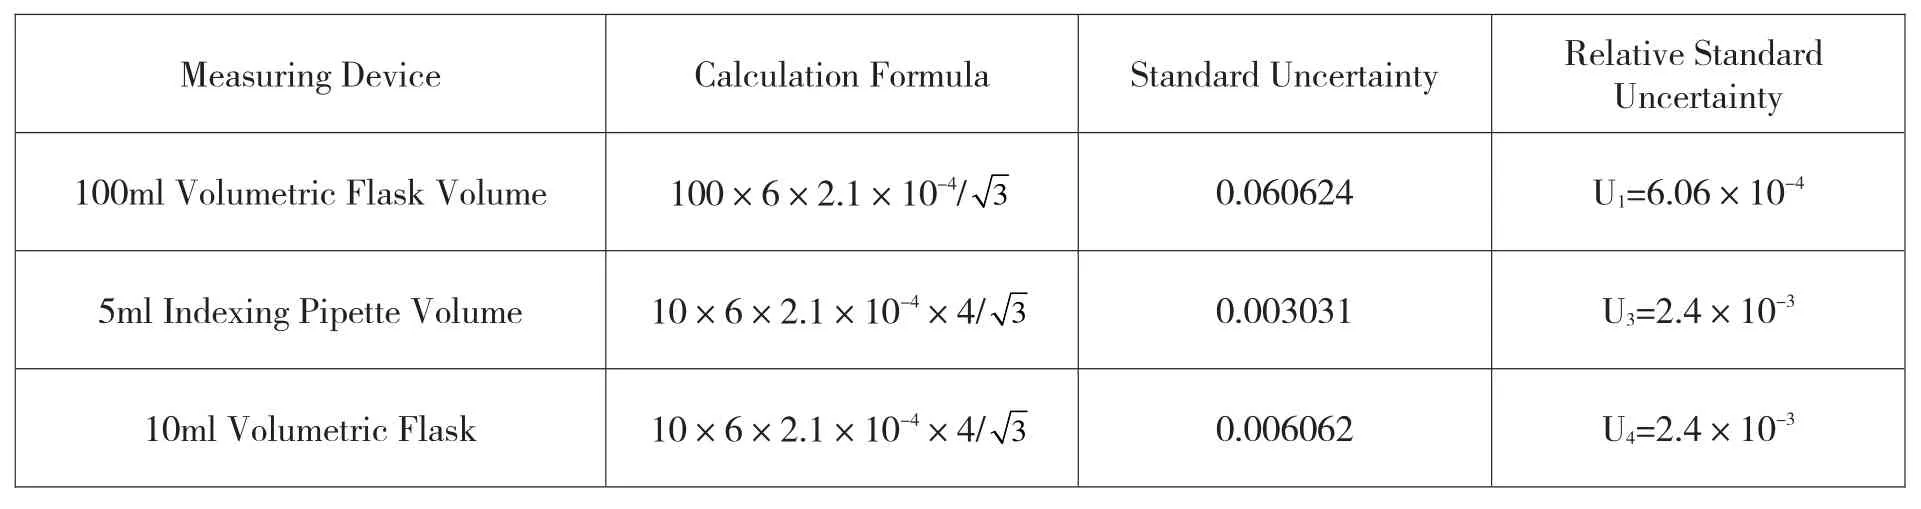
Table 3 Uncertainty in the Preparation Process of Standard Solution Series Caused by Temperature Change
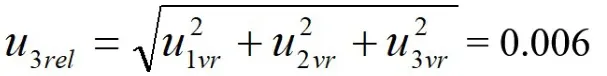
The relative standard uncertainty obtained from Table 3 is:

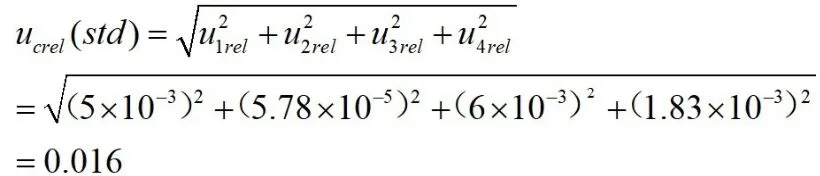
(5)Synthetic Standard Uncertainty
Relative standard uncertainty synthesized by(1),(2),(3),(4):
3.Uncertainty in the Measurement of Peak Area of Sample Liquid
(1)Uncertainty Resulting from Repeated Measurements of Peak Area
The sample was evaluated by repeating the injection for 6 times,and the peak areas of the injection were 5138.0,5091.8,5109.8,5031.4,5162.6,and 5098.5,respectively.Calculated based on the data.Due to the small number of measurements,according to JJF1059.1-2012-Bessel formula method,the range method is used for evaluation.
Standard uncertainty:

Relative standard uncertainty:

(2)Uncertainty Introduced by Data Processing Systems[5]
According to the instrument specification and the general performance index analysis of the integrator,the maximum error currently used in the peak area integration processing of the liquid chromatograph is 0.2%~1%,taking 1%,which belongs to the B category,and the relative uncertainty of the peak area is:
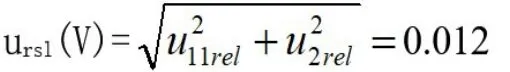
(3)Synthesis of Uncertainty in Measurement of Peak Area of Sample Treatment Fluid
The relative standard uncertainty of the peak area measurement of the sample treatment liquids synthesized by u1reland u2relis:
Then,the uncertainty of the measured value C of sucralose in the sample to be tested by the above components is:

(iii) Uncertainty Introduced during Sample Weighing Process
Thesampleweightis5.0g,accordingto JJG2053-2006“Quality Measuring Instruments Calibration System”,the mass tolerance difference Δy=1.0mg,its confidence level P=99%,is a normal distribution,coverage factor k=3.
The uncertainty is:
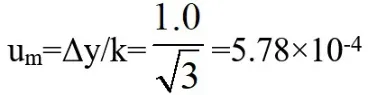
Relative standard uncertainty:

(iv) The Uncertainty of the Sample Characteristics Itself and Brought by Processing Procedure frep
The reproducibility of the test results is mainly affected by the operator's influence in the sample processing process,impact of the characteristics of the sample and the performance factors of each instrument belongs to the category A uncertainty evaluation,and the same sample is used for repeated experiments.The results of repeated experiments are shown in Table 4.
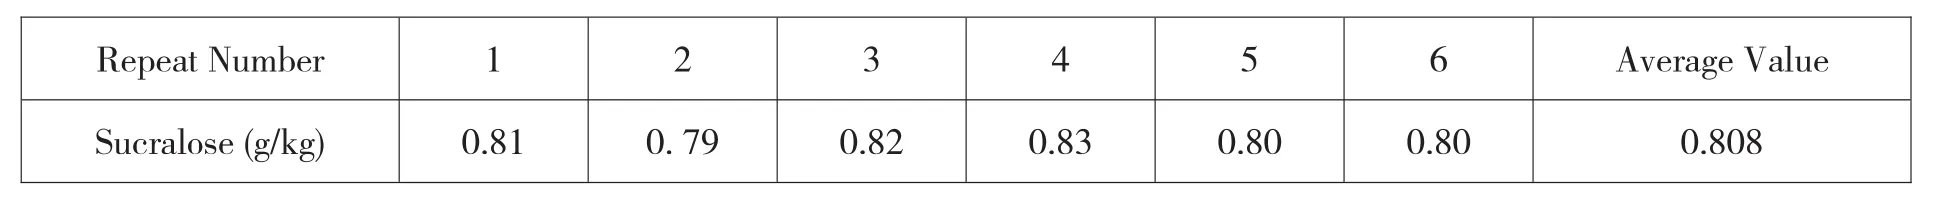
Table 4 Results of repeated experiments

Table 5 Measurement Results of Recovery Rate
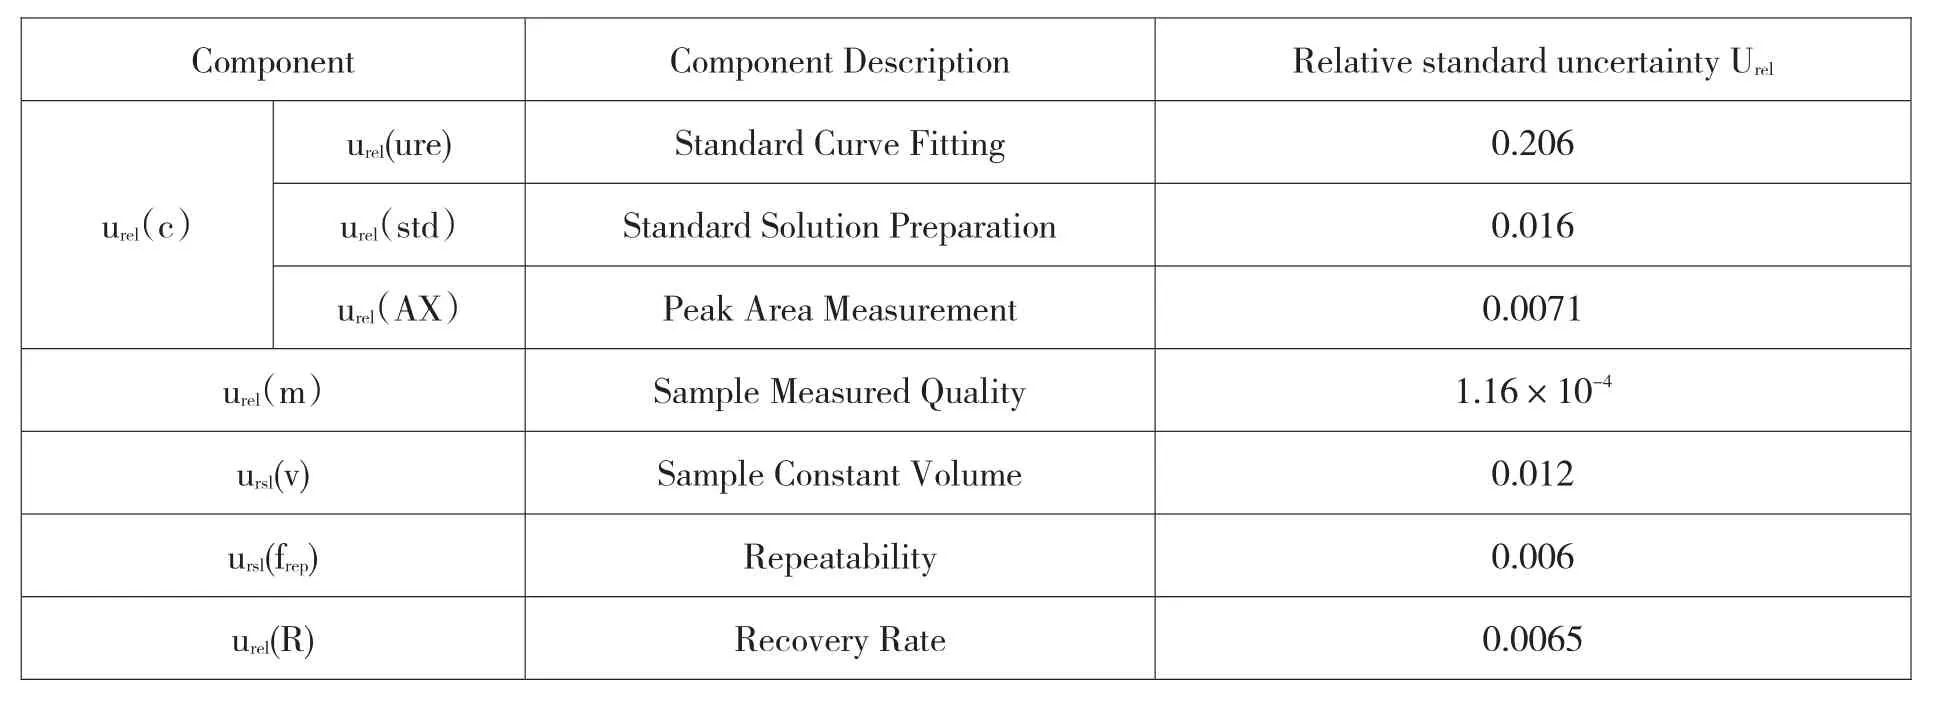
Table 6 Uncertainty components and their relative uncertainty
Standard deviation of single measurement results:
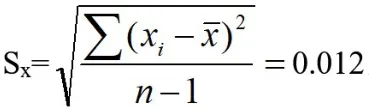
Standard uncertainty:

Relative uncertainty:

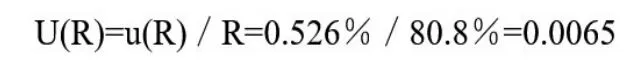
(v) Recovery Rate and Its Uncertainty Evaluation ur(Rec)
In the process of measuring the sucralose in areca nut by liquid chromatography,the sample requires ultrasonic,volume determination,extraction and concentration.In this lengthy process,the operation of each step brings uncertainty.It is quite difficult to gradually determine its contribution to the uncertainty of the measurement results.The testing method which is able to develop relevant data in the process can be used,such as recovery rate to be assessed uniformly.
The average recovery is 80.8%and the standard deviation s is 1.18%.Relative standard uncertainty of recovery rate:

III.Synthesis of Standard Uncertainty in the Measurement of Sucralose in Betel Nut
According to the above uncertainty component analysis,the synthetic standard uncertainty is:
Without considering the correlation between the inputs,the standard uncertainty is synthesized by the square and the root,

The synthetic standard uncertainty is:

IV.The Report of Measurement Uncertainty
Multiplying the synthetic uncertainty times the coverage factor k,the extended uncertainty can be obtained.With the confidence probability is 95%,the coverage factor k=2,the relative extended uncertainty is U(X)=kUrel(X),k=2,that is,U=0.020736×2=0.041472g/kg.
The content of sucralose in the betel nut sample to be tested is X1=0.81 g/kg.In summary,the uncertainty value is given when the determination result of the sucralose content in betel nut is measured by high performance liquid chromatography.The result is expressed as follows:X(sucralose)=X±U(X),k=2
That is,X(sucralose)=(0.81±0.041472)g/kg.
V.Conclusion
According to GB 22255-2014“Food Safety National Standard Food Determination of Sucralose(Sucralose)in Foods”,by comparing the components of uncertainty generated in the whole experiment,it is found that the concentration of the samples to be measured by the least square method has the greatest influence on the uncertainty of the results.Therefore,in order to reduce the measurement error,the appropriate standard solution concentration range should be selected,and ensure the content of the test solution should be in the middle of the standard curve so as to reduce uncertainty caused by the standard curve and improve the accuracy of the measurement results.
- 中阿科技论坛(中英文)的其它文章
- Application of Statistical Technique in the Management of Power Supply Enterprises at County Level
- Analysis of Existing Problems and Countermeasures of Enterprise Performance Management
- Application Analysis of ACL Technology in Small and Medium Sized Network Security Management
- Construction Analysis of Urban Underground Comprehensive Pipe Corridor Structure
- Main Disease and Control Method for Highway Widening Roadbed
- Application of Reverse Osmosis Technology in Boiler Water Treatment of Power Station