A fault prediction method for catenary of high-speed rails based on meteorological conditions
Sheng Lin· Qinyang Yu · Zhen Wang · Ding Feng · Shibin Gao
Abstract Fault frequency of catenary is related to meteorological conditions. In this work, based on the historical data, catenary fault frequency and weather-related fault rate are introduced to analyse the correlation between catenary faults and meteorological conditions, and further the effect of meteorological conditions on catenary operation. Moreover, machine learning is used for catenary fault prediction. As with the single decision tree, only a small number of training samples can be classified correctly by each weak classifier, the AdaBoost algorithm is adopted to adjust the weights of misclassified samples and weak classifiers, and train multiple weak classifiers.Finally, the weak classifiers are combined to construct a strong classifier, with which the final prediction result is obtained. In order to validate the prediction method, an example is provided based on the historical data from a railway bureau of China.The result shows that the mapping relation between meteorological conditions and catenary faults can be established accurately by AdaBoost algorithm. The AdaBoost algorithm can accurately predict a catenary fault if the meteorological conditions are provided.
Keywords High-speed rail · Catenary · Trip · Fault prediction · Data processing · Meteorological conditions
1 Introduction
In recent years, the high-speed rails (HSRs) of China have developed rapidly, which means that both scale of operation and catenary expand greatly. The traction power supply system (TPSS) of HSRs requires a very high reliability[1-3].Catenary is a key component of the TPSS,but there is no standby catenary in TPSS. Meanwhile, the stability and reliability of the catenary system are directly related to the operation state of HSRs. Therefore, an accurate fault prediction of the catenary system and timely warning is crucial to improving the reliability of the entire HSR system.
Zhao et al. [4] established a reliability model of the TPSS based on the Weibull distribution,used the proposed model to predict reliability, and obtained the reliability evolution process. However, this model is applicable only when fault occurrence follows the Poisson distribution,but this is not the case in practice. Moreover, Zhao et al.ignored the influence of meteorological conditions. The catenary system is completely exposed to the external meteorological conditions. The meteorological conditions have a significant influence on the catenary system operation [5]. Recently, Wang et al. [6] studied the influence of external environment on running state of the catenary system, and established the reliability evaluation model in three-state weather.
In power systems, the influence factors such as the external environment on power load forecasting, life prediction, and fault prediction has been highlighted [7, 8].The power load forecasting methods, which consider the influence of weather conditions, have made significant progress in the weather-sensitive load [9, 10]. In addition,using the real-time electricity price,He et al.[11]proposed a method for forecasting the probability density of the power load. In terms of life prediction, scholars [12-14]used the rough set theory, cross-entropy theory, stochastic process simulation, and other methods to predict the equipment remaining life, and considered the influence of the external service environment on electrical equipment.Andre et al. [15, 16] used the Monte Carlo simulation to develop a model for the prediction of fault rate, fault type,and fault duration of transmission line and bus, and forecasted the annual outage times of the power system. Their model was based on the history of fault data, but the influence of the external environment on transmission lines was ignored. In [17], indexes including the meteorological sensitivity rate, difference of fault number, outage time were introduced to reflect the difference of transmission line risks for different meteorological disasters.In[18,19],the temporal characteristics of transmission line faults were analysed,the time-varying fault rate simulation model was established, and the fault time distribution was simulated for risk assessment of a transmission line. A fault warning method based on the support vector machine (SVM) and AdaBoost method were proposed in [20]. All the abovementioned studies consider the influence of external meteorological environment on power system on various levels, which can provide a reference for catenary fault prediction. As there are great improvements in the data acquisition,monitoring,and system management,catenary fault prediction can be supported with comprehensive data.Thus, it is significantly important to consider the overall influence of meteorological conditions on the fault prediction of catenary system.
The main objective of this work is to develop a catenary fault prediction method which can accurately and timely predict the catenary fault based on the external meteorological conditions, and provide decision support for the operation and maintenance of HSRs. In this paper, based on the AdaBoost algorithm,a method is proposed to predict the catenary fault. The proposed method establishes the mapping relation between meteorological conditions and catenary faults. It can predict catenary fault accurately if the meteorological conditions are provided.
The remainder of this paper is organized as follows.Section 2 introduces the influence of meteorological conditions on catenary faults. Section 3 briefly describes the AdaBoost and single decision tree algorithms. Section 4 presents the pre-processing method for historical statistical data and construction of training samples.A case study and the result analysis are provided in Sect. 5, followed by the conclusions in Sect. 6.
2 Influence of meteorological conditions on catenary faults
The catenary system is completely exposed to the complex environment. According to field surveys by a railway bureau, the meteorological conditions are one of the influential factors that cause catenary faults.In this work,a trip of the TPSS caused by the catenary system is regarded as a catenary fault, and the influence of meteorological conditions on the catenary fault occurrence is analysed quantitatively.
2.1 Temporal distribution characteristics of catenary faults
The number of catenary faults and their causes can be collected by field surveys.The results in[21]show that the working state of a catenary system is highly influenced by the external meteorological conditions, such as thunderstorms, gale, snow, and others. The number of catenary faults on a monthly basis under various meteorological conditions was collected by the railway bureau in northwest China from 2012 to 2015, as shown in Fig. 1.
According to Fig. 1,the most influential meteorological conditions in northwest China are, respectively, the gale and dense fog from March to April, the thunderstorm and gale from May to October, and the snow and gale from November to February. Meanwhile, when the days of the most influential meteorological condition increase or decrease, the number of catenary faults changes correspondingly. Therefore, there is a strong correlation between the meteorological conditions and the number of catenary faults.
2.2 Spatial distribution characteristics of catenary faults
In order to depict the spatial distribution characteristics of catenary faults, the catenary fault frequency (CFF) is introduced and defined as

where CFFindicates the catenary fault frequency in a year per kilometre, lithe length of line i, oithe number of catenary faults in a year, and z the number of lines.
According to the data for central China in the period of 2012-2015, the corresponding CFF for each power supply section of Wuhan Bureau is shown in Fig. 2, which is calculated by Eq. (1).

Fig. 2 CFF in central China regions in the period of 2012-2015
As can be seen in Fig. 2, catenary fault frequency is diverse across regions. Namely, the CFF of Wuchang region is the largest,reaching the maximum of 0.85 times/km in 2012,and then followed by those of the Hanyang and Huangzhou regions with the CFF of more than 0.5 times/km in three statistical years.There was no catenary fault in the Jingzhou region during 2013-2015 and in the Wuxue region in 2012 and 2013. Meanwhile, the CFF of the Huangpo region is the lowest within the whole statistical period.Therefore,it can be concluded that CFF is strongly correlated to the geographical locations.
In order to reveal the temporal and geographical correlation between the meteorological conditions and number of catenary faults, the fault data from the railway bureaux in northwest and central China are statistically analysed on a monthly basis, and the results are shown in Fig. 3.
Figure 3 indicates that the catenary faults in these two regions are mainly concentrated in June, July, and August.However, in December and January, the proportion of catenary faults in northwest China is higher than in central China. In view of the meteorological characteristics of the two regions, the main reasons for such results may be concluded as follows.Both in central and northwest China,there is the maximum amount of thunderstorm, gale, rain and high temperature in June, July, and August. Besides,snow and low temperature mainly occur in December and January.In central China,the summer lasts for a long time,and the weather conditions do not fluctuate drastically during winter. In addition, the catenary system is almost unaffected by icing due to fewer snow and low temperature.Therefore,the fault distribution of the catenary system in central China can be approximated by a ‘‘single-peak’’model.In contrast,the northwest region has a longer winter with snow and ice. Therefore, the fault distribution of catenary system in the northwest region can be approximated by a ‘‘peak-valley’’ interlaced model.

Fig. 3 Proportion of catenary faults in different regions in China
2.3 Analysis of meteorological conditions influence on catenary faults
The influence of meteorological conditions on catenary faults is always reflected in factors such as precipitation of rainstorm,heavy rain,moderate rain,thunderstorm,shower and light rain, wind speed, and temperature [21, 22].
1. Influence of precipitation. On the one hand, precipitation affects air humidity and insulation performance,and causes flashover because of the damp. Moreover,the water flow on the equipment surface can easily cause a short circuit. On the other hand, if there is lightning in rainy days, the lightning may lead to overvoltage and insulation damages; moreover, the overvoltage may invade the substation and cause trip.
2. Influence of wind speed. First, high wind speeds lead to catenary wire tension. Second, the gale causes the vibration of catenary wire and affects the current collection performance of the pantograph. Most importantly, the branches, plastics, and other foreign bodies blew by the gale may hang from the catenary,resulting in the short circuit.
3. Influence of temperature. The high temperature leads to the large tension of contact wires and short insulation distance, resulting in the short circuit.Meanwhile, under the low temperature, ice accumulates on a wire, which interrupts the current flow from contact wire to the pantograph.
2.4 Statistical analysis on influential factors of catenary faults
The influential factors are analysed using the actual data of the Beijing-Shanghai HSR (with a length of 1318 km)collected in the period of 2012-2015.The statistical results are shown in Table 1.Moreover,weather-related fault rate(WRFR)is introduced to represent the correlation between various meteorological conditions and the number of catenary faults.It indicates the frequency of catenary faults under a particular meteorological condition:

where, qidenotes the number of catenary faults on line i under the particular meteorological condition, lidenotes the length of line i, tWBis the statistical time of a certain weather condition, and z is the number of lines.

Table 1 Statistical results of the data form Beijing-Shanghai HSR in the period 2012-2015

Fig. 4 FRWB under different weather conditions
Using the statistical data given in Table 1 and the Eq. (2), the WRFR can be calculated as shown in Fig. 4.
As can be seen in Fig. 4, the WRFR under the gale,dense fog, and rain is higher than that under the normal weather. The highest fault rate is under the heavy rain condition. In general, the worse the weather is, the greater the possibility of a fault is. The influence of multiple uncertain factors makes it difficult to build an accurate mathematical model for catenary faults. In fact, there is a coupling relationship between various meteorology conditions. The catenary faults prediction is to determine whether the system could work healthily in the next period of operation with the current system state.It is often based on the massive multi-source data provided by the monitoring system. The fault prediction can be viewed as a classification prediction problem with supervised learning. In most cases, the learner accuracy is significantly influenced by training data and its distribution, and it is hard to build accurate classifiers directly. However, it is easier to generate a relatively accurate weak classifier. The AdaBoost algorithm is one of the most widely used machine learning methods for training different weak classifiers using the same training set.After training,the weak classifiers can be combined into a strong classifier. Namely, by combining the attributes of weak classifiers,the resultant classifier can possess a stronger generalization ability.
3 AdaBoost algorithm
3.1 Basic theory of AdaBoost algorithm
The AdaBoost algorithm is an important characteristic classification algorithm for machine learning, and it is widely applied to the power system fault warning [20],wind speed prediction[23],and other fields[24,25].Zhang et al. [26] compared the prediction accuracy of SVM, BP neural network, and AdaBoost, and indicated the superiority of AdaBoost algorithm.
The basic idea of the AdaBoost algorithm is to integrate a large number of weak classifiers that have a general classification ability to form a classifier with a strong classification ability. The specific steps of the AdaBoost algorithm are as follows.
1. Select a weak learning algorithm C based on a single decision tree, and construct a training set G which is expressed as G = {(x1,y1),(x2,y2),…,(xp,yp),…,(xm,ym)}, where m denotes the number of samples.
2. Assume that the sample weight distribution Vnrepresents the weight of a sample in the nth iteration.Initialize the sample weights, V1= (v1, v2, …, vm)= (1,1,…,1)/m,n = 1,2,…,N,where N denotes the number of iterations.
3. When n = 1,2,…, N,train a weak classifier Cn(X)by the single decision tree method and classify the original training set X by Cn(X); the classification result is expressed as Cn(αj), X = (x1, x2, …, xp, …,xm).
4. Calculate the classification error rate of Cn(X) by

5. Calculate the weight of Cn(X) by

6. Update sample weight distribution:

7. Repeat Steps 3-6 for N times to obtain N different weak classifiers.
8. Combine all the trained weak classifiers into one strong classifier which is defined by

3.2 Construction of weak classifiers
In this work, the single decision tree [27, 28] is chosen to construct weak classifiers. The decision tree makes a decision by using the threshold division method for a single feature vector. This method has the following advantages:short computation time, fast calculation, and certain accuracy. In addition, this method can be well adapted to the AdaBoost algorithm. The specific steps of the single decision tree are as follows.
1. Assume a weight vector Vn= (v1, v2, …, vp, …, vm),where m is the number of samples.
2. Extract the characteristic values of each column in matrix G to form a new vectorwhere s is the number of the characteristics.
3. Determine the threshold Hkaccording to the data size of vector αj:

4. Initialize an m × 1 column vector βj,and classify each element of vector αjby mode 0 and mode 1 to obtain the classifications β0jand β1j, respectively.
5. Initialize an m × 1 column vector e, and compare the corresponding elements of β0j, β1jand Y = (y1,y2,···,ym)T. If the obtained values are the same, the elements in the respective location of e are modified to 0,and the modified vectors are denoted as e0Kand e1K.Then,use Eq. (8)to calculate the error rate of the two classification methods by

where r is equal to 0 or 1,and it expresses the classification method.
6. Repeat Step 3-5 K times, and record the error rates of classifiers with the corresponding thresholds and classification models.
7. Repeat Step 2-6 s times,and select the eigenvector αj,whose threshold equal to HKand classification models correspond to the minimum error rate. Finally, calculate the classification function of a weak classifier by

4 Fault prediction on catenary system
4.1 Statistic and process input data for AdaBoost
As the field data contains much complex information, it is difficult to predict the catenary faults directly.Namely,the data should be first screened for validity.The required data can be divided into two types:historical running-state data and meteorological data. It also includes the catenary operating states, catenary fault types, protection information, catenary outage time, operation conditions, and weather information during the predicted period. The data types and sources are presented in Table 2. The meteorological data should be standardized and transformed into a mathematical form by attribute construction and discretization.
4.1.1 Attribute construction
The attribute sets of meteorological conditions include the precipitation grades, mean temperature grades, and wind scales during daytime and night.
4.1.2 Discretization of meteorological data
1. According to the rainfall intensity, the precipitation is divided into seven grades as shown in Table 3.
2. Use the equal-width division method to discretize the continuous temperature variables:

Table 2 Data types and sources

Table 3 Precipitation grade classification

where Pfrefers to the range of the temperature level,f = 1,2, …, F, F is the number of divisions, and Tmaxand Tmindenote the maximum and minimum temperatures in the statistical time, respectively.
3. Classify the wind power into 0-12 grades according to the standard of China Meteorological Administration.
4.2 Construction of sample set
The catenary fault may be caused by impact effect of weather conditions. For example, lightning or strong wind leads to short-circuit trip of the TPSS. On the other hand, it may be a product of cumulative effects from external meteorological conditions, such as short circuit due to low sag of contact line over long time of high temperatures and flashover of the insulation device caused by continuous rainfall.
The external meteorological conditions are considered as a characteristic vector X that affects the catenary fault occurrence, and Y that denotes whether there is a fault on catenary. The sample set is constructed according to Sect. 4.1. Suppose that there are m data samples; then, the constructed sample set can be expressed as matrix G,where p = 1, 2, …, m, j = 1, 2, …, s, and s is the number of characters that could be taken into account, and the matrix G is expressed as
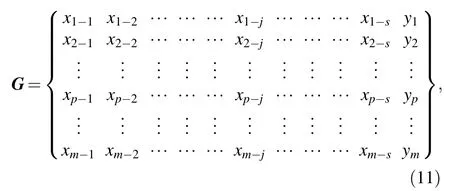
where xp-jdenotes a set of influential factors such as precipitation, temperature, and wind scale on sample p;yp= (- 1∨1), the value of - 1 means no catenary fault,and the value of 1 a catenary fault.
4.3 Catenary fault prediction based on AdaBoost
The catenary fault prediction based on the AdaBoost algorithm includes the following steps.
1. Input the training data, including the catenary fault data and meteorological data.
2. Set the initial weight V1and iteration number N, and initialize the AdaBoost algorithm.
3. Update the weights through the iterative computation.Train the optimal decision tree by different weights of Vn. Construct multiple weak classifiers, and combine them with the weights to generate a strong classifier.
4. Use the future meteorological data provided by the Weather Forecast as an input data for fault prediction,and obtain the final prediction result using the trained strong classifier.
The specific calculation flow chart is shown in Fig. 5.
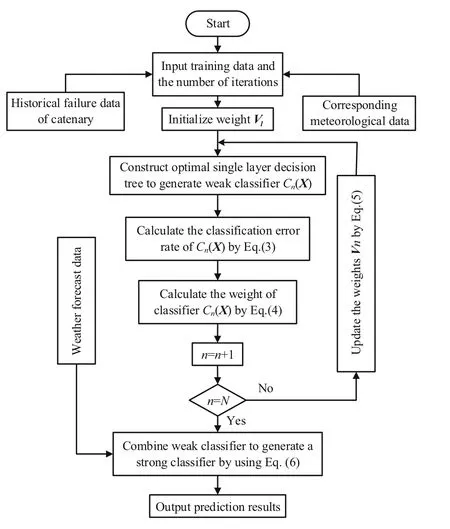
Fig. 5 Flow chart of the catenary fault prediction

Table 4 Temperature classification
5 Case study
5.1 Data selection and standardization
During data pre-processing, we found that the real-time meteorological data records in 2014 were not complete, as they could not match the catenary operation records.Therefore, we selected the real-time meteorological and catenary operation data in 2011, 2012, 2013, and 2015 from the railway bureau. The statistical data collected in June 2011, June 2012, and June 2013 were selected as the training data, and the data collected in June 2015 was selected as the test data. The training data consisted of 43 events,including 10 fault events and 33 normal events.The test data consisted of 18 events, including 2 fault events and 16 normal events.
The historical data was pre-processed by the steps introduced in the previous chapter. The field data analysis revealed that in the selected samples,there is no fog-related fault. At the same time, the Meteorological Information System showed that there was no foggy day in the seasons of study. Therefore, fog was not considered in the training and test data. In the selected samples, the lowest temperature was 17 °C, and the highest temperature was 33 °C.The detailed temperature classification calculated by Eq. (10) is given in Table 4.
The data samples include the recording time, precipitation grade, temperature grade, wind scale, and catenary state. Through data pre-processing, the training sample set and test sample set are presented in Tables 5 and 6.
5.2 Construction of strong classifier
The training data was divided into two categories. One category only shows the influence of precipitation, and the other one shows the joint influence of precipitation, wind scale, and temperature. For simplicity, we only take the influence of precipitation grade as an example to illustrate the processes of constructing the weak classifiers based on the single decision tree and training the weak classifier based on the AdaBoost.
The representation matrix of training data about precipitation grade was as follows:
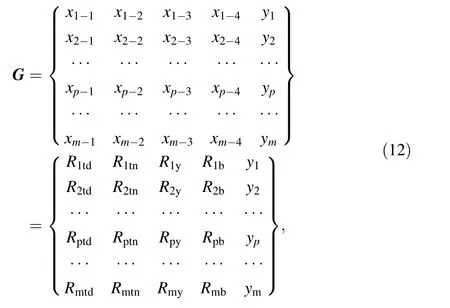
where, Rptd, Rptn, Rpy, and Rpbindicate the precipitation grades in the current daytime, current night, the average precipitation grade on the previous day, and the average precipitation grade for 2 days before the current day with respect to sample p, respectively.
Then, the weights were initialized as V1= (1, 1, …, 1)/43. Following the weak classifier calculation process, the optimal decision feature vector of the first weak classifier was obtained as α2= (x1-2,x2-2,…,xp-2,…,x43-2)T,and the classification function was given as:


Table 5 Training sample set

Table 6 Test sample set
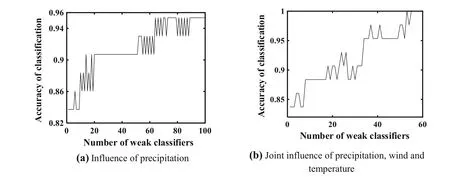
Fig. 6 Classification accuracy under different meteorological conditions
where xp-2represents the eigenvalues of an eigenvector α2in a line p, and 5.4 is the threshold value calculated by Eq. (7).
Finally, the error rate of each classifier was calculated and the weights were adjusted to obtain a strong classifier by the AdaBoost algorithm. Using the two above-mentioned categories,two different training sets were obtained,respectively. Then, the accuracy on each training set was calculated, as shown in Fig. 6.
In Fig. 6, the accuracy on both training sets increases with the number of weak classifiers. In Fig. 6a, the maximum accuracy is 0.9535, and the curve tends to become stable when the number of classifiers reaches the value of 64. In Fig. 6b, the maximum accuracy of 1 is achieved when the number of classifiers reaches the value of 53.Thus, in the case of joint influence of precipitation, wind,and temperature, the accuracy of classification is higher and less number of weak classifiers is required compared with the case of a single influence of precipitation.
By comparison,it is observed that the results of the first training set have more oscillations and lower accuracy.Thus,we select the precipitation,wind,and temperature as influential factors to construct weak classifiers.
5.3 Results of catenary faults prediction
The proposed fault prediction method was evaluated through a comparison with the decision tree and BP neural network algorithm on the test data,and the obtained results are shown in Table 7. And the bold number in Table 7 indicates the inaccurate prediction result.
According to the results presented in Table 7, the prediction accuracy of the AdaBoost was 88.89%, and almost all the catenary faults were correctly predicted except for two errors.The first one was the data on 02 June 2015,and the second one was the data on 26 June 2015. The Ada-Boost algorithm predicted that there was a high fault probability on catenary under current meteorological conditions,which is a false alarm.With more sample data,the prediction accuracy of the AdaBoost algorithm can gradually stabilize at about 90% [24, 26].
The prediction accuracy of the decision tree is 77.8%and the BP algorithm is 83.3%,which were lower than that of the AdaBoost algorithm. In this paper, the single decision tree algorithm is the weak classification algorithm to construct the strong algorithm. Therefore, the prediction accuracy will be significantly lower than the AdaBoost algorithm. For the BP neural networks, although thetraining accuracy can reach 100%,the generalization effect is worse than the AdaBoost algorithm. Moreover, because of randomness in the learning phase,the BP algorithm may converge to local minima. In conclusion, the strong classifier constructed by the AdaBoost algorithm had a stronger generalization ability than the single decision tree and BP neural network.
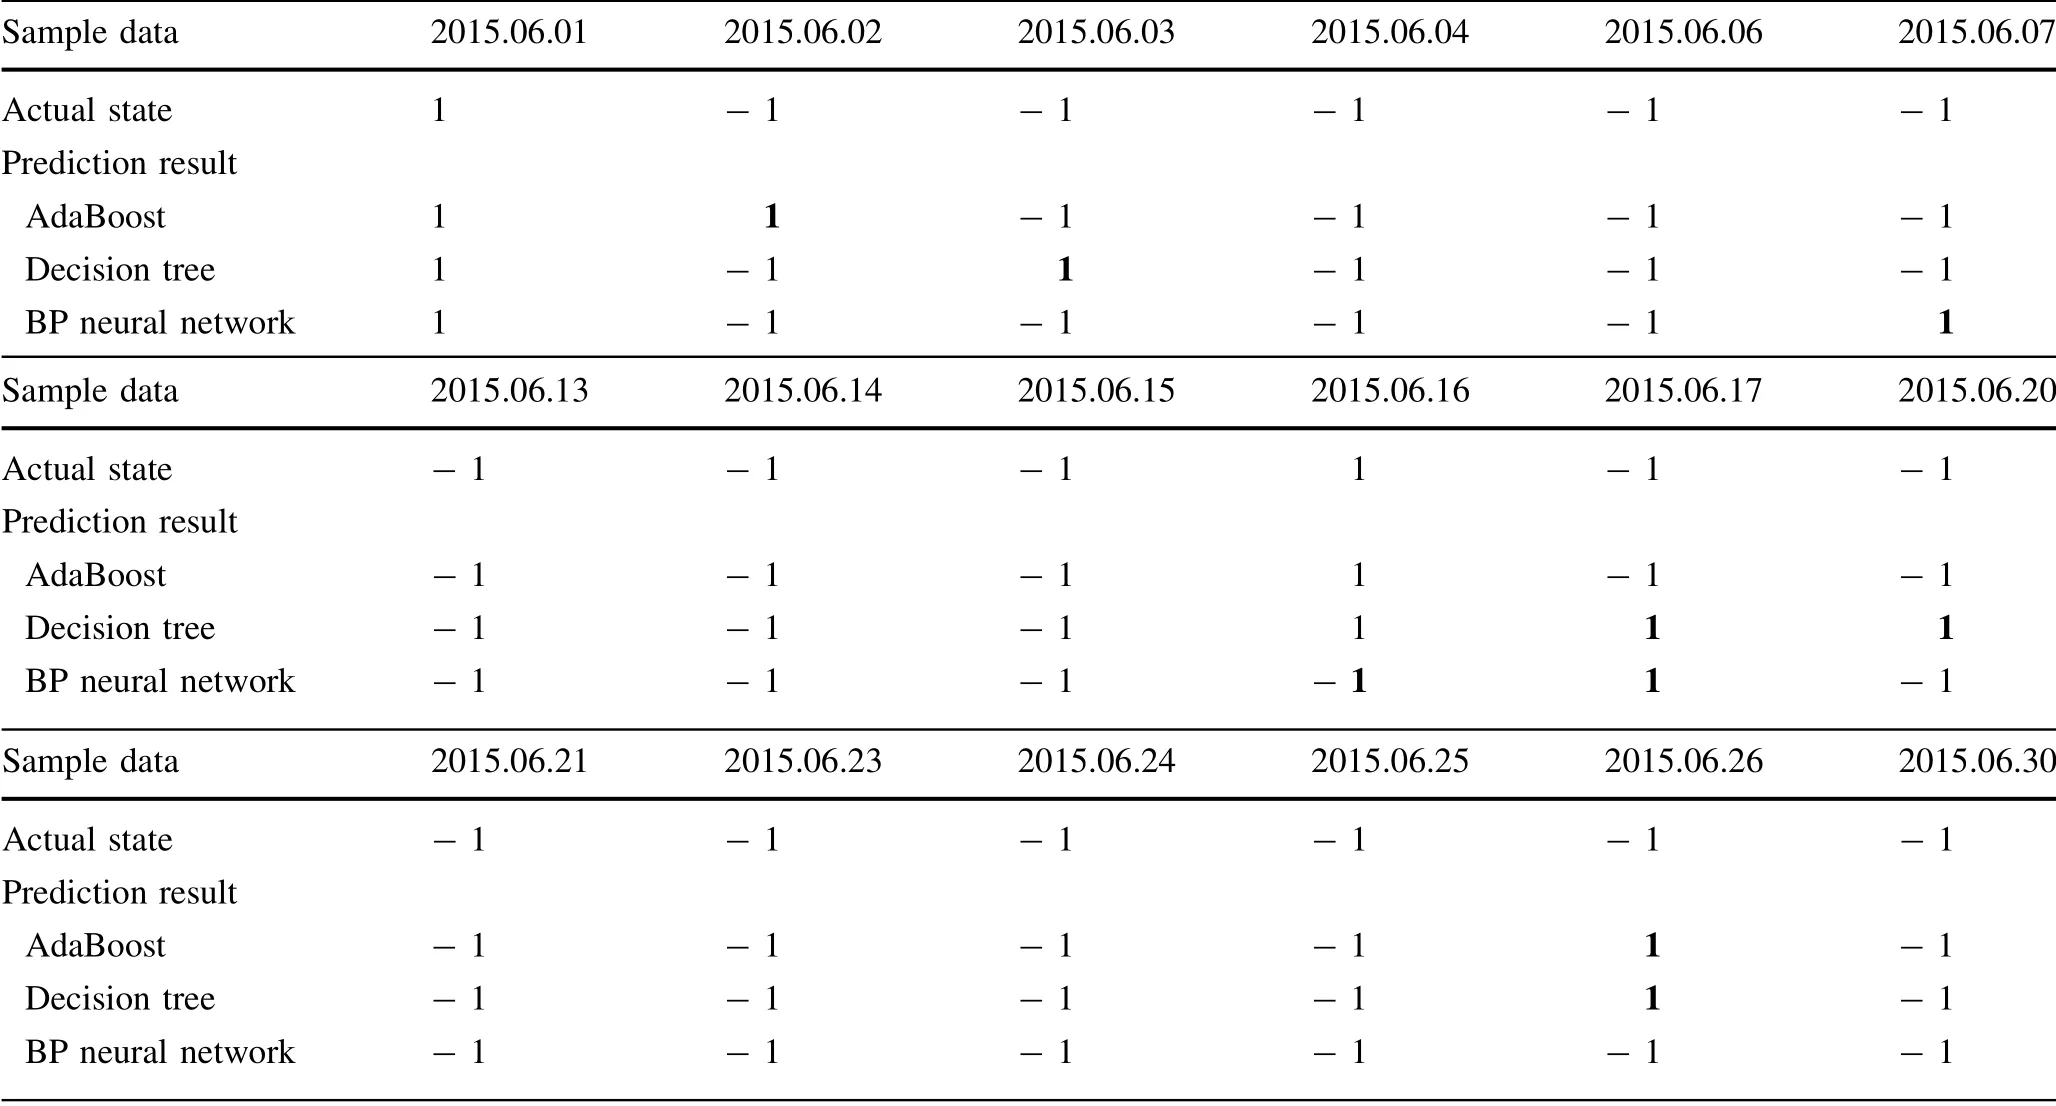
Table 7 Fault prediction results on the test set
However, the method of machine learning needs to be improved in the following aspects. First, the AdaBoost algorithm uses the single decision tree for weak classifiers construction in this work. Since only the decision tree is used in the training process, the accuracy of prediction results with decision tree is not high enough,which further decreases and limits prediction accuracy of the strong classifier. This problem may be solved by using better classification methods such as support vector machine(SVM). Furthermore, the AdaBoost algorithm constructs a strong classifier by updating the weights of different weak classifiers, but it pays more attention to the misclassified samples in the training process. Thus, the weights of samples that are easily misclassified will gradually increase with the number of iterations. This leads to the imbalance of samples and causes the decrease in classification accuracy. This problem can be solved by optimizing the weights updating process of the classifiers.
6 Conclusions
The external meteorological conditions, including the precipitation, wind speed, and temperature, have a significant impact on catenary fault. In this paper, the relationship between the catenary fault and meteorological conditions is analysed. The cumulative effect of meteorological conditions on the catenary system is taken into account in catenary fault prediction, and the AdaBoost algorithm is utilized to construct a strong classifier to predict the catenary fault by using the historical meteorological data. The obtained prediction results demonstrate that the AdaBoost algorithm could provide prediction for the catenary faults with an accuracy of 88.89% by considering the external meteorological conditions.
AcknowledgementsThis work was supported by the Scientific and Technological Research and Development Program of China Railway Corporation under Grant N2018G023, and by the Science and Technology Projects of Sichuan Province under Grants 2018RZ0075.
Open AccessThis article is distributed under the terms of the Creative Commons Attribution 4.0 International License (http://creativecommons.org/licenses/by/4.0/), which permits unrestricted use,distribution,and reproduction in any medium,provided you give appropriate credit to the original author(s) and the source, provide a link to the Creative Commons license, and indicate if changes were made.
 Railway Engineering Science2019年3期
- Railway Engineering Science的其它文章
- Correction to: Can a polycentric structure affect travel behaviour? A comparison of Melbourne, Australia and Riyadh,Saudi Arabia
- Using Kalman filter algorithm for short-term traffic flow prediction in a connected vehicle environment
- Statistical delay distribution analysis on high-speed railway trains
- Event management architecture for the monitoring and diagnosis of a fleet of trains: a case study
- Speed profile optimization of catenary-free electric trains with lithium-ion batteries
